| Param | Original file | Final file |
|---|---|---|
| Filename | modeM0/AS1C09_011T07_9000006488_53032cztM0_level2.fits | modeM0/AS1C09_011T07_9000006488_53032cztM0_level2_quad_clean.evt |
| Size (bytes) | 762,304,320 | 72,973,440 |
| Size | 727.0 MB | 69.6 MB |
| Events in quadrant A | 6,881,570 | 418,807 |
| Events in quadrant B | 4,120,179 | 588,067 |
| Events in quadrant C | 7,229,009 | 450,647 |
| Events in quadrant D | 9,522,833 | 332,905 |
| Mode SS | |||
|---|---|---|---|
| Quadrant | BADHDUFLAG | Total packets | Discarded packets |
| A | 0 | 120 | 0 |
| B | 0 | 120 | 0 |
| C | 0 | 120 | 0 |
| D | 0 | 120 | 0 |
| Mode M9 | |||
|---|---|---|---|
| Quadrant | BADHDUFLAG | Total packets | Discarded packets |
| A | 0 | 11 | 0 |
| B | 0 | 11 | 0 |
| C | 0 | 11 | 0 |
| D | 0 | 11 | 0 |
| Mode M0 | |||
|---|---|---|---|
| Quadrant | BADHDUFLAG | Total packets | Discarded packets |
| A | 0 | 24786 | 1 |
| B | 0 | 16540 | 2 |
| C | 0 | 25702 | 1 |
| D | 0 | 32490 | 1 |
| Quadrant | Total seconds | Saturated seconds | Saturation percentage |
|---|---|---|---|
| A | 6005 | 1810 | 30.141549% |
| B | 6004 | 230 | 3.830779% |
| C | 6004 | 1247 | 20.769487% |
| D | 6005 | 2287 | 38.084929% |
Noise dominated data is calculated using 1-second bins in cleaned event files. If a bin has >2000 counts, and if more than 50% of those come from <1% of pixels, then it is considered to be noise-dominated and hence unusable.
| Quadrant | # 1 sec bins | Bins with >0 counts | Bins with >2000 counts | High rate bins dominated by noise | Noise dominated (total time) | Noise dominated (detector-on time) | Marked lightcurve |
|---|---|---|---|---|---|---|---|
| A | 7045 | 6006 | 1773 | 1773 | 25.17% | 29.52% | 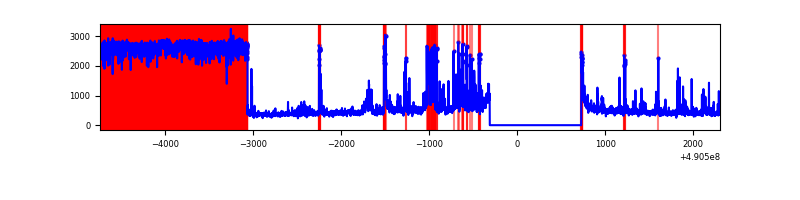 |
| B | 7044 | 6005 | 152 | 152 | 2.16% | 2.53% | 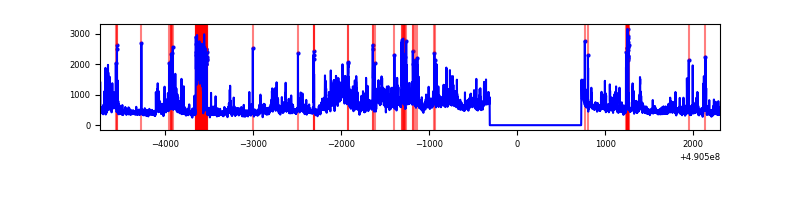 |
| C | 7044 | 6004 | 1269 | 1269 | 18.02% | 21.14% | 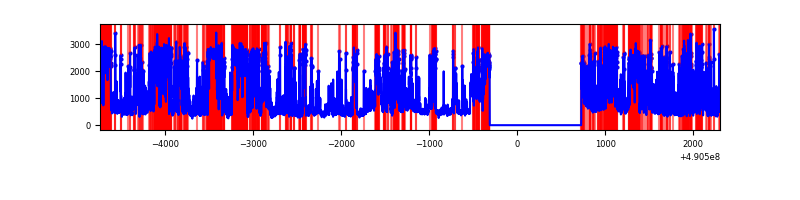 |
| D | 7045 | 6005 | 2339 | 2339 | 33.20% | 38.95% | 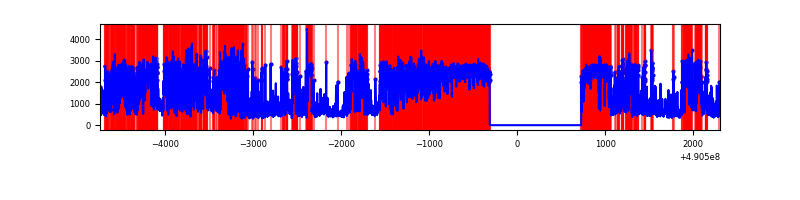 |
Top three noisy pixels from each quadrant. If the there are fewer than three noisy pixels in the level2.evt file, extra rows are filled as -1
| Pixel properties | Quadrant properties | ||||||
|---|---|---|---|---|---|---|---|
| Quadrant | DetID | PixID | Counts | Sigma | Mean | Median | Sigma |
| A | 9 | 191 | 4214490 | 33765.63 | 498 | 485 | 124.8 |
| A | 7 | 206 | 415478 | 3325.22 | 498 | 485 | 124.8 |
| A | 0 | 8 | 89377 | 712.26 | 498 | 485 | 124.8 |
| B | 10 | 254 | 352093 | 2773.46 | 597 | 577 | 126.7 |
| B | 10 | 44 | 338082 | 2662.92 | 597 | 577 | 126.7 |
| B | 14 | 167 | 260995 | 2054.7 | 597 | 577 | 126.7 |
| C | 1 | 241 | 2132206 | 14230.83 | 542 | 539 | 149.8 |
| C | 15 | 224 | 1373623 | 9166.59 | 542 | 539 | 149.8 |
| C | 7 | 80 | 741958 | 4949.65 | 542 | 539 | 149.8 |
| D | 8 | 176 | 2392000 | 17915.61 | 455 | 432 | 133.5 |
| D | 2 | 153 | 1887256 | 14134.5 | 455 | 432 | 133.5 |
| D | 12 | 17 | 1788652 | 13395.84 | 455 | 432 | 133.5 |
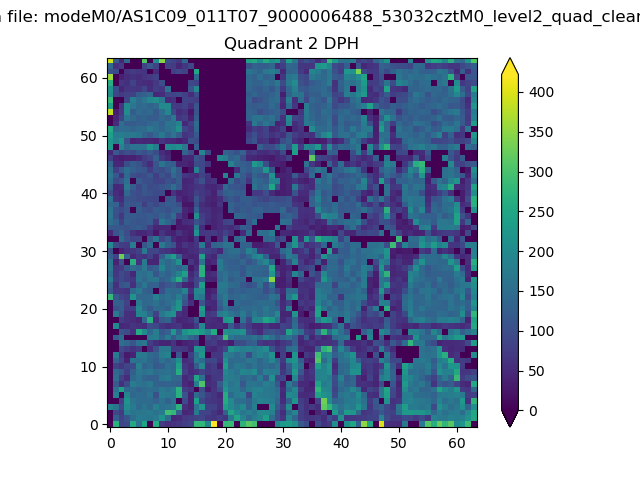
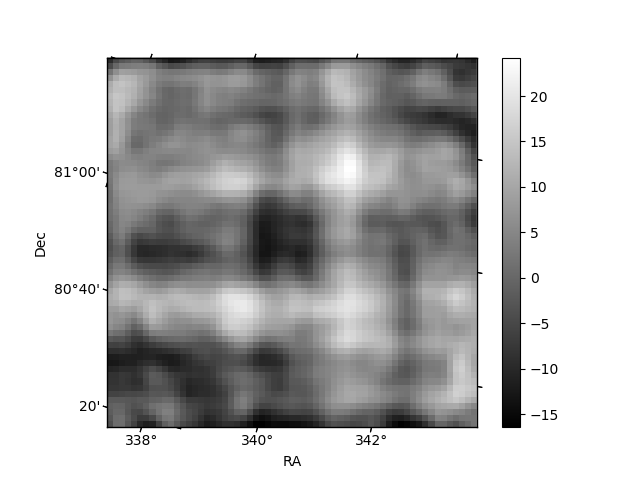
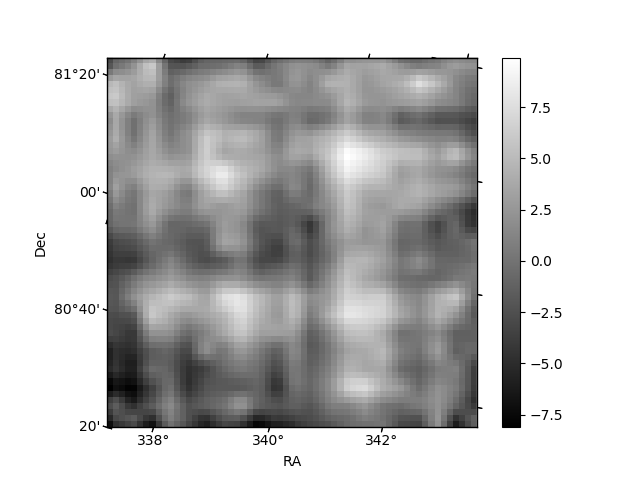
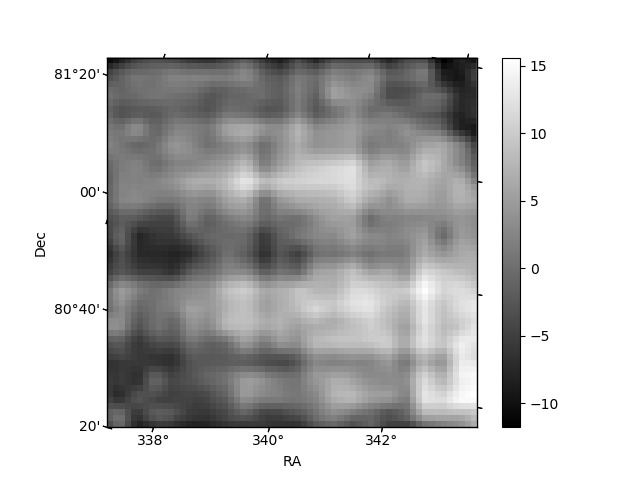
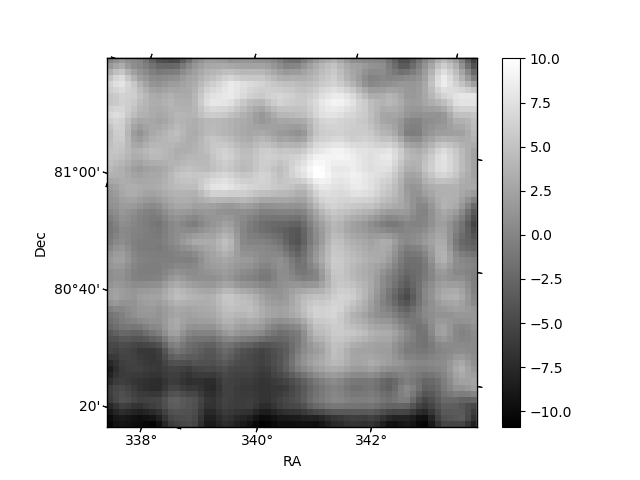
Histogram calculated using DETX and DETY for each event in the final _common_clean file
| Quadrant A | 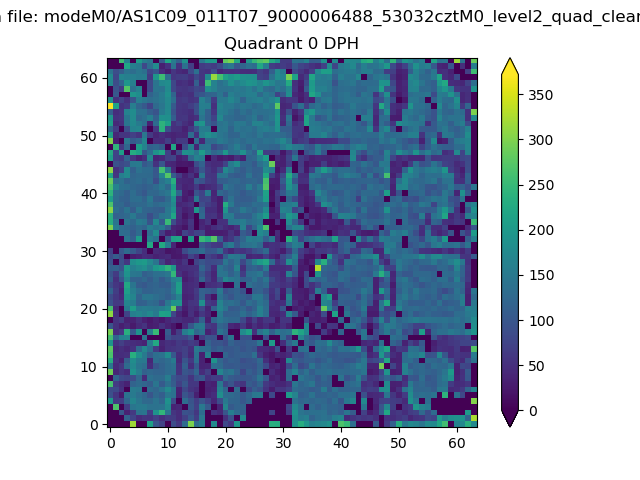 |
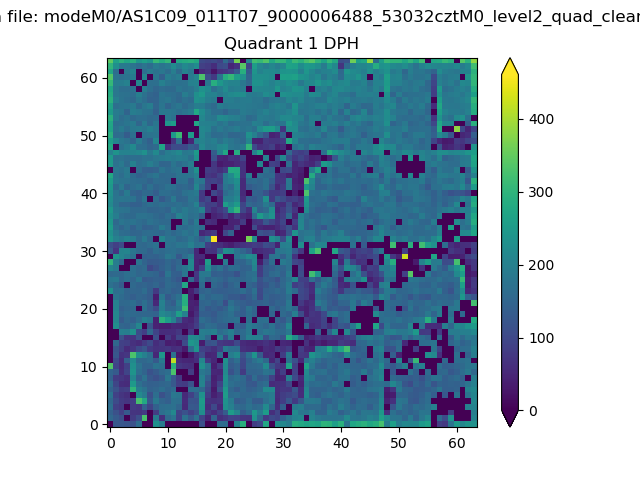 |
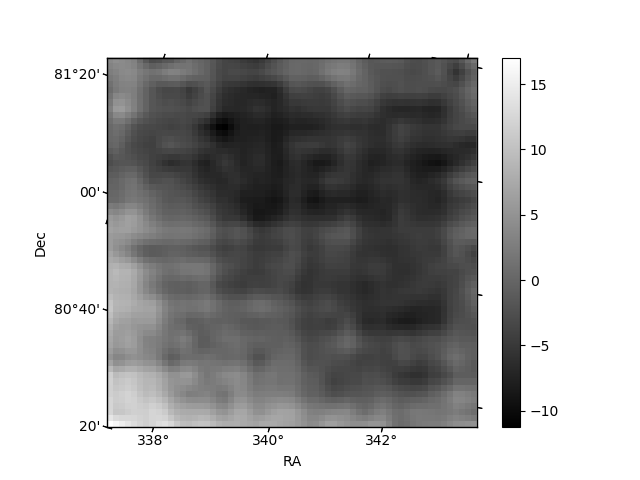
Quadrant B |
|---|---|---|---|
| Quadrant D | 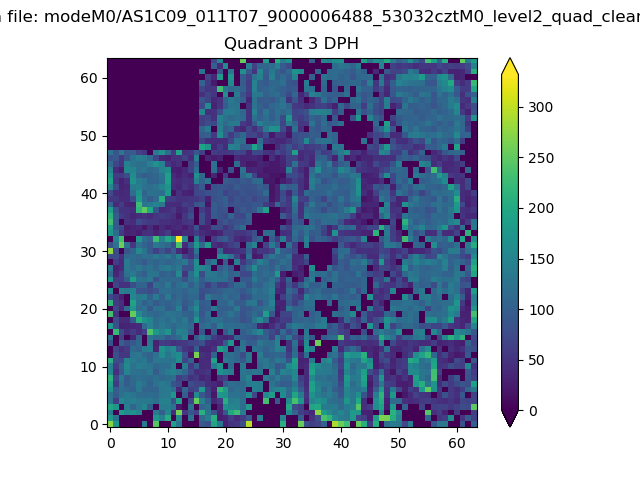 |
 |
Quadrant C |
| Plot type | Count rate plots | Images |
|---|---|---|
| Comparison with Poisson distribution Blue bars denote a histogram of data divided into 1 sec bins. Red curve is a Poisson curve with rate = median count rate of data. |
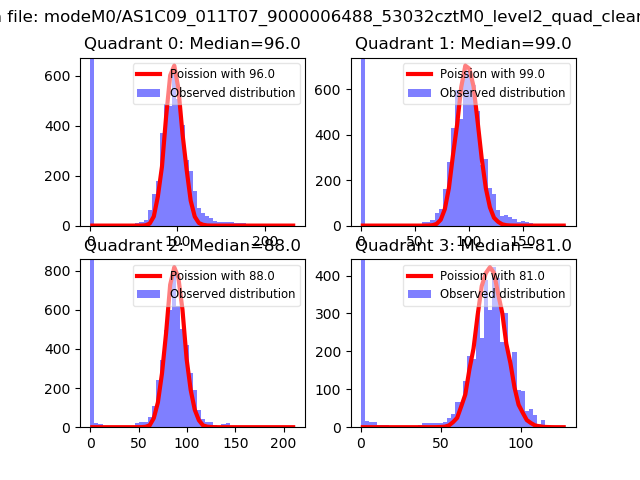 |
 |
| Quadrant-wise count rates Data is divided into 100 sec bins |
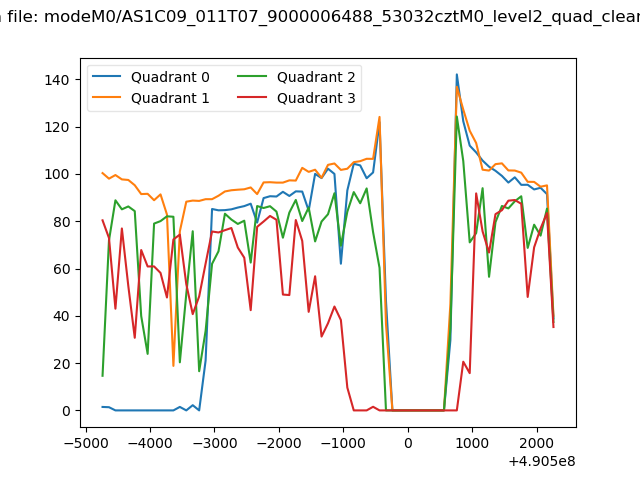 |
|
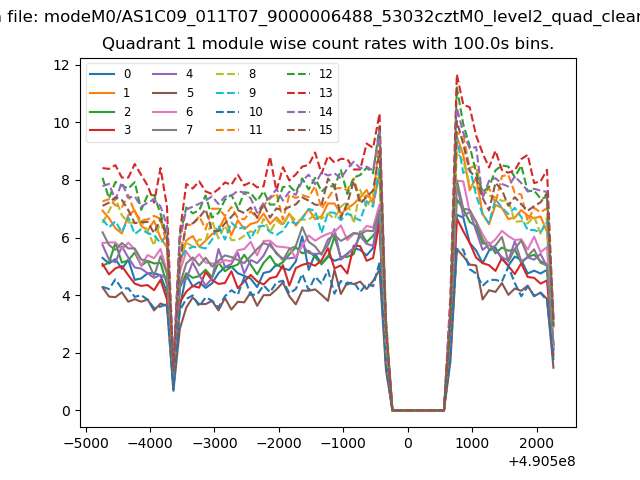
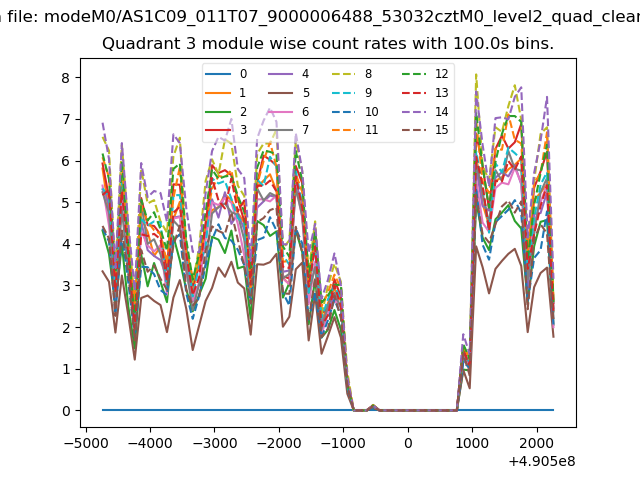
| Module-wise count rates for Quadrant A Data is divided into 100 sec bins |
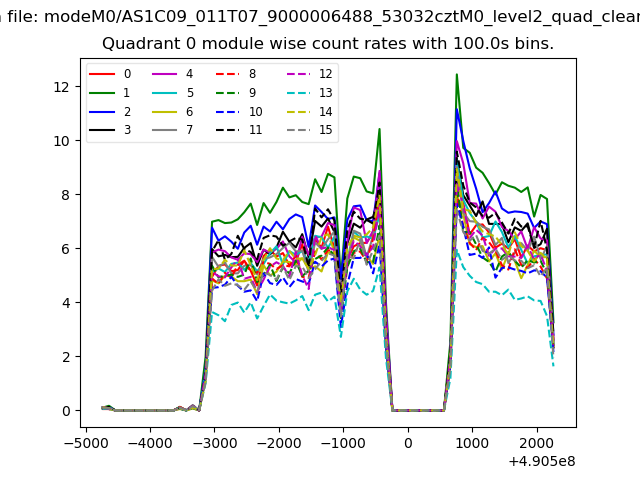 |
 |
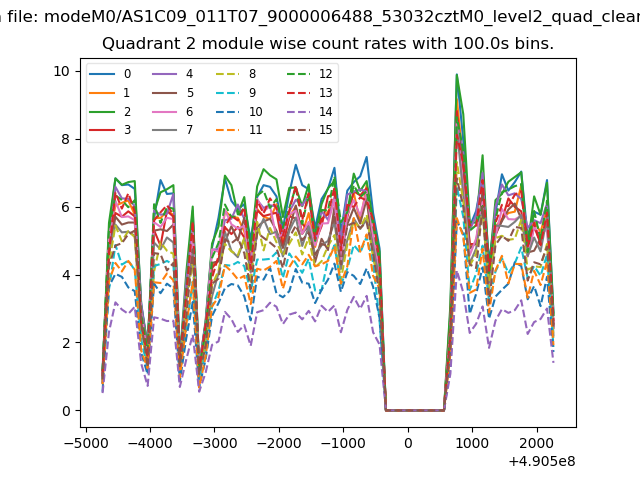
| Module-wise count rates for Quadrant B Data is divided into 100 sec bins |
 |
 |
| Module-wise count rates for Quadrant C Data is divided into 100 sec bins |
 |
 |
| Module-wise count rates for Quadrant D Data is divided into 100 sec bins |
 |
 |
| Parameter | Plot |
|---|---|
| CZT HV Monitor | 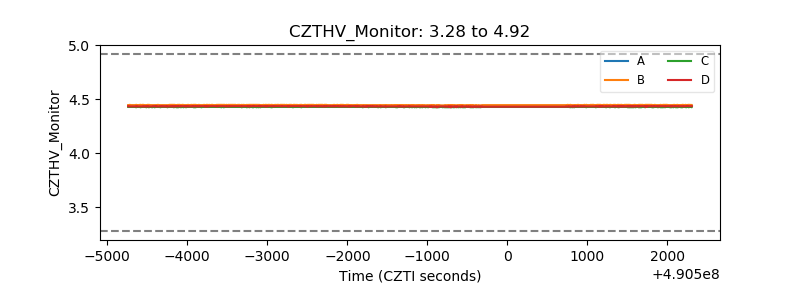 |
| D_VDD | 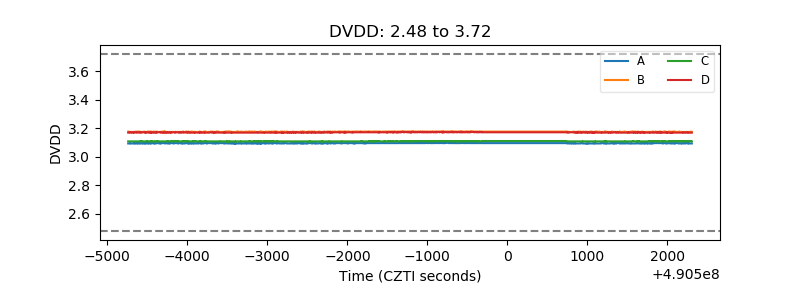 |
| Temperature 1 | 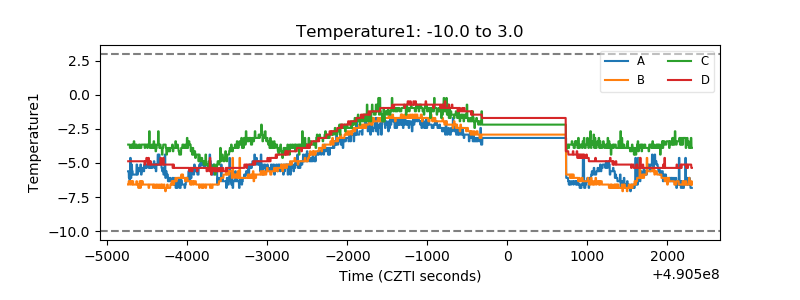 |
| Veto HV Monitor | 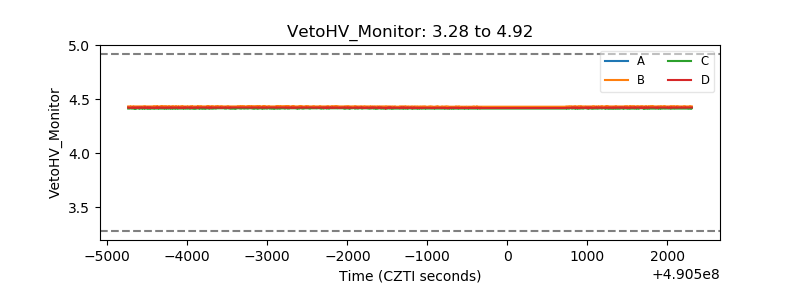 |
| Veto LLD | 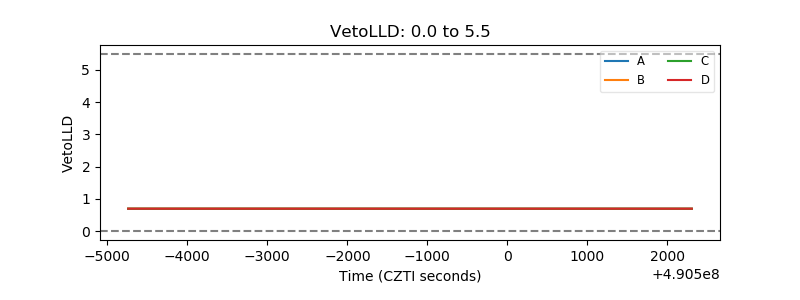 |
| Alpha Counter | 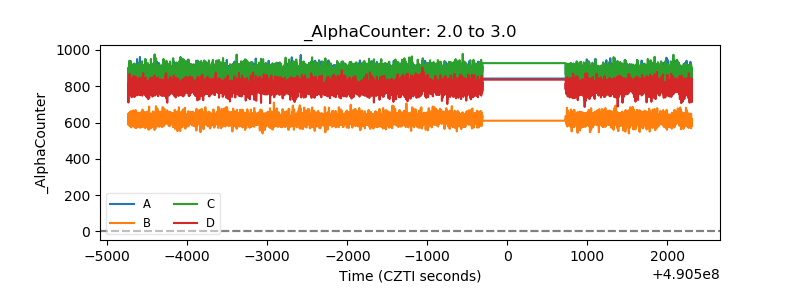 |
| _CPM_Rate | 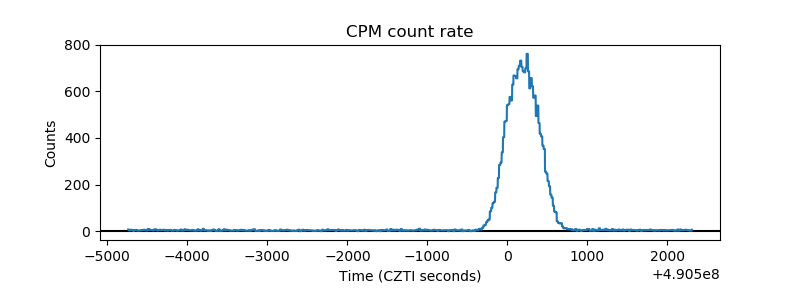 |
| CZT Counter | 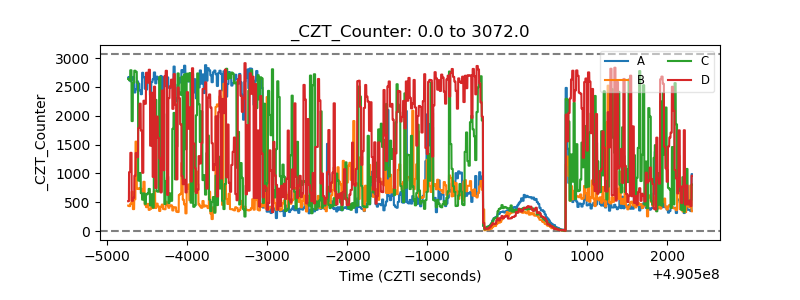 |
| +2.5 Volts monitor |  |
| +5 Volts monitor | 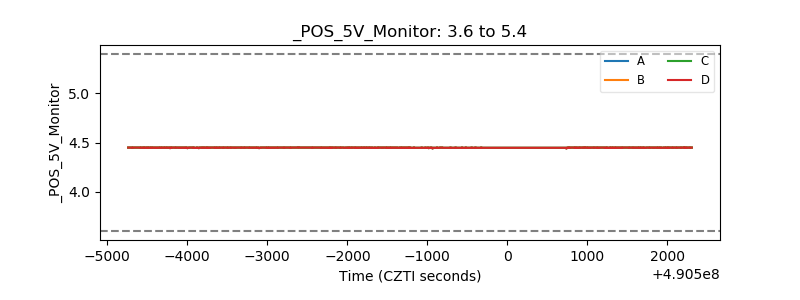 |
| _ROLL_ROT | 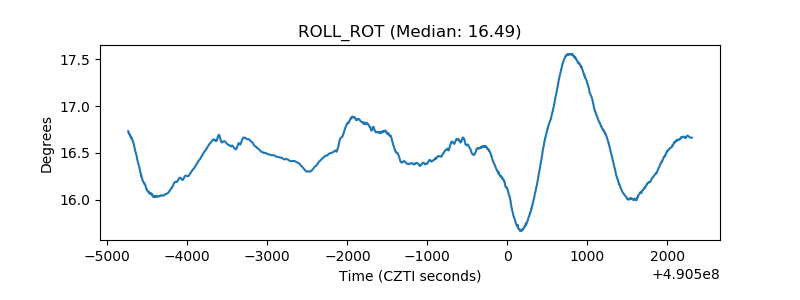 |
| _Roll_DEC | 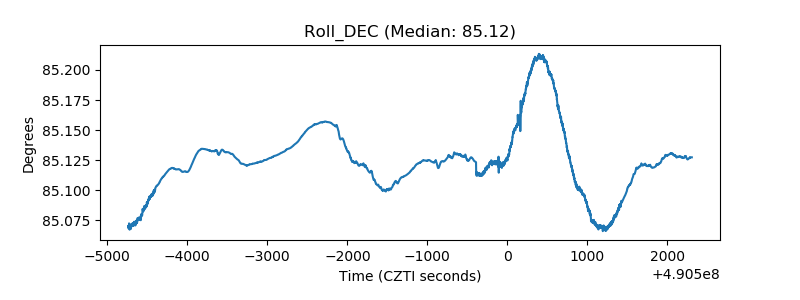 |
| _Roll_RA | 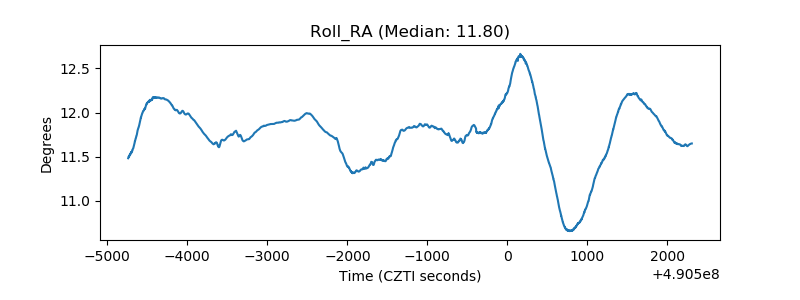 |
| Veto Counter | 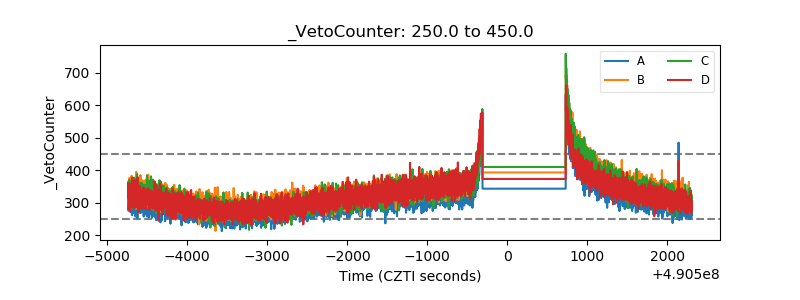 |