| Param | Original file | Final file |
|---|---|---|
| Filename | modeM0/AS1C09_011T07_9000006488_53033cztM0_level2.fits | modeM0/AS1C09_011T07_9000006488_53033cztM0_level2_quad_clean.evt |
| Size (bytes) | 681,456,960 | 82,474,560 |
| Size | 649.9 MB | 78.7 MB |
| Events in quadrant A | 6,098,993 | 532,941 |
| Events in quadrant B | 3,646,183 | 623,339 |
| Events in quadrant C | 6,032,993 | 526,294 |
| Events in quadrant D | 8,967,030 | 380,882 |
| Mode SS | |||
|---|---|---|---|
| Quadrant | BADHDUFLAG | Total packets | Discarded packets |
| A | 0 | 128 | 0 |
| B | 0 | 128 | 0 |
| C | 0 | 128 | 0 |
| D | 0 | 128 | 0 |
| Mode M9 | |||
|---|---|---|---|
| Quadrant | BADHDUFLAG | Total packets | Discarded packets |
| A | 0 | 11 | 0 |
| B | 0 | 11 | 0 |
| C | 0 | 11 | 0 |
| D | 0 | 11 | 0 |
| Mode M0 | |||
|---|---|---|---|
| Quadrant | BADHDUFLAG | Total packets | Discarded packets |
| A | 0 | 22612 | 1 |
| B | 0 | 15101 | 1 |
| C | 0 | 22294 | 1 |
| D | 0 | 30971 | 1 |
| Quadrant | Total seconds | Saturated seconds | Saturation percentage |
|---|---|---|---|
| A | 6202 | 845 | 13.624637% |
| B | 6203 | 213 | 3.433822% |
| C | 6203 | 671 | 10.817346% |
| D | 6203 | 2031 | 32.742222% |
Noise dominated data is calculated using 1-second bins in cleaned event files. If a bin has >2000 counts, and if more than 50% of those come from <1% of pixels, then it is considered to be noise-dominated and hence unusable.
| Quadrant | # 1 sec bins | Bins with >0 counts | Bins with >2000 counts | High rate bins dominated by noise | Noise dominated (total time) | Noise dominated (detector-on time) | Marked lightcurve |
|---|---|---|---|---|---|---|---|
| A | 7322 | 6203 | 778 | 778 | 10.63% | 12.54% | 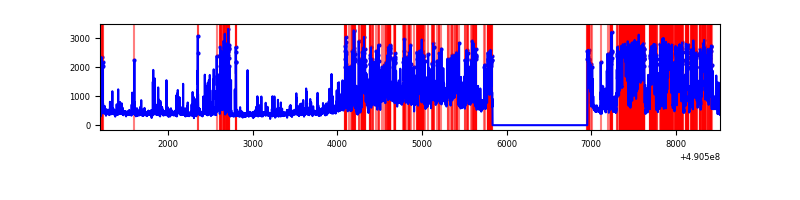 |
| B | 7323 | 6203 | 132 | 132 | 1.80% | 2.13% | 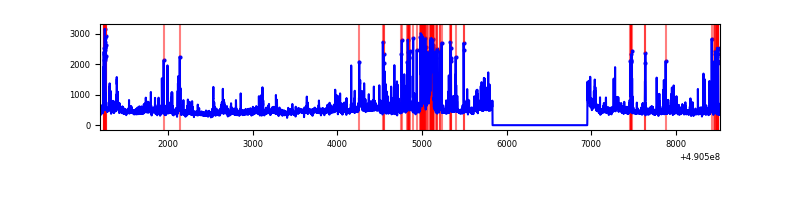 |
| C | 7323 | 6204 | 681 | 681 | 9.30% | 10.98% | 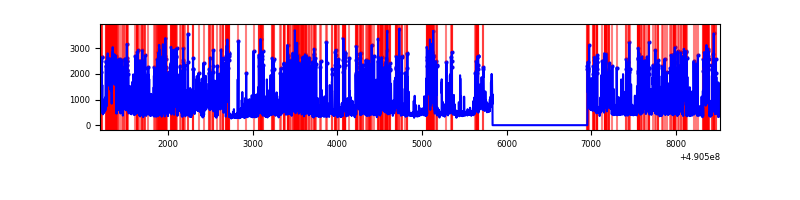 |
| D | 7323 | 6203 | 2057 | 2057 | 28.09% | 33.16% | 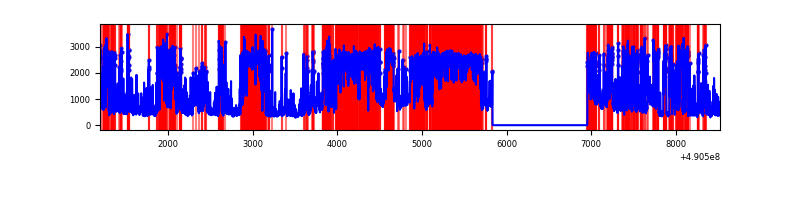 |
Top three noisy pixels from each quadrant. If the there are fewer than three noisy pixels in the level2.evt file, extra rows are filled as -1
| Pixel properties | Quadrant properties | ||||||
|---|---|---|---|---|---|---|---|
| Quadrant | DetID | PixID | Counts | Sigma | Mean | Median | Sigma |
| A | 9 | 191 | 1420035 | 9360.44 | 602 | 588 | 151.6 |
| A | 7 | 206 | 1016524 | 6699.52 | 602 | 588 | 151.6 |
| A | 15 | 190 | 441599 | 2908.22 | 602 | 588 | 151.6 |
| B | 10 | 63 | 177929 | 1331.77 | 623 | 603 | 133.2 |
| B | 2 | 249 | 175586 | 1314.17 | 623 | 603 | 133.2 |
| B | 4 | 81 | 137728 | 1029.85 | 623 | 603 | 133.2 |
| C | 15 | 224 | 1968512 | 12098.26 | 589 | 586 | 162.7 |
| C | 7 | 80 | 790219 | 4854.45 | 589 | 586 | 162.7 |
| C | 1 | 241 | 348802 | 2140.74 | 589 | 586 | 162.7 |
| D | 2 | 153 | 3004222 | 20564.39 | 505 | 481 | 146.1 |
| D | 12 | 17 | 1947575 | 13330.31 | 505 | 481 | 146.1 |
| D | 8 | 176 | 992961 | 6794.77 | 505 | 481 | 146.1 |
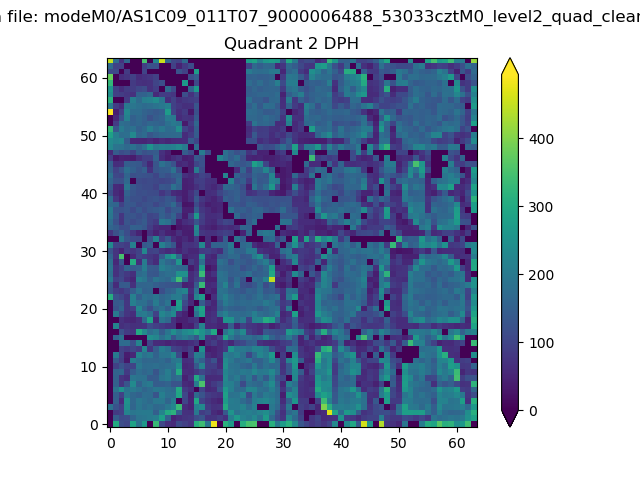
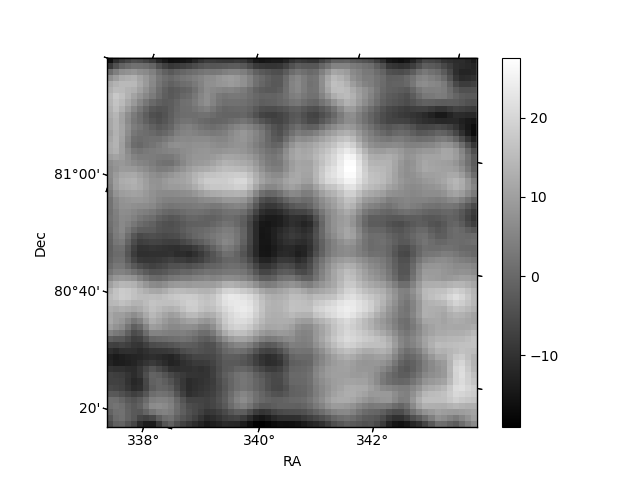
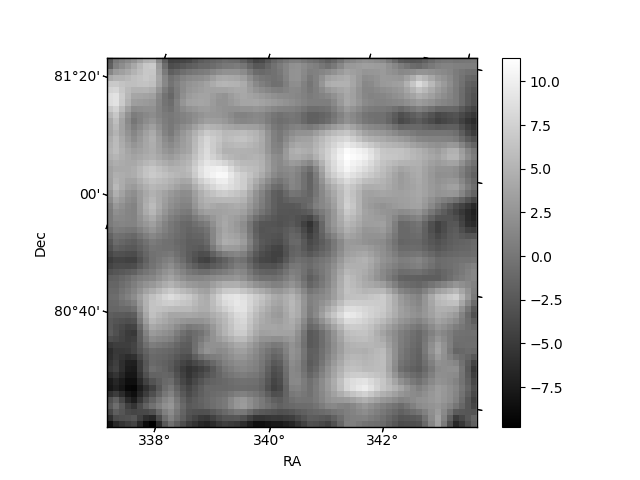
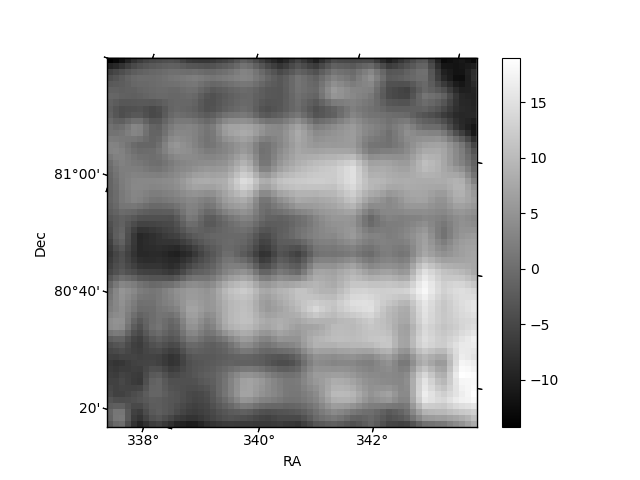
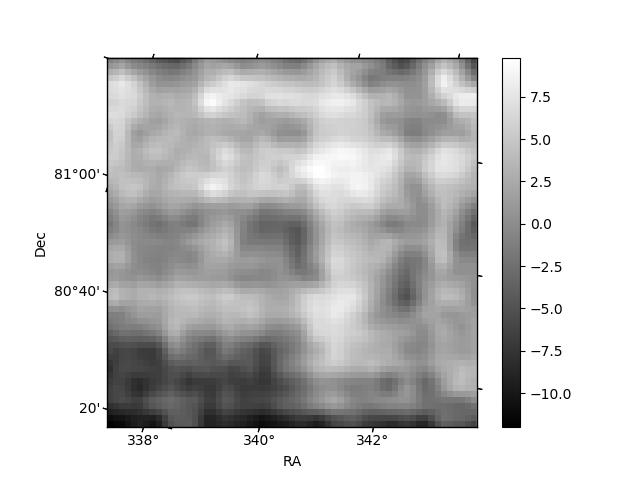
Histogram calculated using DETX and DETY for each event in the final _common_clean file
| Quadrant A | 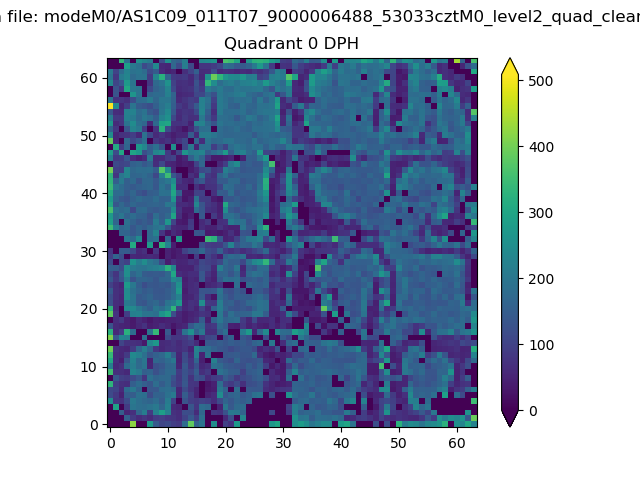 |
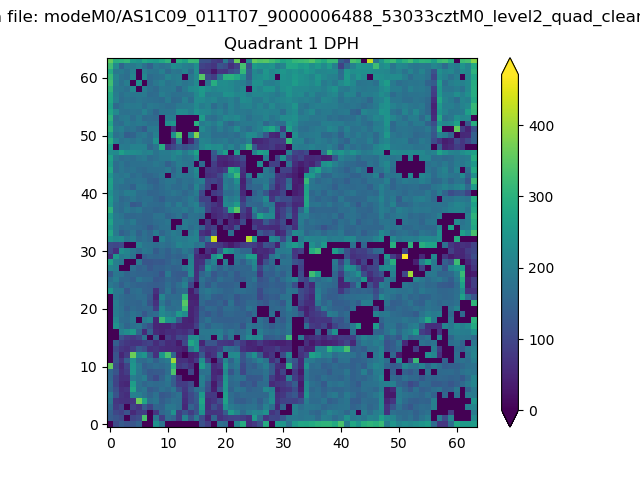 |
Quadrant B |
|---|---|---|---|
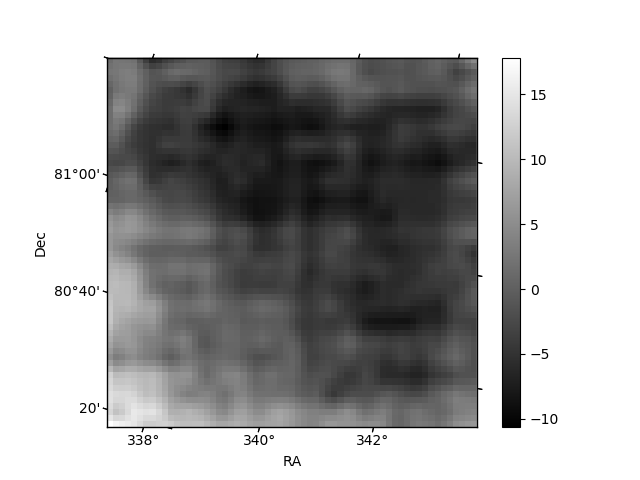
| Quadrant D | 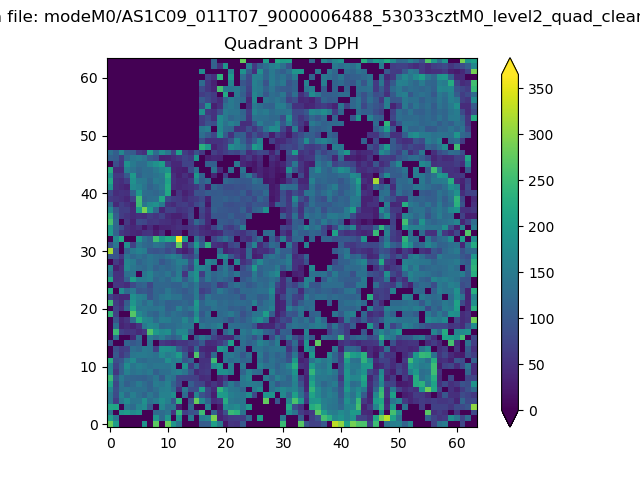 |
 |
Quadrant C |
| Plot type | Count rate plots | Images |
|---|---|---|
| Comparison with Poisson distribution Blue bars denote a histogram of data divided into 1 sec bins. Red curve is a Poisson curve with rate = median count rate of data. |
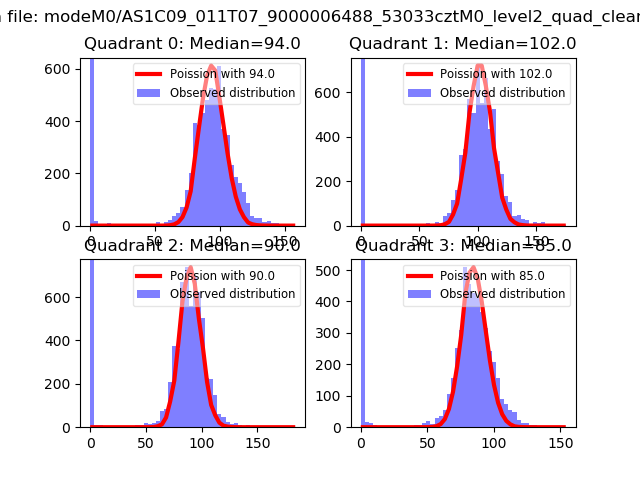 |
 |
| Quadrant-wise count rates Data is divided into 100 sec bins |
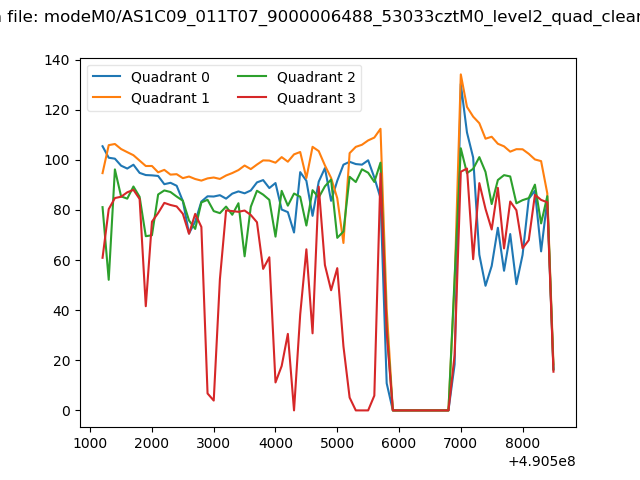 |
|
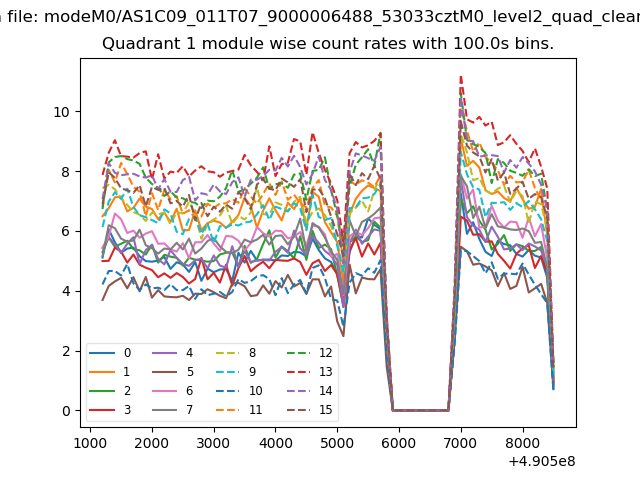
| Module-wise count rates for Quadrant A Data is divided into 100 sec bins |
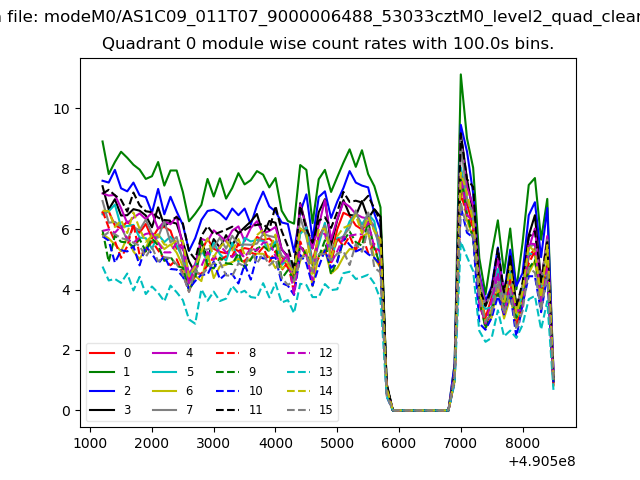 |
 |
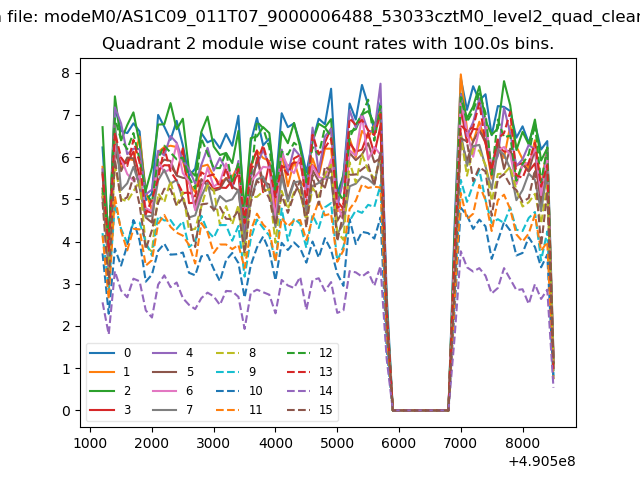
| Module-wise count rates for Quadrant B Data is divided into 100 sec bins |
 |
 |
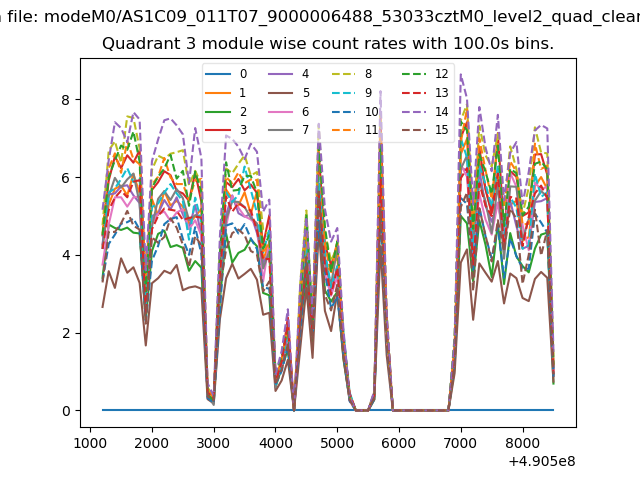
| Module-wise count rates for Quadrant C Data is divided into 100 sec bins |
 |
 |
| Module-wise count rates for Quadrant D Data is divided into 100 sec bins |
 |
 |
| Parameter | Plot |
|---|---|
| CZT HV Monitor | 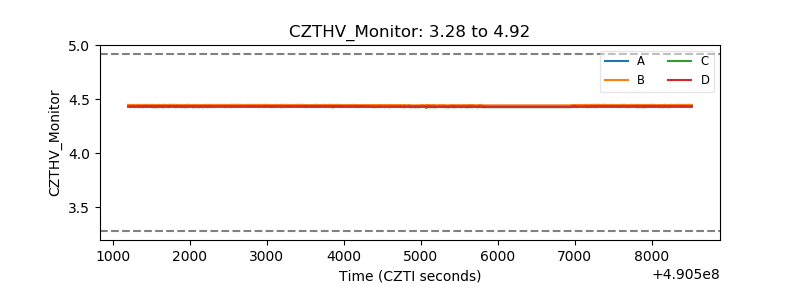 |
| D_VDD | 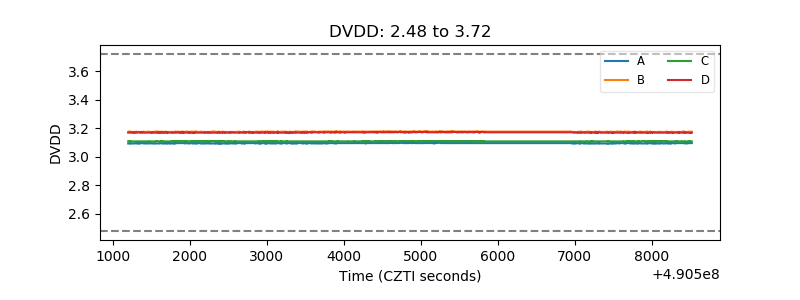 |
| Temperature 1 | 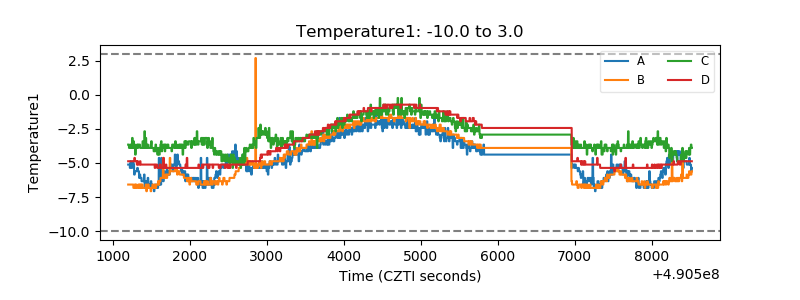 |
| Veto HV Monitor | 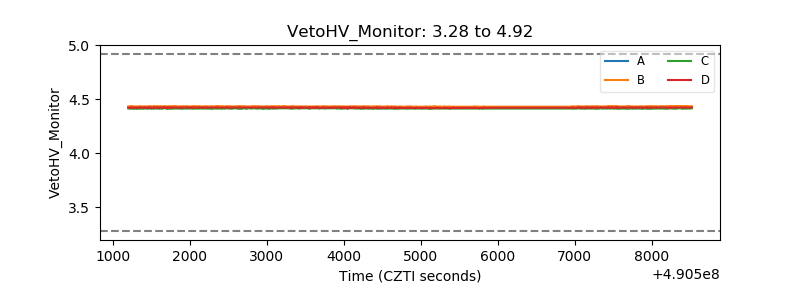 |
| Veto LLD | 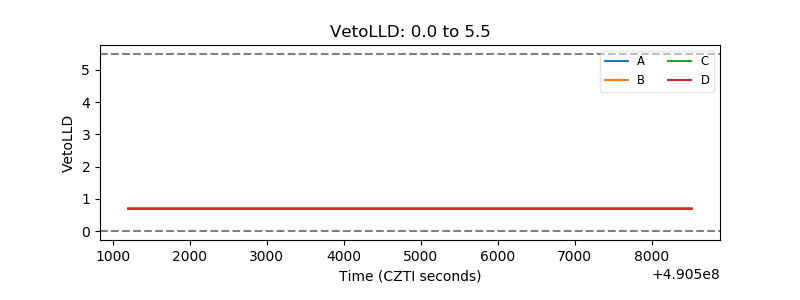 |
| Alpha Counter | 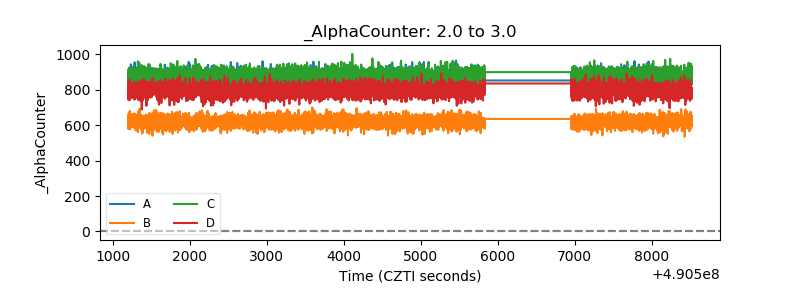 |
| _CPM_Rate | 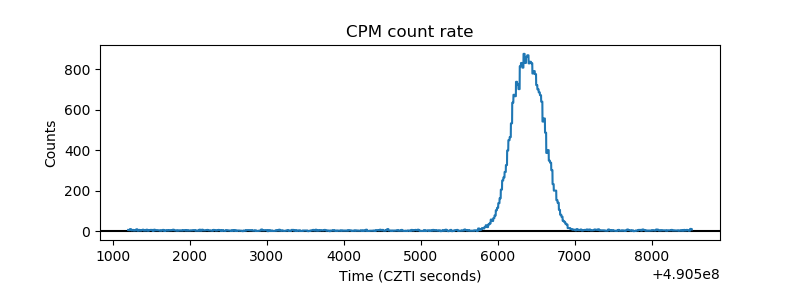 |
| CZT Counter | 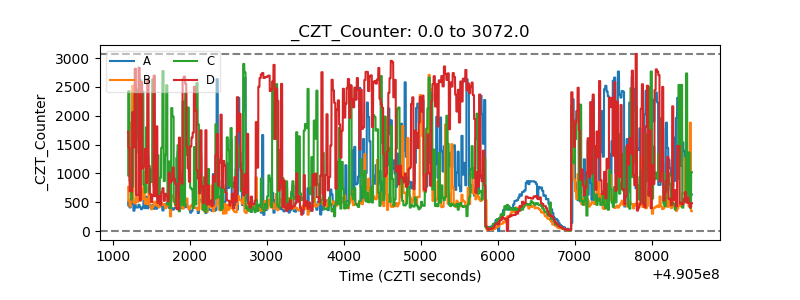 |
| +2.5 Volts monitor |  |
| +5 Volts monitor |  |
| _ROLL_ROT | 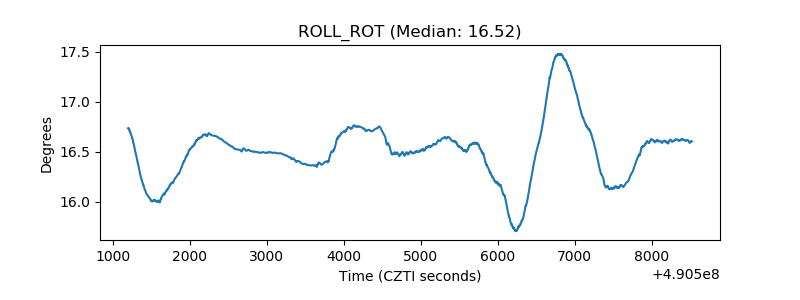 |
| _Roll_DEC | 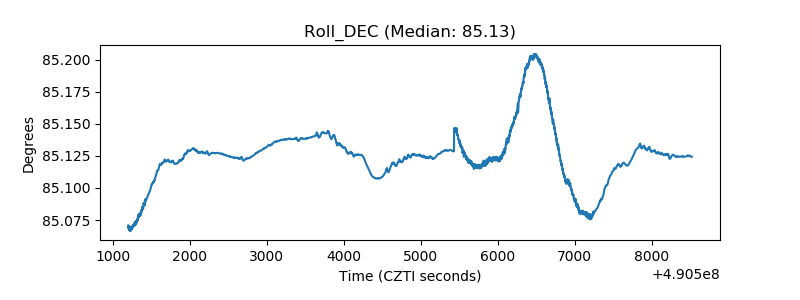 |
| _Roll_RA | 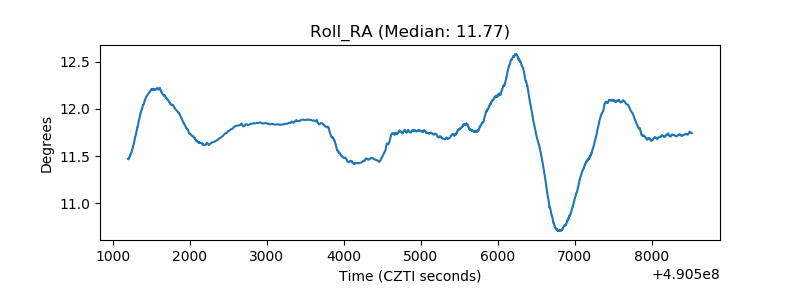 |
| Veto Counter | 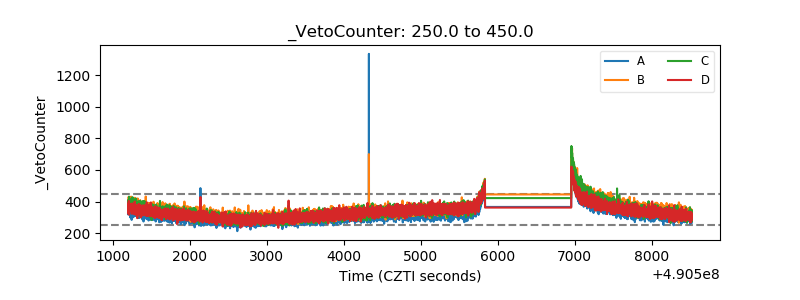 |