| Param | Original file | Final file |
|---|---|---|
| Filename | modeM0/AS1C09_011T07_9000006488_53034cztM0_level2.fits | modeM0/AS1C09_011T07_9000006488_53034cztM0_level2_quad_clean.evt |
| Size (bytes) | 676,823,040 | 77,541,120 |
| Size | 645.5 MB | 73.9 MB |
| Events in quadrant A | 7,568,956 | 453,684 |
| Events in quadrant B | 3,011,925 | 601,575 |
| Events in quadrant C | 5,532,258 | 504,523 |
| Events in quadrant D | 8,491,130 | 381,362 |
| Mode SS | |||
|---|---|---|---|
| Quadrant | BADHDUFLAG | Total packets | Discarded packets |
| A | 0 | 118 | 0 |
| B | 0 | 118 | 0 |
| C | 0 | 118 | 0 |
| D | 0 | 118 | 0 |
| Mode M9 | |||
|---|---|---|---|
| Quadrant | BADHDUFLAG | Total packets | Discarded packets |
| A | 0 | 12 | 0 |
| B | 0 | 12 | 0 |
| C | 0 | 12 | 0 |
| D | 0 | 12 | 0 |
| Mode M0 | |||
|---|---|---|---|
| Quadrant | BADHDUFLAG | Total packets | Discarded packets |
| A | 0 | 26566 | 1 |
| B | 0 | 13034 | 1 |
| C | 0 | 20531 | 1 |
| D | 0 | 29278 | 1 |
| Quadrant | Total seconds | Saturated seconds | Saturation percentage |
|---|---|---|---|
| A | 5814 | 1396 | 24.011008% |
| B | 5815 | 87 | 1.496131% |
| C | 5815 | 505 | 8.684437% |
| D | 5815 | 1702 | 29.269132% |
Noise dominated data is calculated using 1-second bins in cleaned event files. If a bin has >2000 counts, and if more than 50% of those come from <1% of pixels, then it is considered to be noise-dominated and hence unusable.
| Quadrant | # 1 sec bins | Bins with >0 counts | Bins with >2000 counts | High rate bins dominated by noise | Noise dominated (total time) | Noise dominated (detector-on time) | Marked lightcurve |
|---|---|---|---|---|---|---|---|
| A | 6989 | 5814 | 1297 | 1297 | 18.56% | 22.31% | 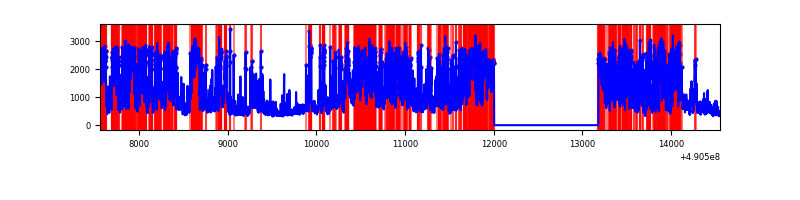 |
| B | 6990 | 5815 | 49 | 49 | 0.70% | 0.84% | 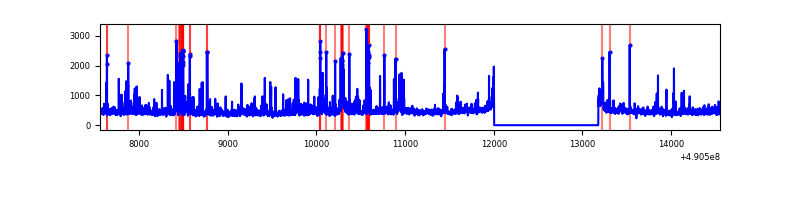 |
| C | 6990 | 5815 | 478 | 478 | 6.84% | 8.22% | 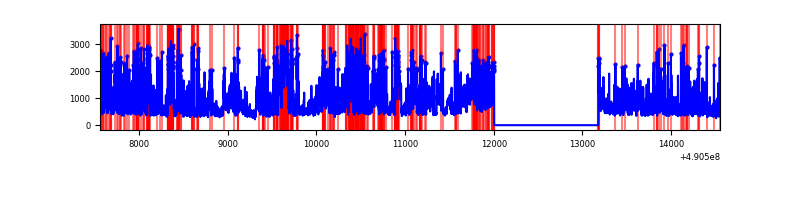 |
| D | 6990 | 5815 | 1815 | 1815 | 25.97% | 31.21% | 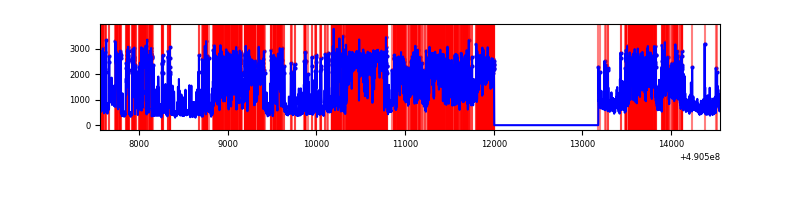 |
Top three noisy pixels from each quadrant. If the there are fewer than three noisy pixels in the level2.evt file, extra rows are filled as -1
| Pixel properties | Quadrant properties | ||||||
|---|---|---|---|---|---|---|---|
| Quadrant | DetID | PixID | Counts | Sigma | Mean | Median | Sigma |
| A | 9 | 191 | 2513218 | 18567.82 | 543 | 532 | 135.3 |
| A | 7 | 206 | 1980411 | 14630.57 | 543 | 532 | 135.3 |
| A | 3 | 62 | 610623 | 4508.35 | 543 | 532 | 135.3 |
| B | 10 | 63 | 139521 | 1118.96 | 593 | 575 | 124.2 |
| B | 10 | 44 | 78201 | 625.14 | 593 | 575 | 124.2 |
| B | 0 | 213 | 78122 | 624.5 | 593 | 575 | 124.2 |
| C | 15 | 224 | 1446760 | 9355.31 | 560 | 555 | 154.6 |
| C | 7 | 80 | 1232944 | 7972.17 | 560 | 555 | 154.6 |
| C | 1 | 241 | 246496 | 1590.96 | 560 | 555 | 154.6 |
| D | 8 | 176 | 2098091 | 14188.66 | 506 | 481 | 147.8 |
| D | 2 | 153 | 2047763 | 13848.23 | 506 | 481 | 147.8 |
| D | 2 | 172 | 942989 | 6375.31 | 506 | 481 | 147.8 |
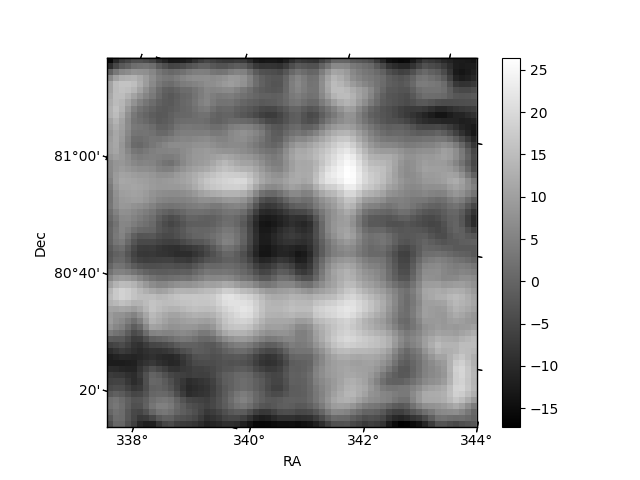
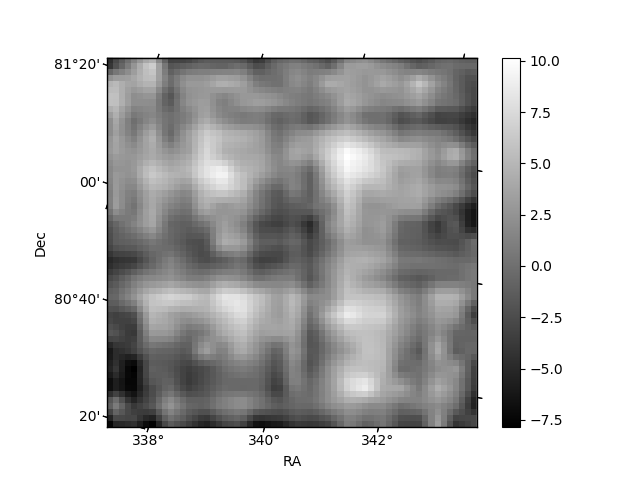
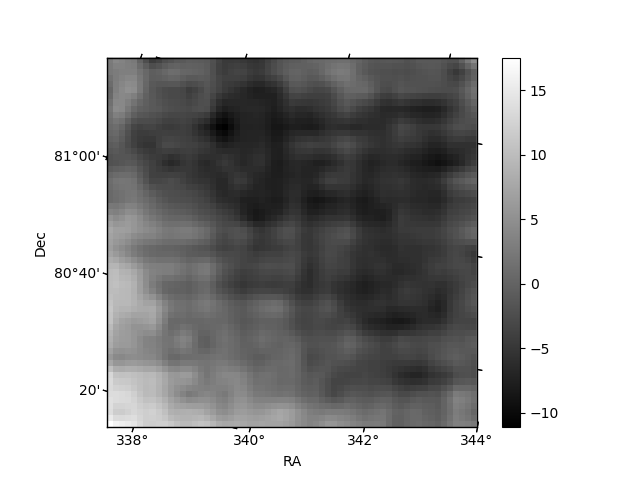
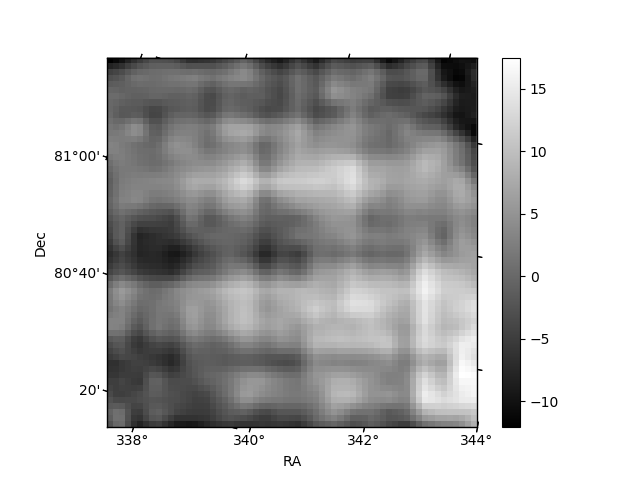
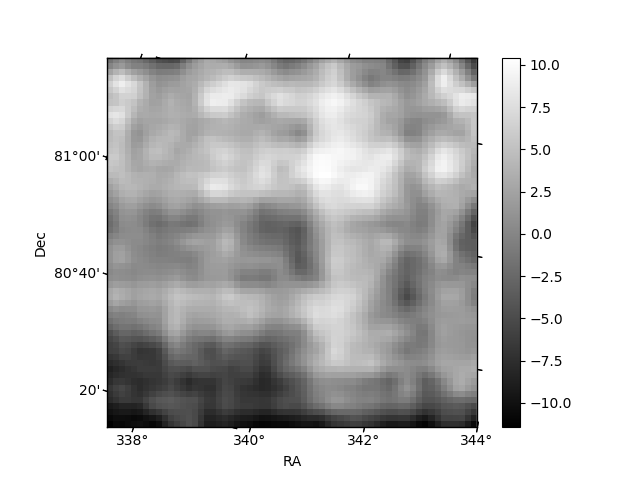
Histogram calculated using DETX and DETY for each event in the final _common_clean file
| Quadrant A | 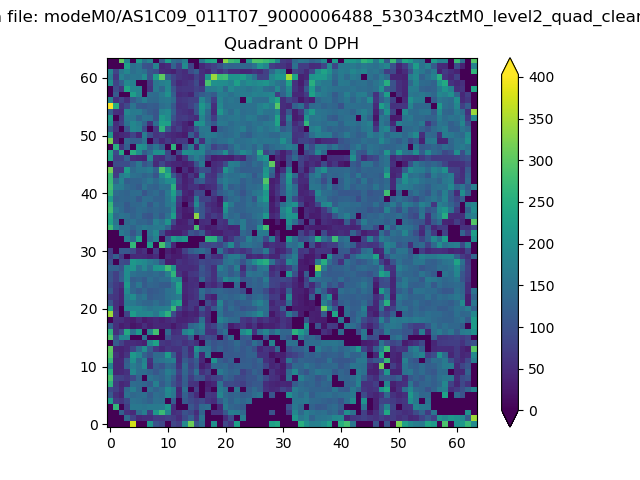 |
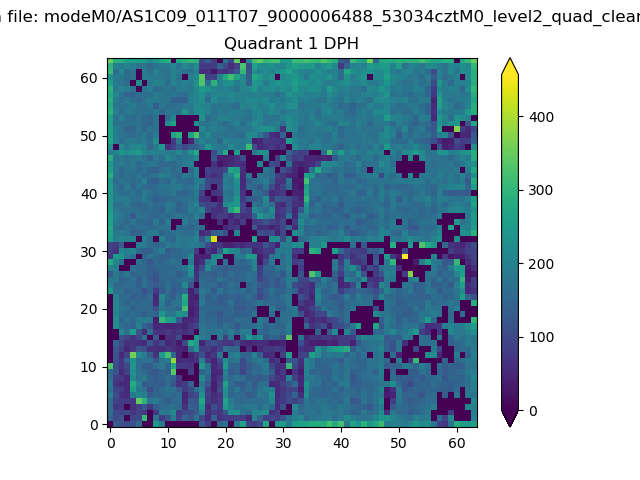 |
Quadrant B |
|---|---|---|---|
| Quadrant D | 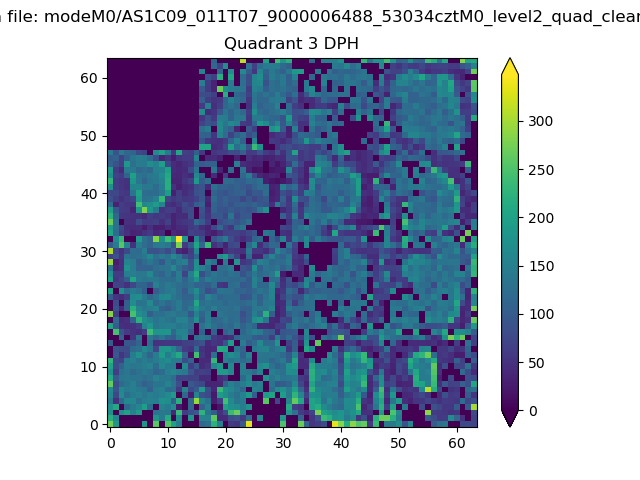 |
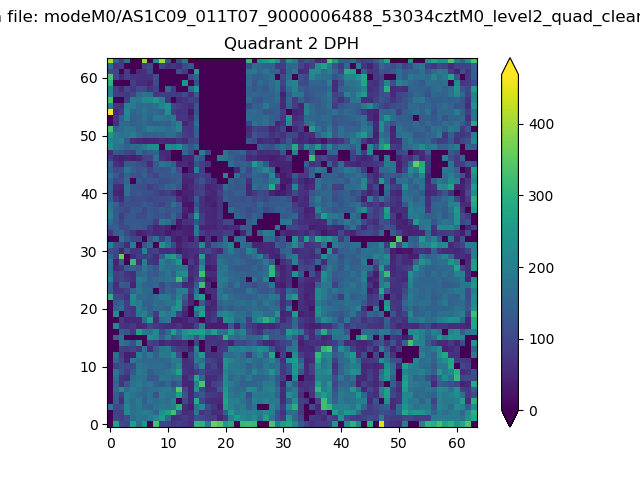 |
Quadrant C |
| Plot type | Count rate plots | Images |
|---|---|---|
| Comparison with Poisson distribution Blue bars denote a histogram of data divided into 1 sec bins. Red curve is a Poisson curve with rate = median count rate of data. |
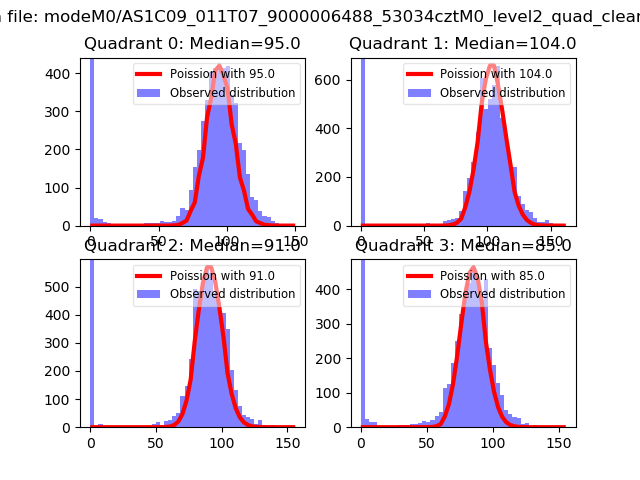 |
 |
| Quadrant-wise count rates Data is divided into 100 sec bins |
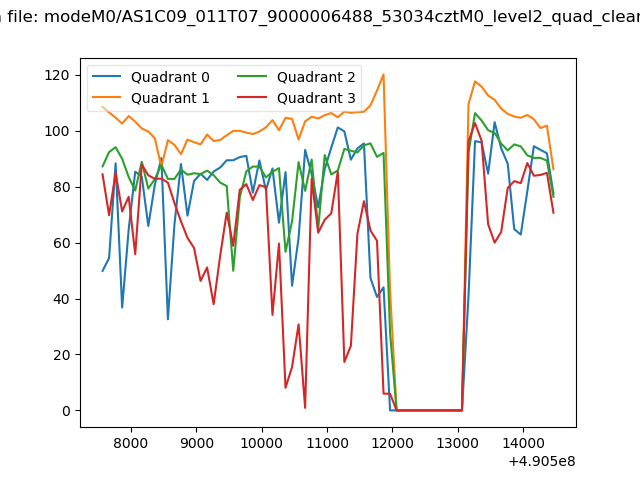 |
|
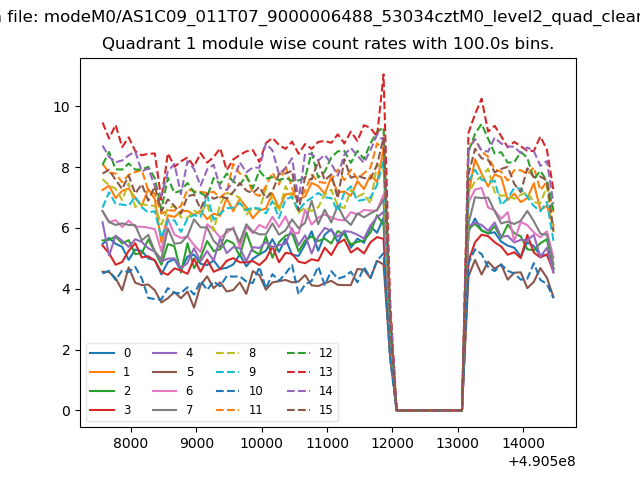
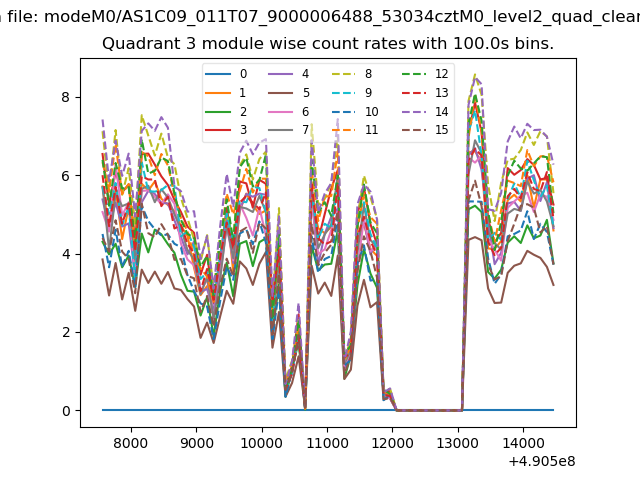
| Module-wise count rates for Quadrant A Data is divided into 100 sec bins |
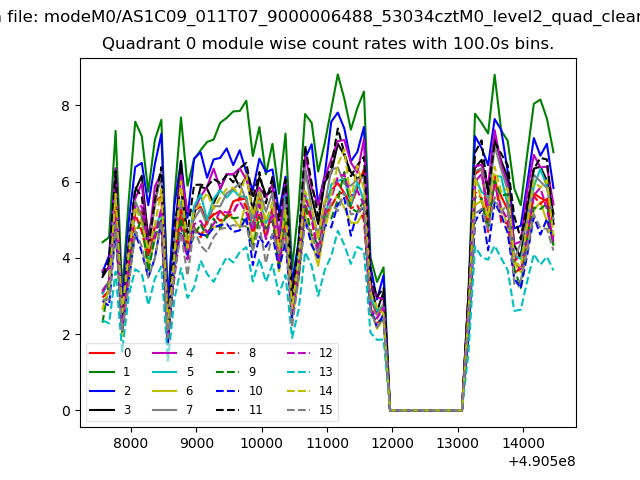 |
 |
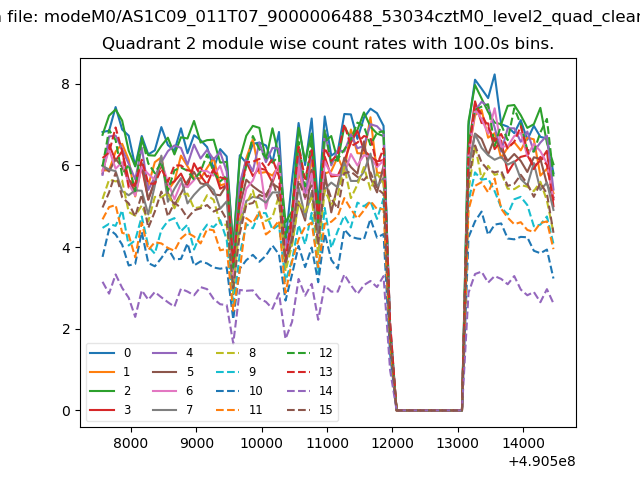
| Module-wise count rates for Quadrant B Data is divided into 100 sec bins |
 |
 |
| Module-wise count rates for Quadrant C Data is divided into 100 sec bins |
 |
 |
| Module-wise count rates for Quadrant D Data is divided into 100 sec bins |
 |
 |
| Parameter | Plot |
|---|---|
| CZT HV Monitor | 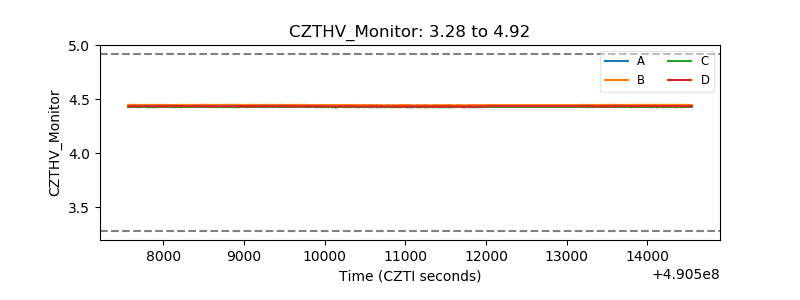 |
| D_VDD | 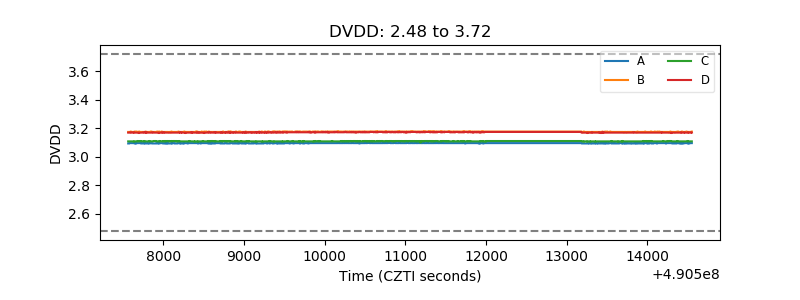 |
| Temperature 1 | 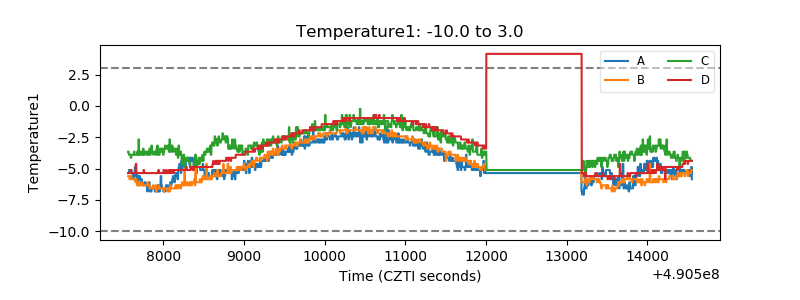 |
| Veto HV Monitor |  |
| Veto LLD | 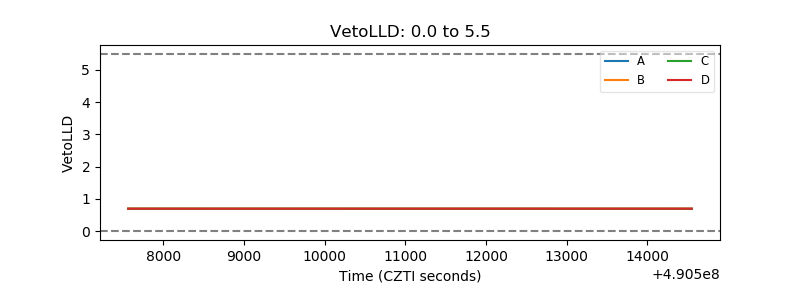 |
| Alpha Counter | 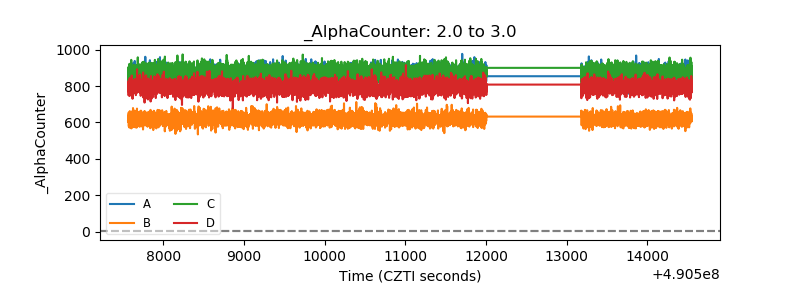 |
| _CPM_Rate | 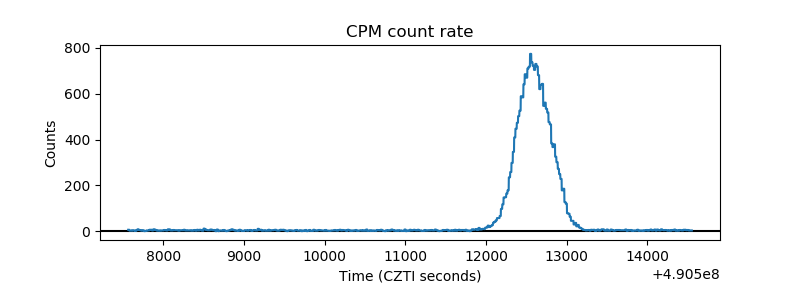 |
| CZT Counter | 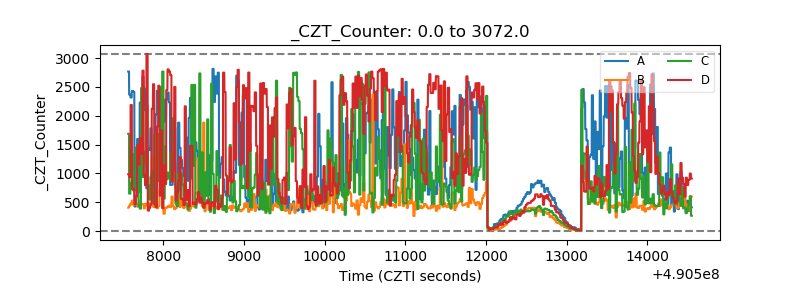 |
| +2.5 Volts monitor | 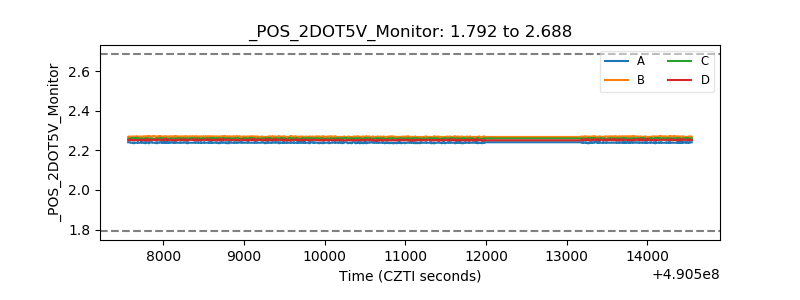 |
| +5 Volts monitor |  |
| _ROLL_ROT | 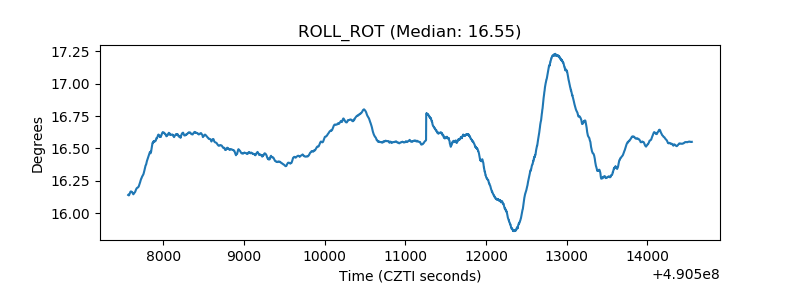 |
| _Roll_DEC | 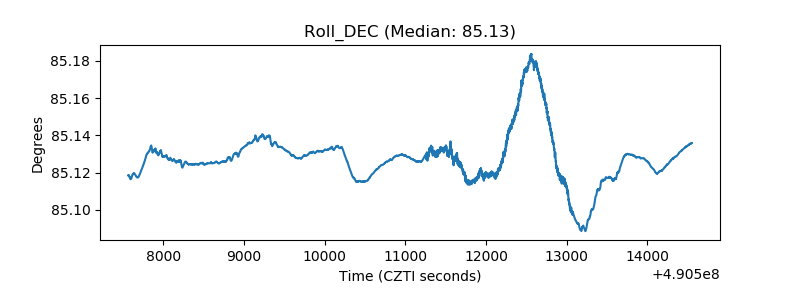 |
| _Roll_RA | 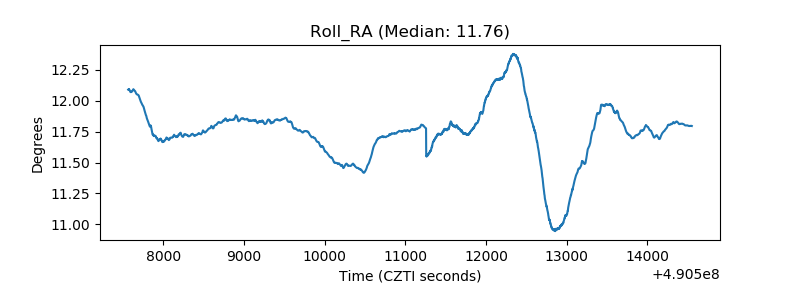 |
| Veto Counter | 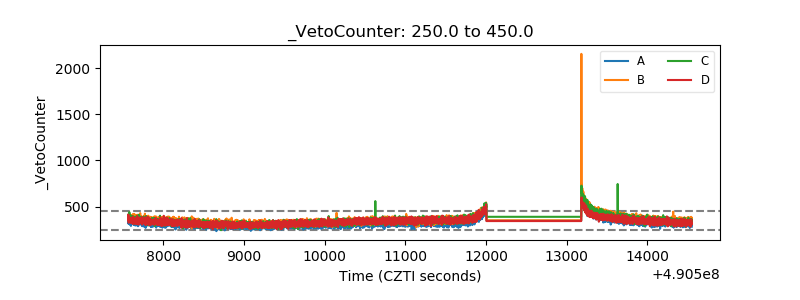 |