| Param | Original file | Final file |
|---|---|---|
| Filename | modeM0/AS1C09_011T07_9000006488_53035cztM0_level2.fits | modeM0/AS1C09_011T07_9000006488_53035cztM0_level2_quad_clean.evt |
| Size (bytes) | 762,428,160 | 77,022,720 |
| Size | 727.1 MB | 73.5 MB |
| Events in quadrant A | 7,259,826 | 511,301 |
| Events in quadrant B | 3,014,308 | 625,086 |
| Events in quadrant C | 7,410,793 | 423,148 |
| Events in quadrant D | 10,061,877 | 342,747 |
| Mode SS | |||
|---|---|---|---|
| Quadrant | BADHDUFLAG | Total packets | Discarded packets |
| A | 0 | 126 | 0 |
| B | 0 | 126 | 0 |
| C | 0 | 126 | 0 |
| D | 0 | 126 | 0 |
| Mode M9 | |||
|---|---|---|---|
| Quadrant | BADHDUFLAG | Total packets | Discarded packets |
| A | 0 | 11 | 0 |
| B | 0 | 11 | 0 |
| C | 0 | 11 | 0 |
| D | 0 | 11 | 0 |
| Mode M0 | |||
|---|---|---|---|
| Quadrant | BADHDUFLAG | Total packets | Discarded packets |
| A | 0 | 25880 | 3 |
| B | 0 | 13460 | 1 |
| C | 0 | 26327 | 1 |
| D | 0 | 34222 | 1 |
| Quadrant | Total seconds | Saturated seconds | Saturation percentage |
|---|---|---|---|
| A | 6151 | 1175 | 19.102585% |
| B | 6151 | 155 | 2.519915% |
| C | 6152 | 1682 | 27.340702% |
| D | 6152 | 2382 | 38.719116% |
Noise dominated data is calculated using 1-second bins in cleaned event files. If a bin has >2000 counts, and if more than 50% of those come from <1% of pixels, then it is considered to be noise-dominated and hence unusable.
| Quadrant | # 1 sec bins | Bins with >0 counts | Bins with >2000 counts | High rate bins dominated by noise | Noise dominated (total time) | Noise dominated (detector-on time) | Marked lightcurve |
|---|---|---|---|---|---|---|---|
| A | 7301 | 6152 | 1094 | 1094 | 14.98% | 17.78% | 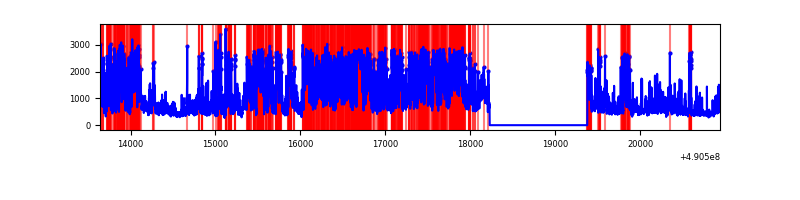 |
| B | 7301 | 6152 | 70 | 70 | 0.96% | 1.14% | 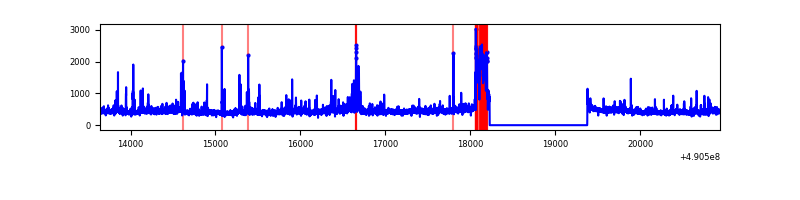 |
| C | 7302 | 6153 | 1628 | 1628 | 22.30% | 26.46% | 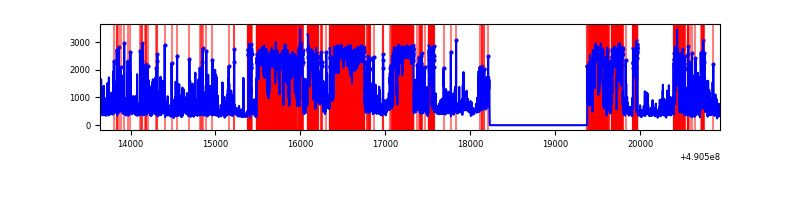 |
| D | 7302 | 6152 | 2442 | 2442 | 33.44% | 39.69% | 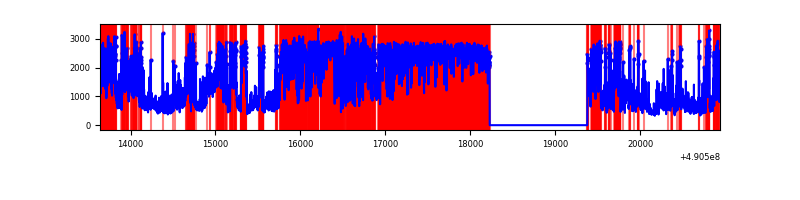 |
Top three noisy pixels from each quadrant. If the there are fewer than three noisy pixels in the level2.evt file, extra rows are filled as -1
| Pixel properties | Quadrant properties | ||||||
|---|---|---|---|---|---|---|---|
| Quadrant | DetID | PixID | Counts | Sigma | Mean | Median | Sigma |
| A | 9 | 191 | 3326955 | 22361.73 | 595 | 580 | 148.8 |
| A | 7 | 206 | 1229014 | 8258.21 | 595 | 580 | 148.8 |
| A | 0 | 8 | 121578 | 813.42 | 595 | 580 | 148.8 |
| B | 10 | 44 | 215813 | 1636.64 | 623 | 602 | 131.5 |
| B | 0 | 213 | 54408 | 409.18 | 623 | 602 | 131.5 |
| B | 10 | 247 | 53617 | 403.17 | 623 | 602 | 131.5 |
| C | 1 | 241 | 3478977 | 23502.54 | 535 | 529 | 148.0 |
| C | 15 | 224 | 1123500 | 7587.49 | 535 | 529 | 148.0 |
| C | 7 | 80 | 168206 | 1132.93 | 535 | 529 | 148.0 |
| D | 8 | 176 | 2157269 | 15248.79 | 487 | 464 | 141.4 |
| D | 2 | 172 | 2083773 | 14729.17 | 487 | 464 | 141.4 |
| D | 2 | 153 | 1261233 | 8913.74 | 487 | 464 | 141.4 |
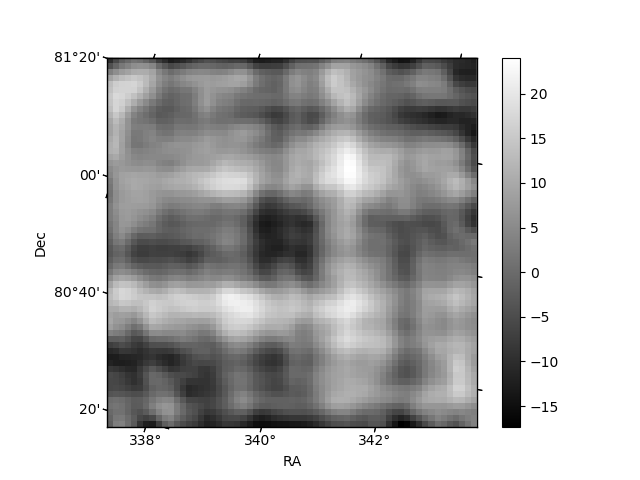
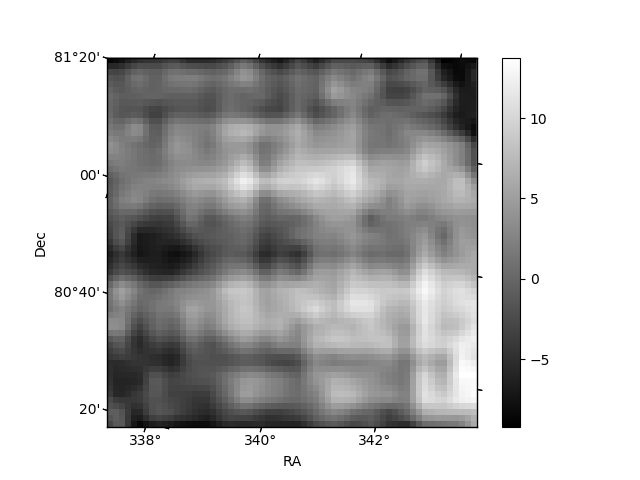
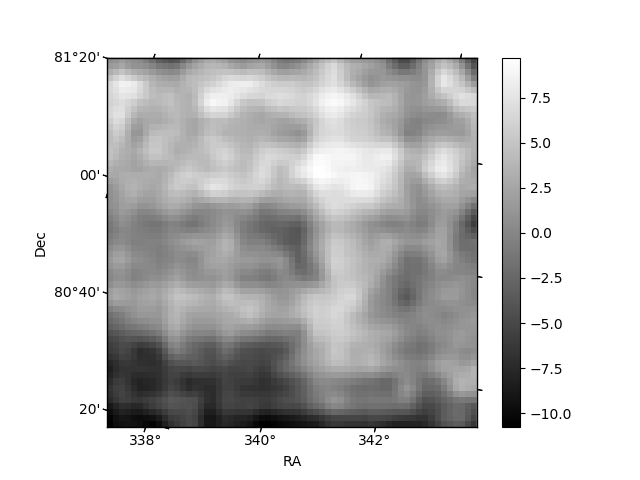
Histogram calculated using DETX and DETY for each event in the final _common_clean file
| Quadrant A | 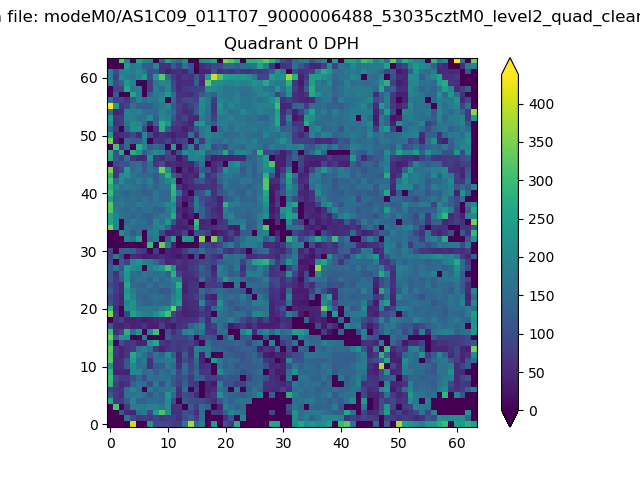 |
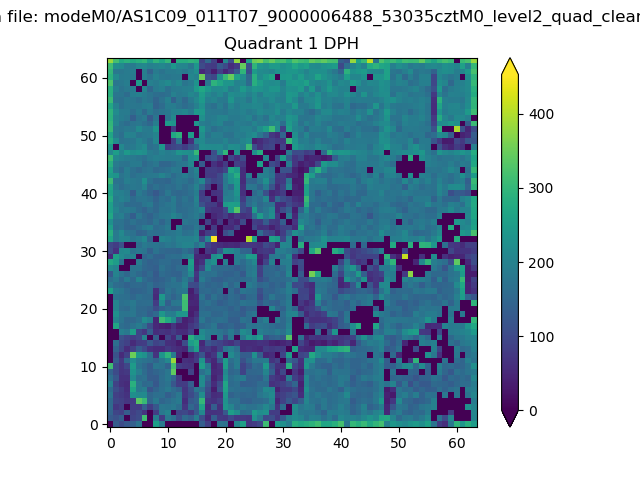 |
Quadrant B |
|---|---|---|---|
| Quadrant D | 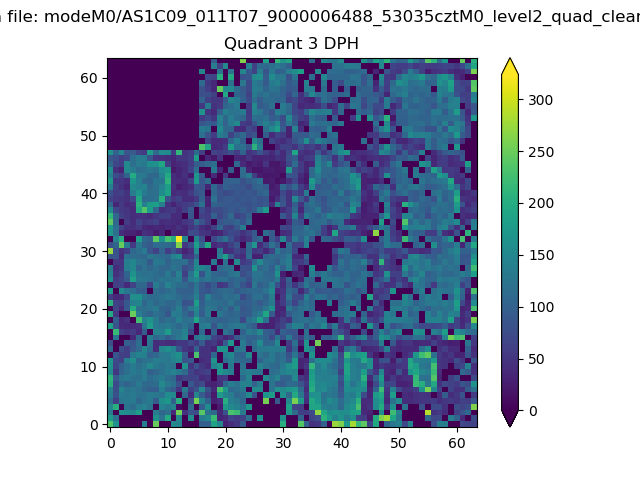 |
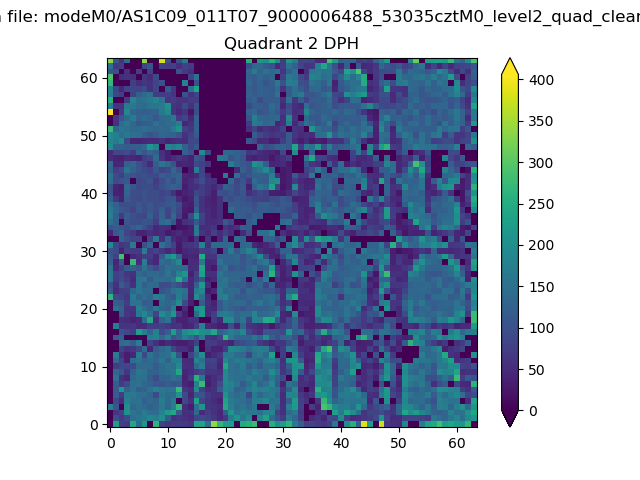 |
Quadrant C |
| Plot type | Count rate plots | Images |
|---|---|---|
| Comparison with Poisson distribution Blue bars denote a histogram of data divided into 1 sec bins. Red curve is a Poisson curve with rate = median count rate of data. |
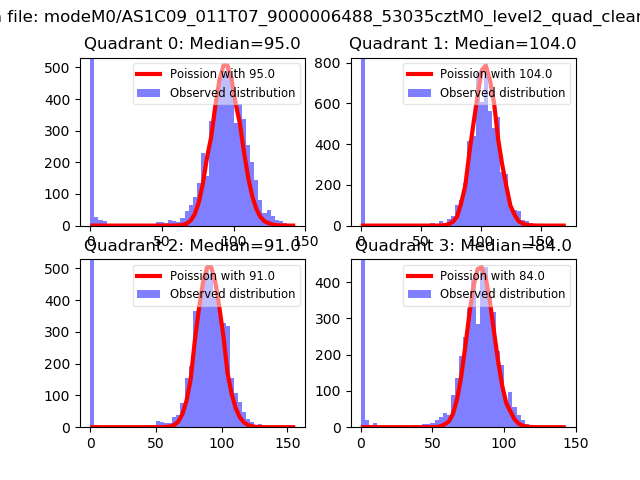 |
 |
| Quadrant-wise count rates Data is divided into 100 sec bins |
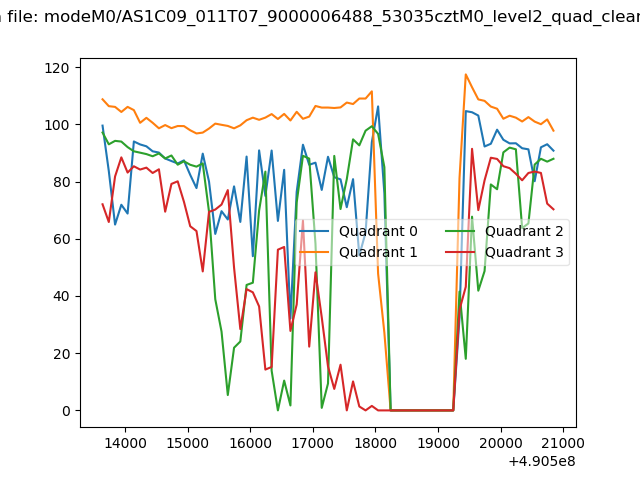 |
|
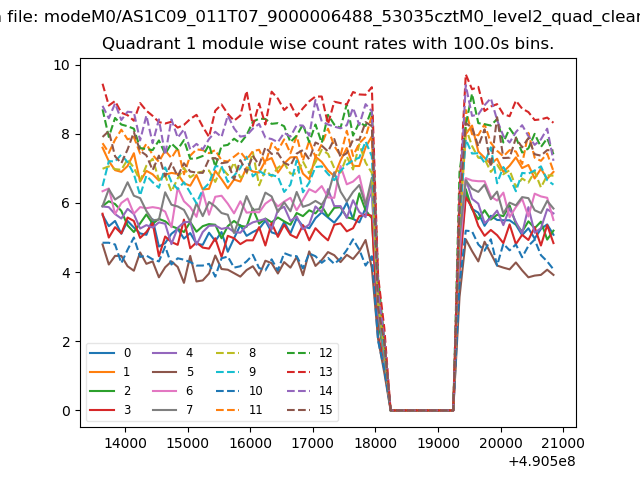
| Module-wise count rates for Quadrant A Data is divided into 100 sec bins |
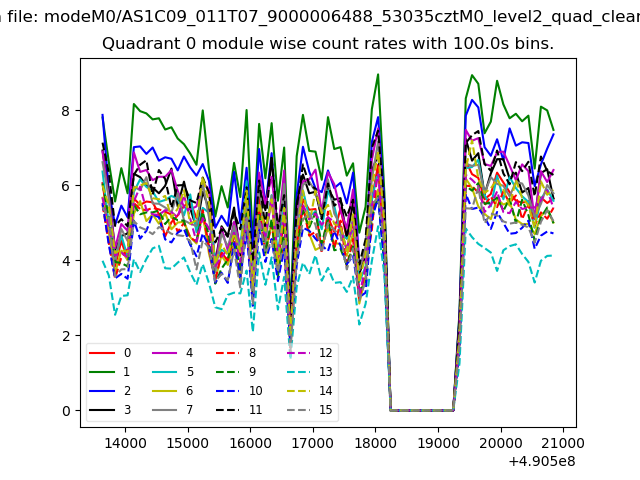 |
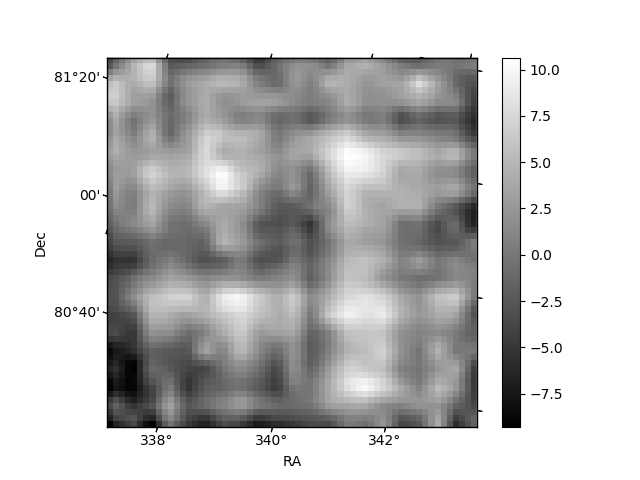 |
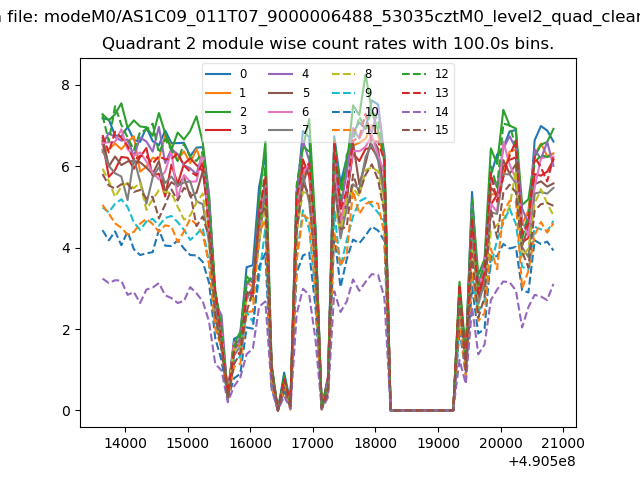
| Module-wise count rates for Quadrant B Data is divided into 100 sec bins |
 |
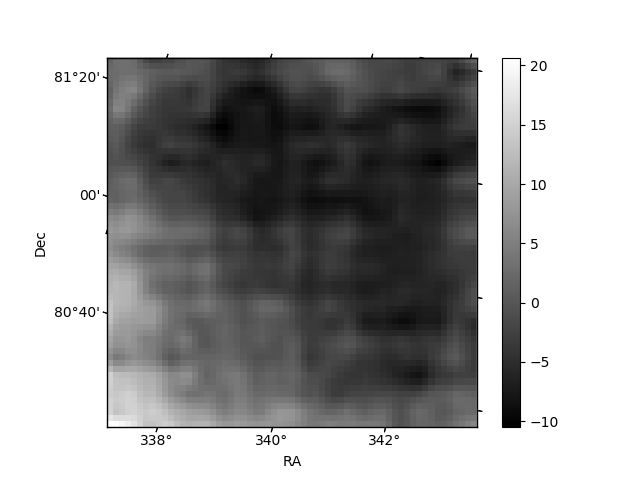 |
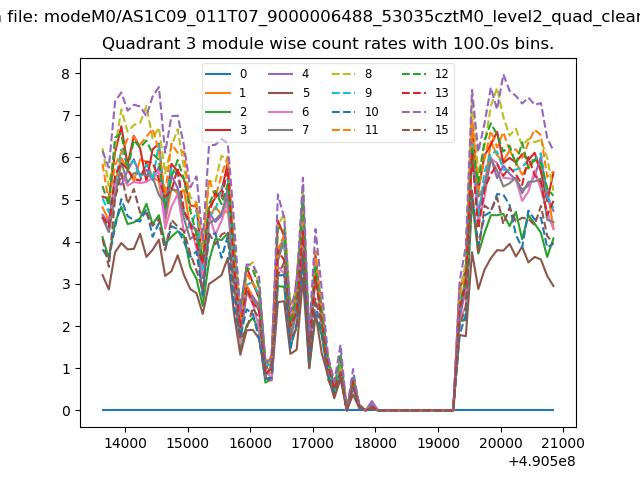
| Module-wise count rates for Quadrant C Data is divided into 100 sec bins |
 |
 |
| Module-wise count rates for Quadrant D Data is divided into 100 sec bins |
 |
 |
| Parameter | Plot |
|---|---|
| CZT HV Monitor | 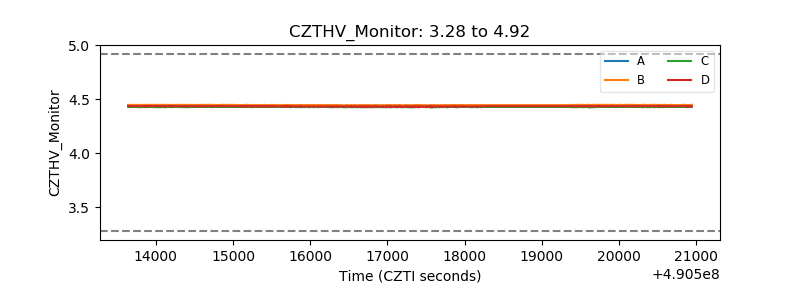 |
| D_VDD | 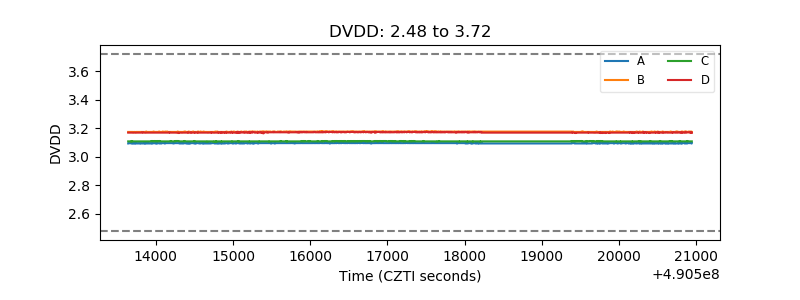 |
| Temperature 1 | 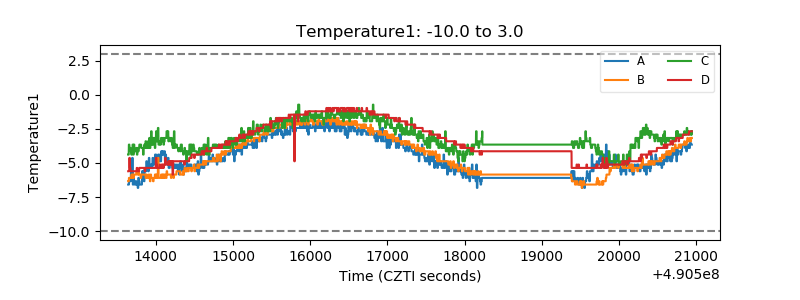 |
| Veto HV Monitor |  |
| Veto LLD | 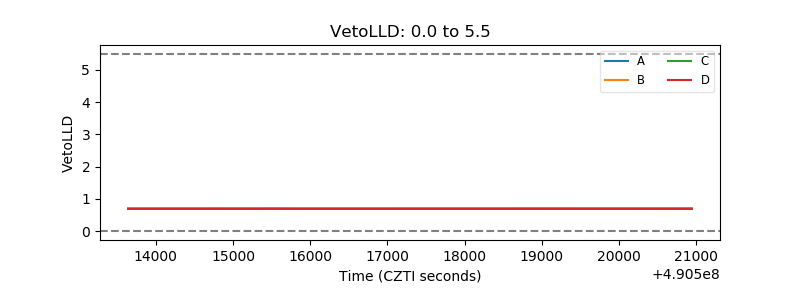 |
| Alpha Counter | 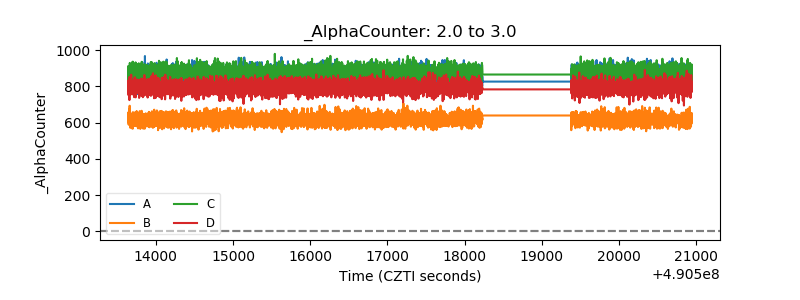 |
| _CPM_Rate | 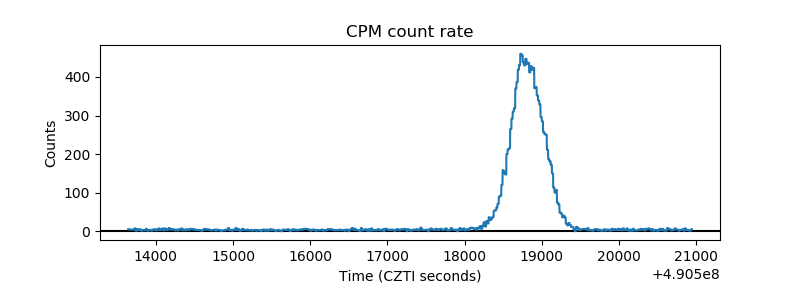 |
| CZT Counter | 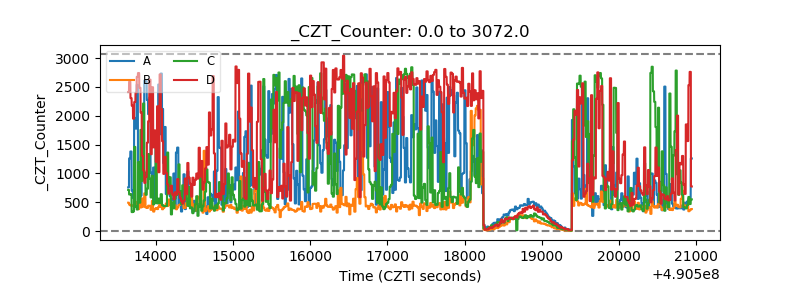 |
| +2.5 Volts monitor |  |
| +5 Volts monitor | 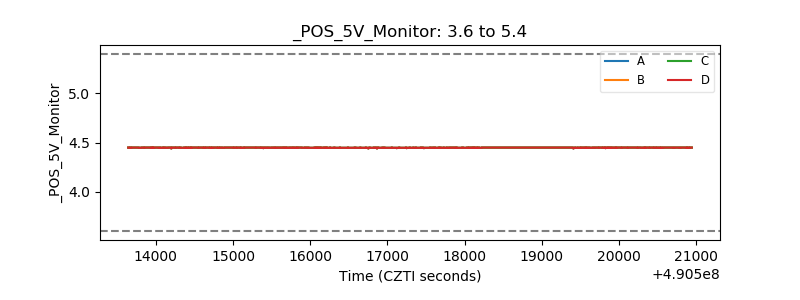 |
| _ROLL_ROT | 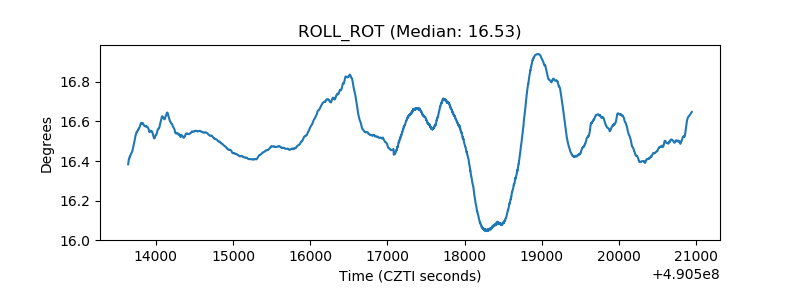 |
| _Roll_DEC | 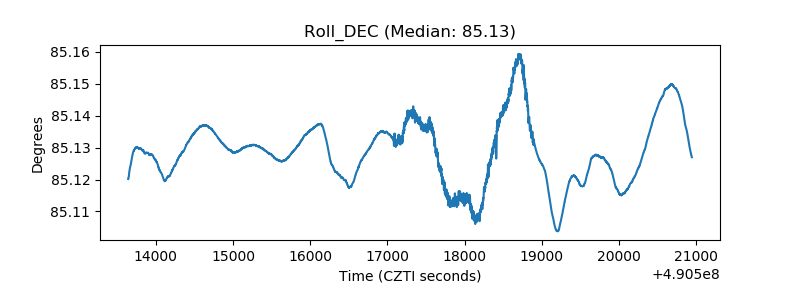 |
| _Roll_RA | 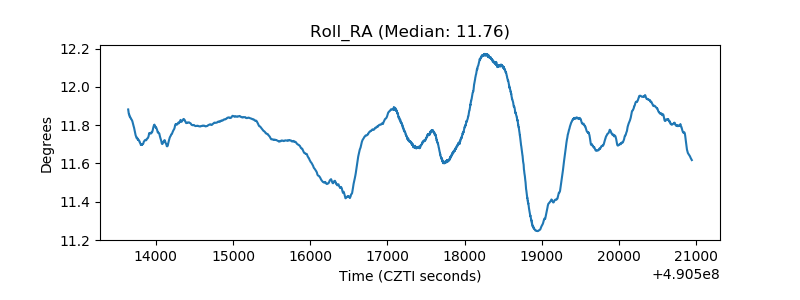 |
| Veto Counter | 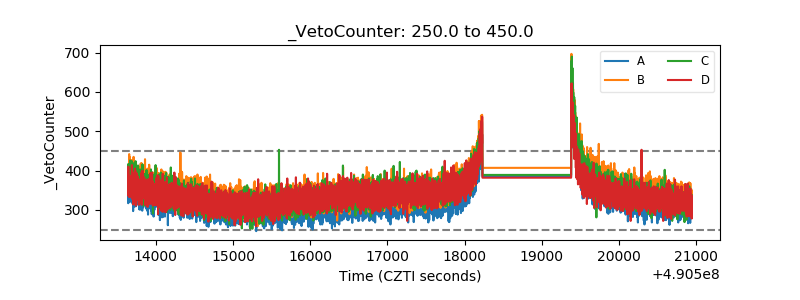 |