| Param | Original file | Final file |
|---|---|---|
| Filename | modeM0/AS1C09_011T07_9000006488_53036cztM0_level2.fits | modeM0/AS1C09_011T07_9000006488_53036cztM0_level2_quad_clean.evt |
| Size (bytes) | 792,538,560 | 79,660,800 |
| Size | 755.8 MB | 76.0 MB |
| Events in quadrant A | 9,453,047 | 431,351 |
| Events in quadrant B | 3,152,353 | 648,008 |
| Events in quadrant C | 6,339,178 | 505,813 |
| Events in quadrant D | 9,894,876 | 377,613 |
| Mode SS | |||
|---|---|---|---|
| Quadrant | BADHDUFLAG | Total packets | Discarded packets |
| A | 0 | 130 | 0 |
| B | 0 | 130 | 0 |
| C | 0 | 130 | 0 |
| D | 0 | 130 | 0 |
| Mode M9 | |||
|---|---|---|---|
| Quadrant | BADHDUFLAG | Total packets | Discarded packets |
| A | 0 | 10 | 0 |
| B | 0 | 10 | 0 |
| C | 0 | 10 | 0 |
| D | 0 | 10 | 0 |
| Mode M0 | |||
|---|---|---|---|
| Quadrant | BADHDUFLAG | Total packets | Discarded packets |
| A | 0 | 32529 | 1 |
| B | 0 | 14168 | 1 |
| C | 0 | 23326 | 1 |
| D | 0 | 33878 | 1 |
| Quadrant | Total seconds | Saturated seconds | Saturation percentage |
|---|---|---|---|
| A | 6437 | 2238 | 34.767749% |
| B | 6437 | 164 | 2.547771% |
| C | 6437 | 964 | 14.975920% |
| D | 6438 | 2219 | 34.467226% |
Noise dominated data is calculated using 1-second bins in cleaned event files. If a bin has >2000 counts, and if more than 50% of those come from <1% of pixels, then it is considered to be noise-dominated and hence unusable.
| Quadrant | # 1 sec bins | Bins with >0 counts | Bins with >2000 counts | High rate bins dominated by noise | Noise dominated (total time) | Noise dominated (detector-on time) | Marked lightcurve |
|---|---|---|---|---|---|---|---|
| A | 7456 | 6436 | 2031 | 2031 | 27.24% | 31.56% | 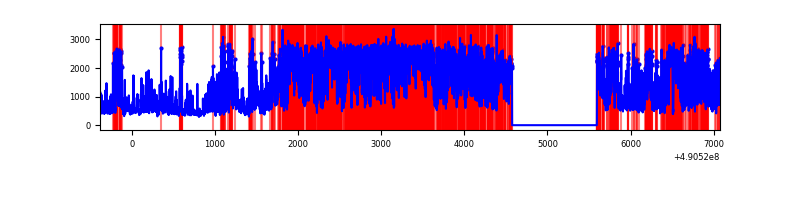 |
| B | 7457 | 6437 | 32 | 32 | 0.43% | 0.50% | 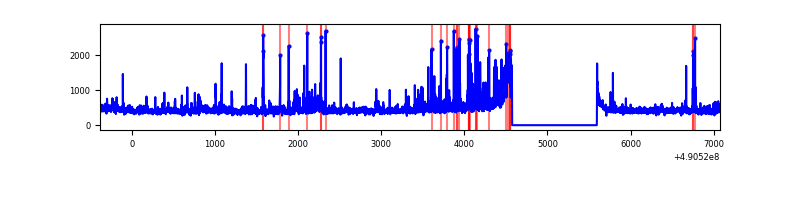 |
| C | 7457 | 6437 | 859 | 859 | 11.52% | 13.34% | 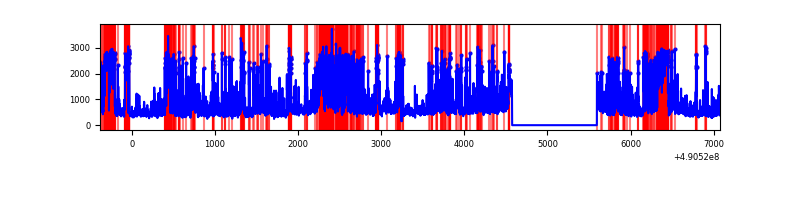 |
| D | 7458 | 6438 | 2143 | 2143 | 28.73% | 33.29% | 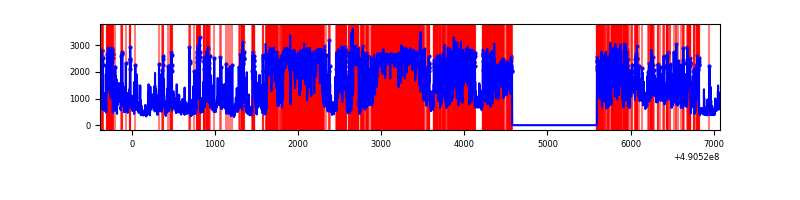 |
Top three noisy pixels from each quadrant. If the there are fewer than three noisy pixels in the level2.evt file, extra rows are filled as -1
| Pixel properties | Quadrant properties | ||||||
|---|---|---|---|---|---|---|---|
| Quadrant | DetID | PixID | Counts | Sigma | Mean | Median | Sigma |
| A | 9 | 191 | 5780195 | 40642.95 | 573 | 559 | 142.2 |
| A | 7 | 206 | 857797 | 6028.18 | 573 | 559 | 142.2 |
| A | 4 | 249 | 319530 | 2243.03 | 573 | 559 | 142.2 |
| B | 4 | 81 | 122679 | 887.94 | 652 | 630 | 137.5 |
| B | 10 | 44 | 92886 | 671.19 | 652 | 630 | 137.5 |
| B | 5 | 173 | 63562 | 457.85 | 652 | 630 | 137.5 |
| C | 15 | 224 | 1795625 | 11005.99 | 594 | 587 | 163.1 |
| C | 1 | 241 | 793624 | 4862.38 | 594 | 587 | 163.1 |
| C | 12 | 2 | 479023 | 2933.45 | 594 | 587 | 163.1 |
| D | 8 | 176 | 3550037 | 22923.78 | 529 | 501 | 154.8 |
| D | 12 | 17 | 1665117 | 10750.5 | 529 | 501 | 154.8 |
| D | 15 | 78 | 1138524 | 7349.63 | 529 | 501 | 154.8 |
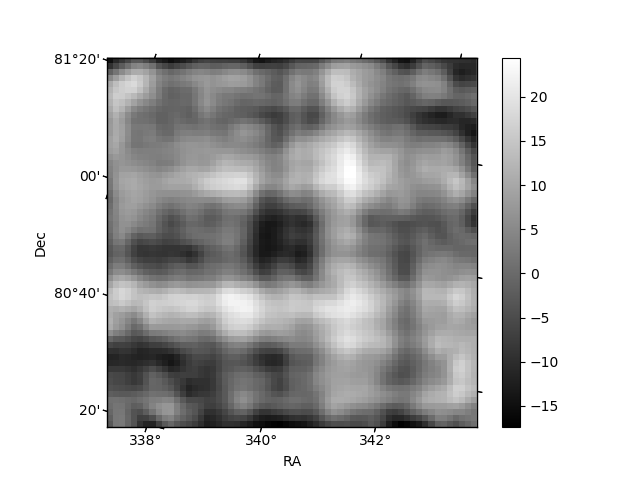
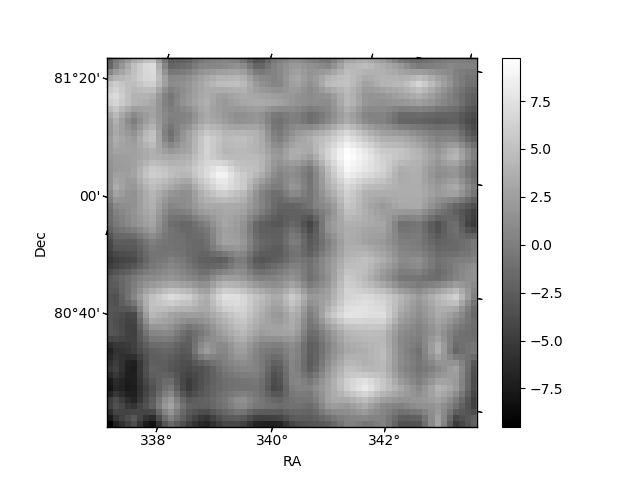
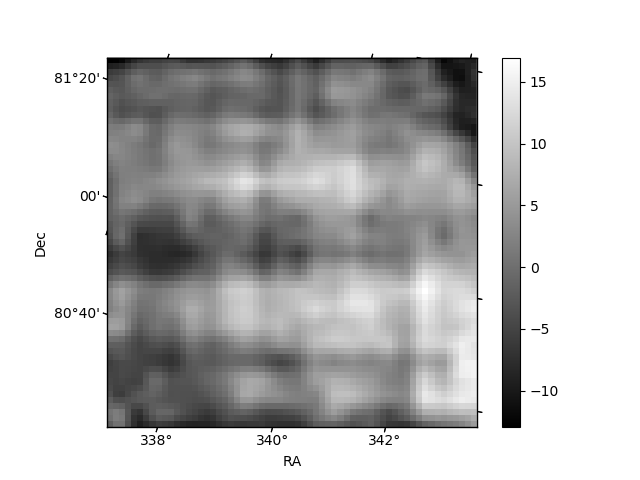
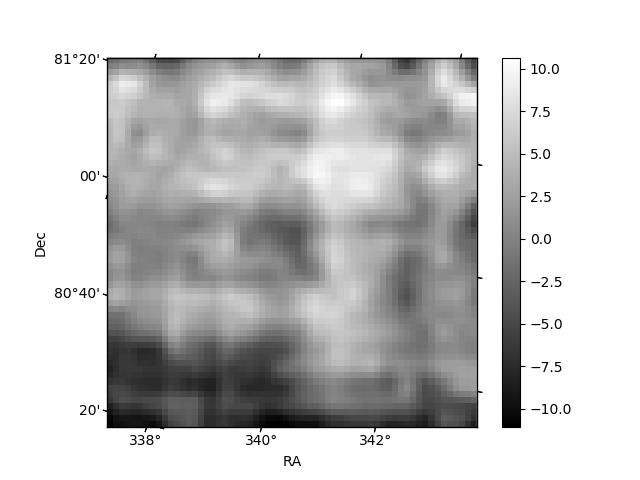
Histogram calculated using DETX and DETY for each event in the final _common_clean file
| Quadrant A | 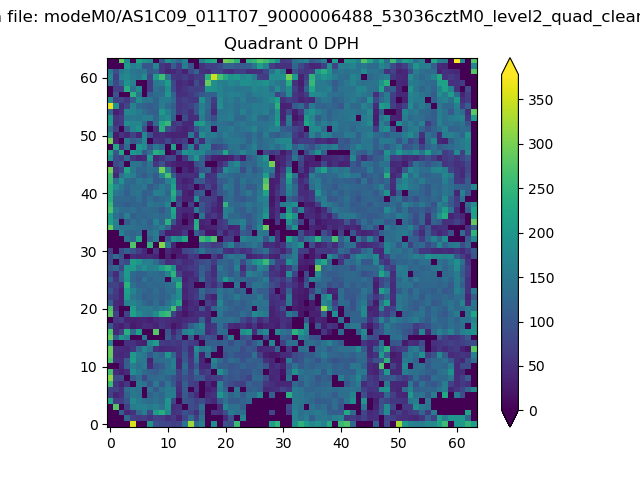 |
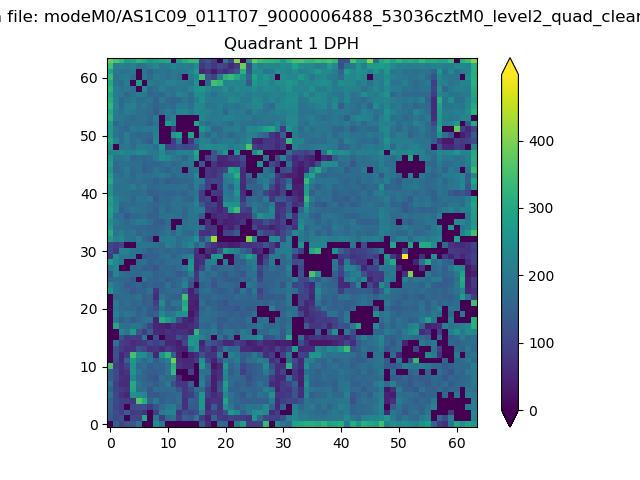 |
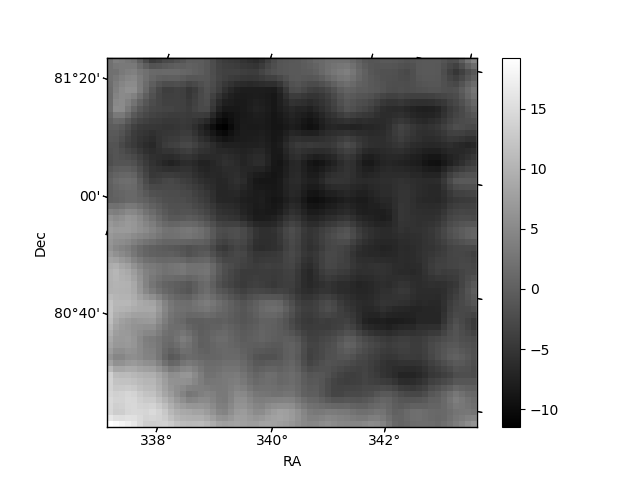
Quadrant B |
|---|---|---|---|
| Quadrant D | 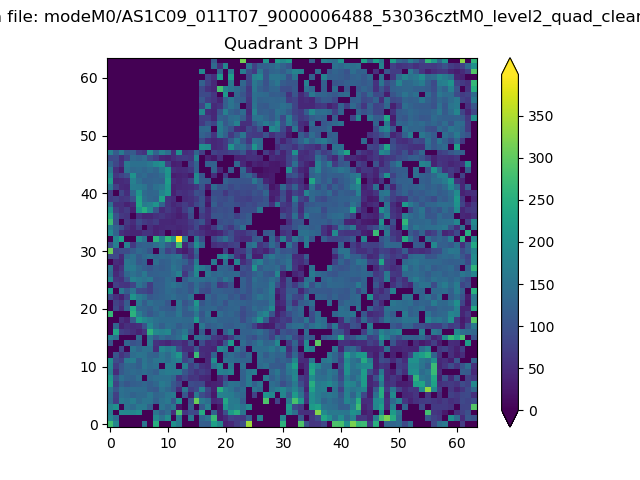 |
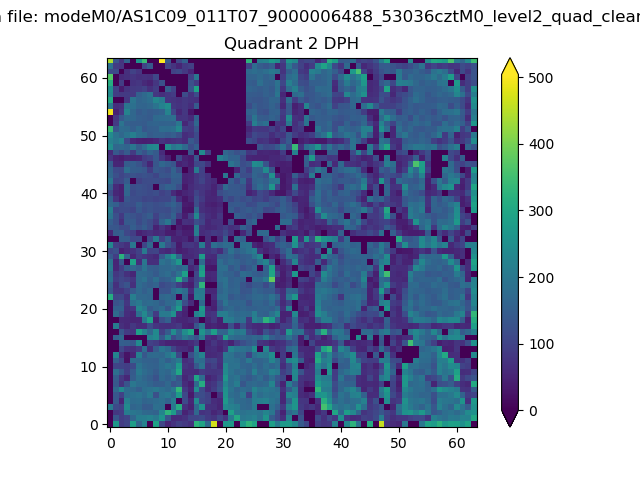 |
Quadrant C |
| Plot type | Count rate plots | Images |
|---|---|---|
| Comparison with Poisson distribution Blue bars denote a histogram of data divided into 1 sec bins. Red curve is a Poisson curve with rate = median count rate of data. |
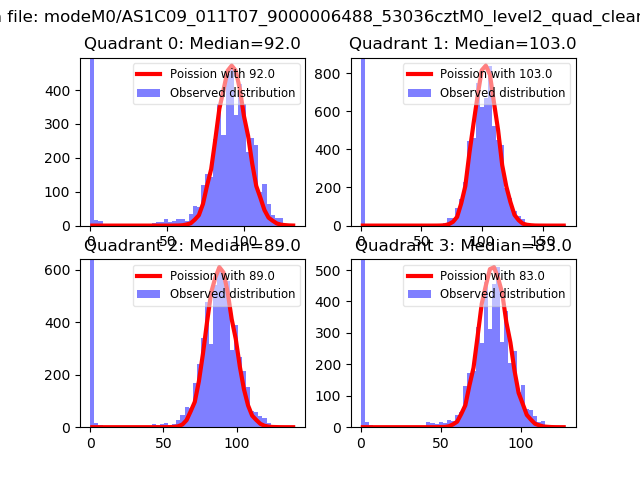 |
 |
| Quadrant-wise count rates Data is divided into 100 sec bins |
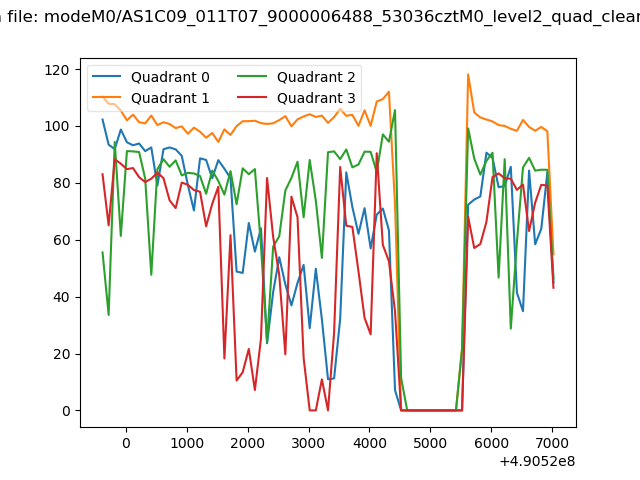 |
|
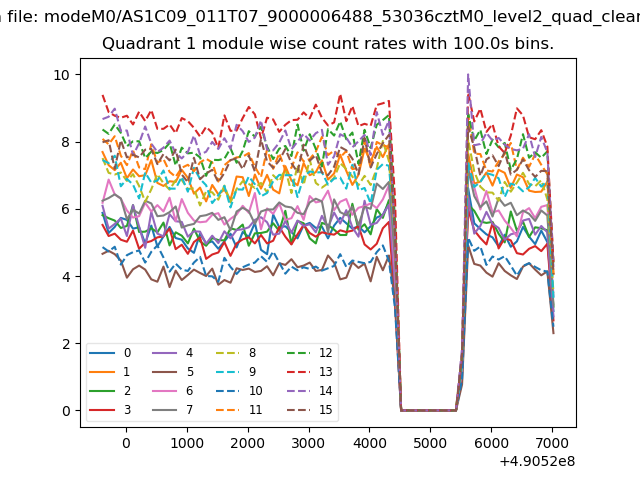
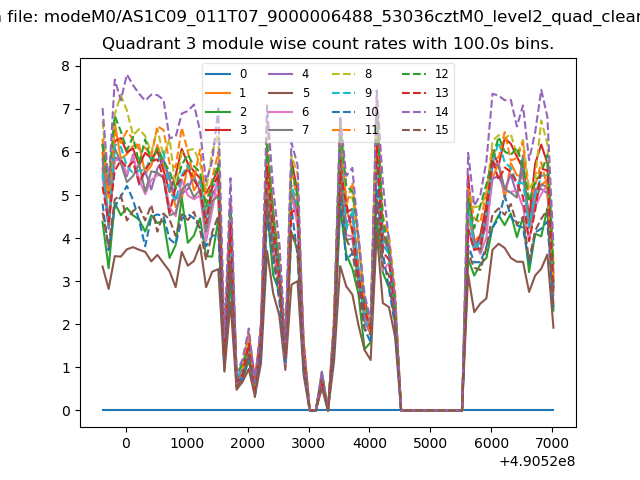
| Module-wise count rates for Quadrant A Data is divided into 100 sec bins |
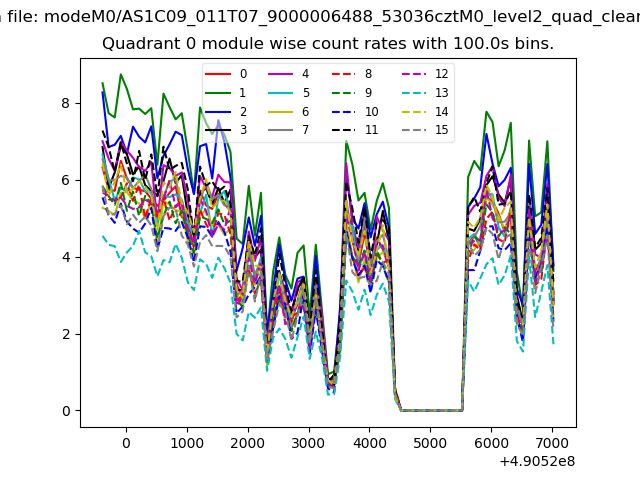 |
 |
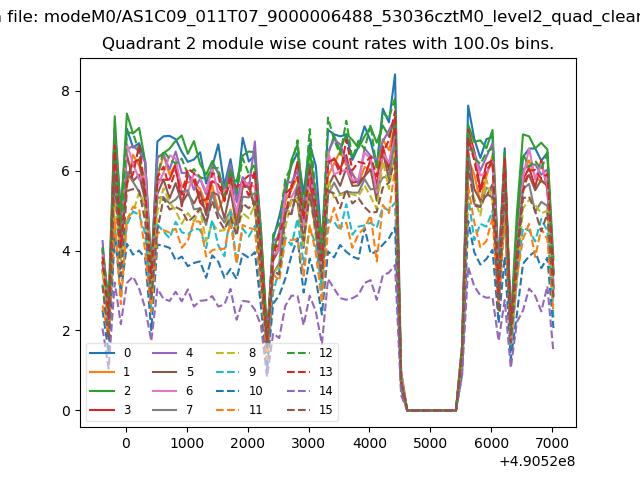
| Module-wise count rates for Quadrant B Data is divided into 100 sec bins |
 |
 |
| Module-wise count rates for Quadrant C Data is divided into 100 sec bins |
 |
 |
| Module-wise count rates for Quadrant D Data is divided into 100 sec bins |
 |
 |
| Parameter | Plot |
|---|---|
| CZT HV Monitor | 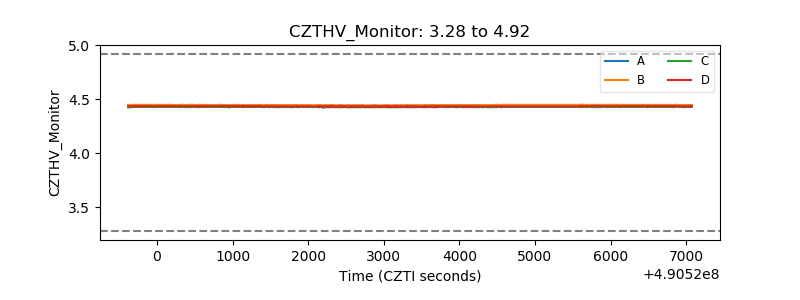 |
| D_VDD | 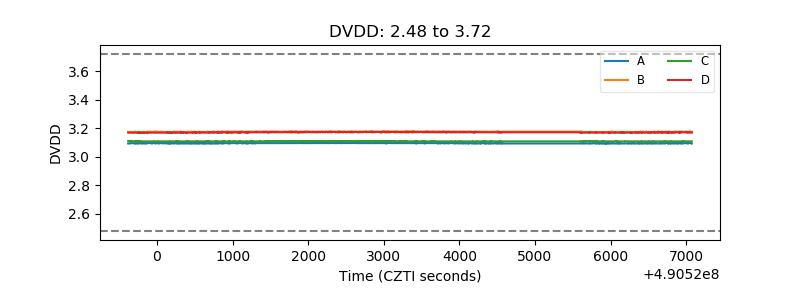 |
| Temperature 1 | 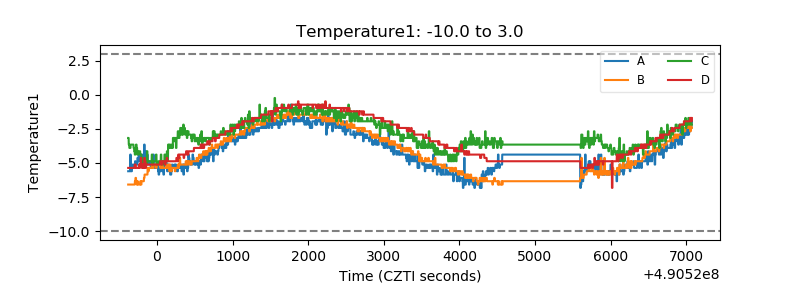 |
| Veto HV Monitor | 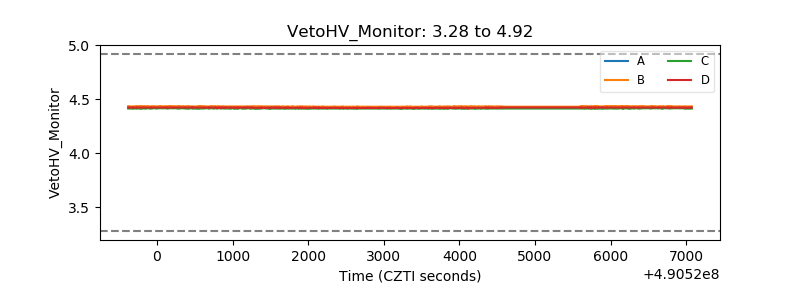 |
| Veto LLD | 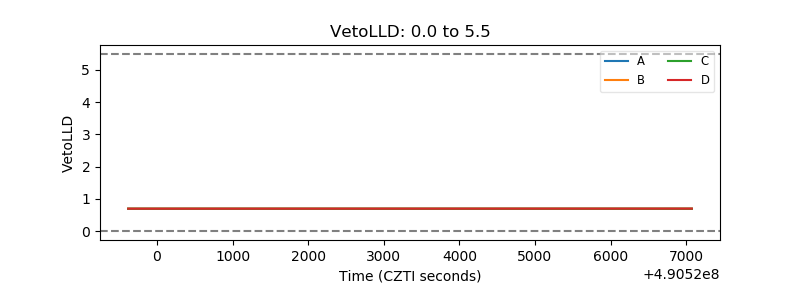 |
| Alpha Counter | 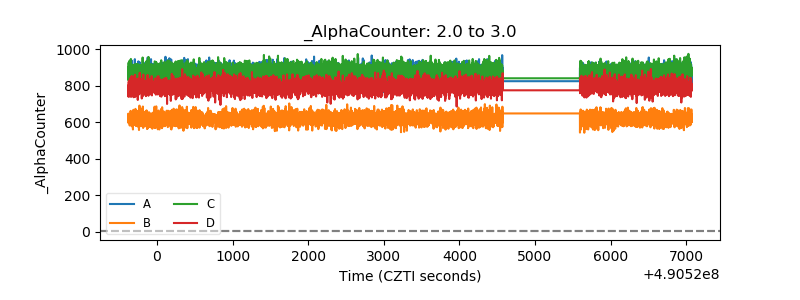 |
| _CPM_Rate | 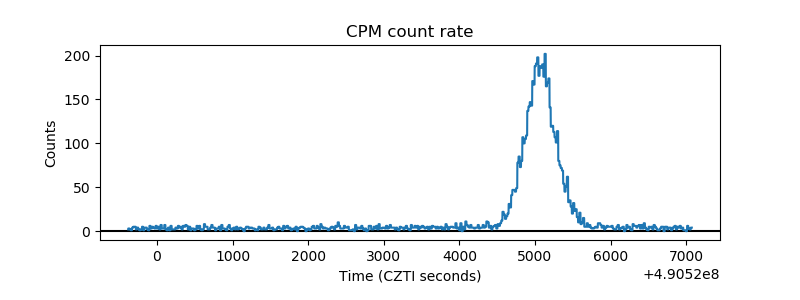 |
| CZT Counter | 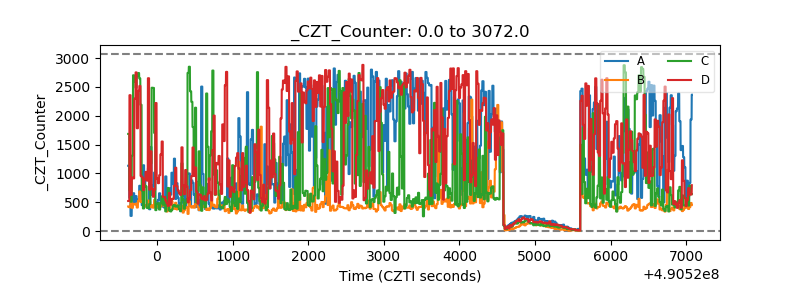 |
| +2.5 Volts monitor | 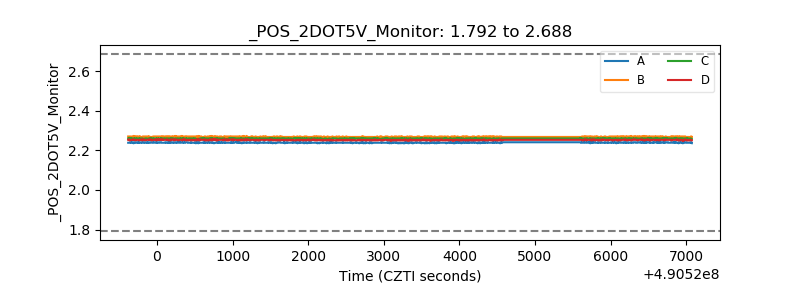 |
| +5 Volts monitor | 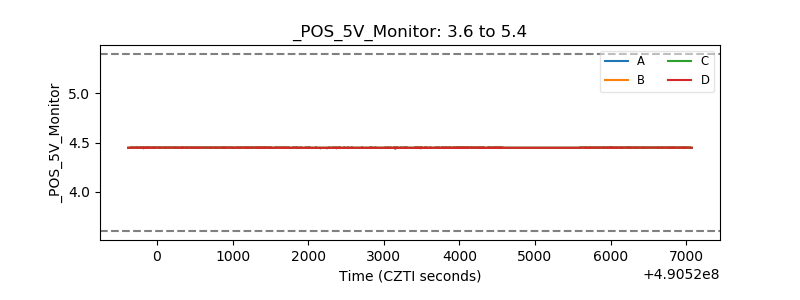 |
| _ROLL_ROT | 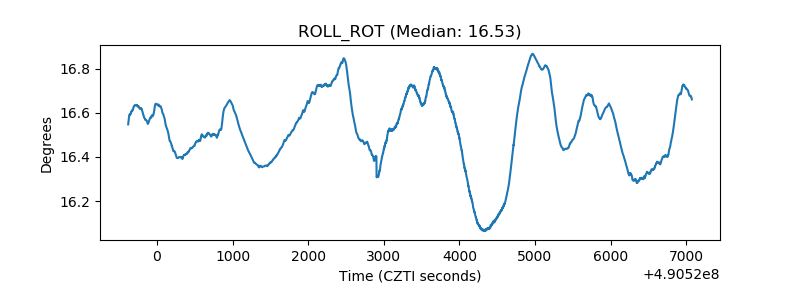 |
| _Roll_DEC | 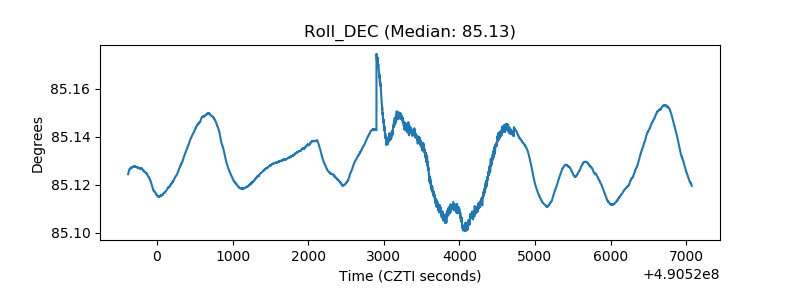 |
| _Roll_RA | 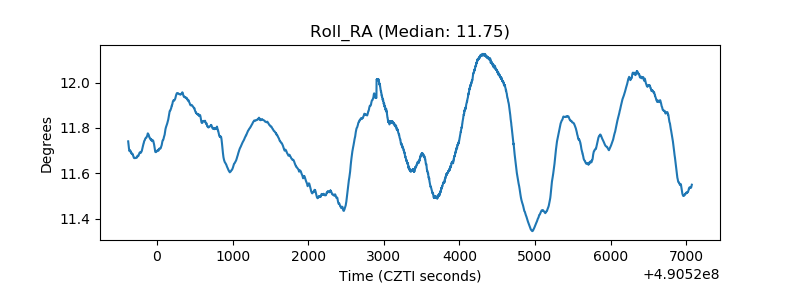 |
| Veto Counter | 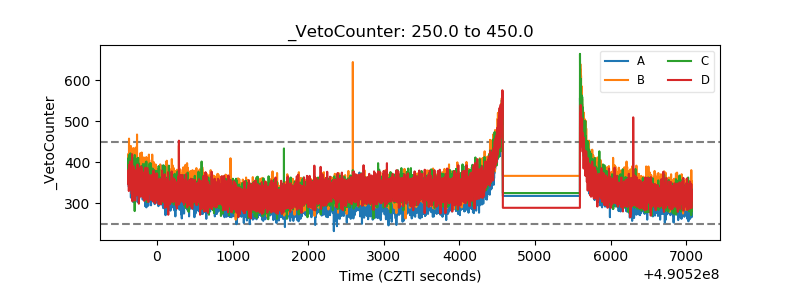 |