| Param | Original file | Final file |
|---|---|---|
| Filename | modeM0/AS1C09_011T07_9000006488_53037cztM0_level2.fits | modeM0/AS1C09_011T07_9000006488_53037cztM0_level2_quad_clean.evt |
| Size (bytes) | 967,795,200 | 77,676,480 |
| Size | 923.0 MB | 74.1 MB |
| Events in quadrant A | 11,604,267 | 400,426 |
| Events in quadrant B | 3,987,893 | 674,741 |
| Events in quadrant C | 8,152,402 | 483,178 |
| Events in quadrant D | 11,552,865 | 316,996 |
| Mode SS | |||
|---|---|---|---|
| Quadrant | BADHDUFLAG | Total packets | Discarded packets |
| A | 0 | 140 | 0 |
| B | 0 | 140 | 0 |
| C | 0 | 140 | 0 |
| D | 0 | 140 | 0 |
| Mode M9 | |||
|---|---|---|---|
| Quadrant | BADHDUFLAG | Total packets | Discarded packets |
| A | 0 | 7 | 0 |
| B | 0 | 7 | 0 |
| C | 0 | 7 | 0 |
| D | 0 | 7 | 0 |
| Mode M0 | |||
|---|---|---|---|
| Quadrant | BADHDUFLAG | Total packets | Discarded packets |
| A | 0 | 39176 | 3 |
| B | 0 | 16845 | 1 |
| C | 0 | 28974 | 1 |
| D | 0 | 39013 | 1 |
| Quadrant | Total seconds | Saturated seconds | Saturation percentage |
|---|---|---|---|
| A | 6825 | 3074 | 45.040293% |
| B | 6826 | 279 | 4.087313% |
| C | 6826 | 1600 | 23.439789% |
| D | 6826 | 3353 | 49.121008% |
Noise dominated data is calculated using 1-second bins in cleaned event files. If a bin has >2000 counts, and if more than 50% of those come from <1% of pixels, then it is considered to be noise-dominated and hence unusable.
| Quadrant | # 1 sec bins | Bins with >0 counts | Bins with >2000 counts | High rate bins dominated by noise | Noise dominated (total time) | Noise dominated (detector-on time) | Marked lightcurve |
|---|---|---|---|---|---|---|---|
| A | 7584 | 6824 | 2840 | 2840 | 37.45% | 41.62% | 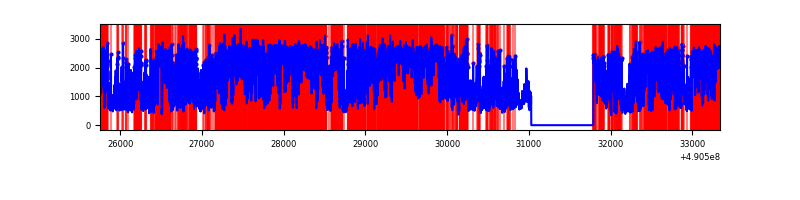 |
| B | 7586 | 6826 | 189 | 189 | 2.49% | 2.77% | 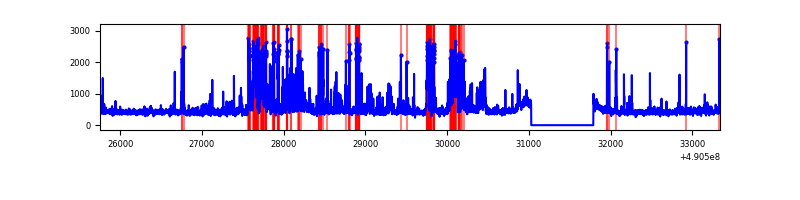 |
| C | 7586 | 6826 | 1548 | 1548 | 20.41% | 22.68% | 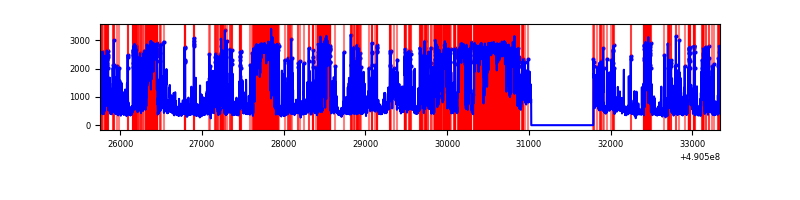 |
| D | 7586 | 6826 | 2875 | 2875 | 37.90% | 42.12% | 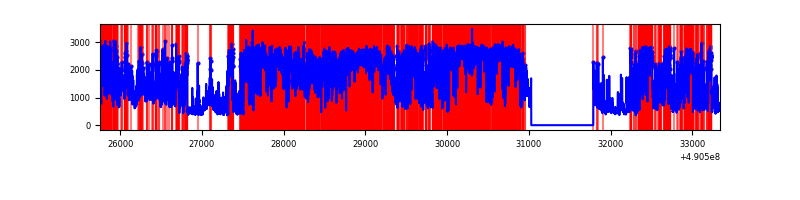 |
Top three noisy pixels from each quadrant. If the there are fewer than three noisy pixels in the level2.evt file, extra rows are filled as -1
| Pixel properties | Quadrant properties | ||||||
|---|---|---|---|---|---|---|---|
| Quadrant | DetID | PixID | Counts | Sigma | Mean | Median | Sigma |
| A | 9 | 191 | 7838669 | 52716.62 | 592 | 578 | 148.7 |
| A | 7 | 206 | 538359 | 3616.95 | 592 | 578 | 148.7 |
| A | 4 | 249 | 364683 | 2448.86 | 592 | 578 | 148.7 |
| B | 10 | 44 | 393366 | 2690.74 | 690 | 666 | 145.9 |
| B | 4 | 81 | 305626 | 2089.56 | 690 | 666 | 145.9 |
| B | 10 | 247 | 188532 | 1287.24 | 690 | 666 | 145.9 |
| C | 1 | 241 | 3267408 | 19518.04 | 606 | 599 | 167.4 |
| C | 15 | 224 | 1238451 | 7395.73 | 606 | 599 | 167.4 |
| C | 15 | 147 | 272679 | 1625.58 | 606 | 599 | 167.4 |
| D | 8 | 176 | 3886949 | 27863.01 | 479 | 456 | 139.5 |
| D | 12 | 17 | 3531711 | 25316.24 | 479 | 456 | 139.5 |
| D | 15 | 78 | 1278840 | 9164.98 | 479 | 456 | 139.5 |
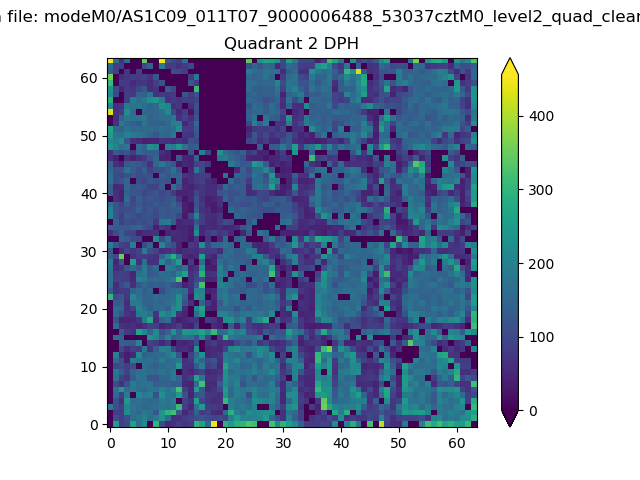
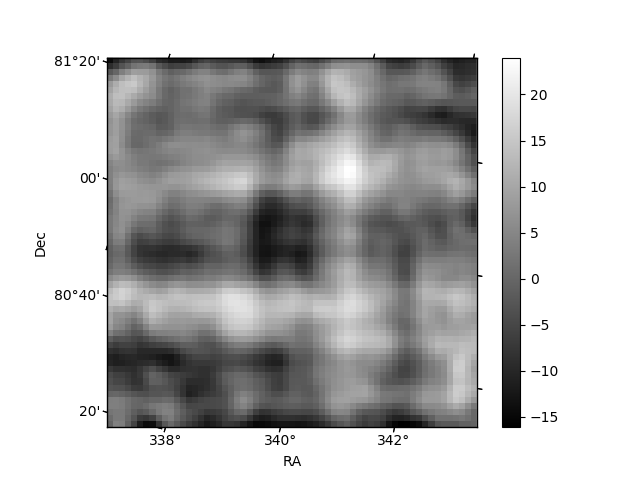
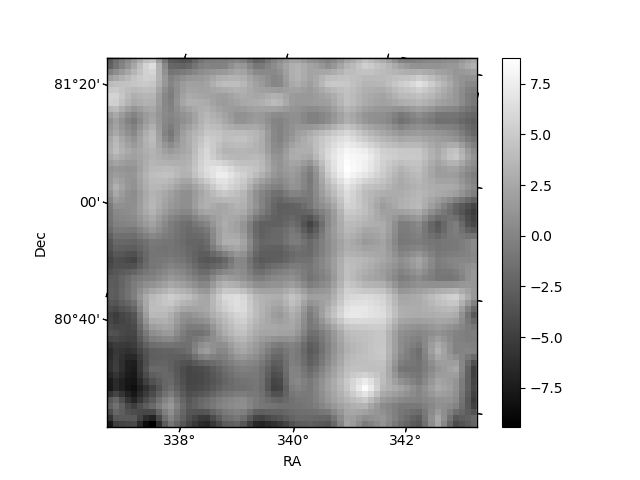
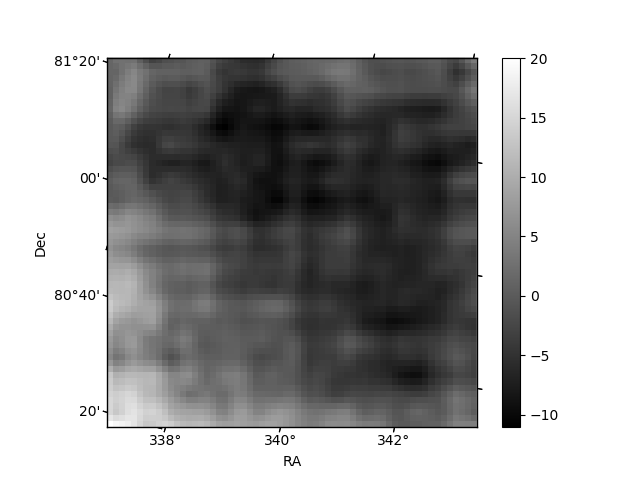
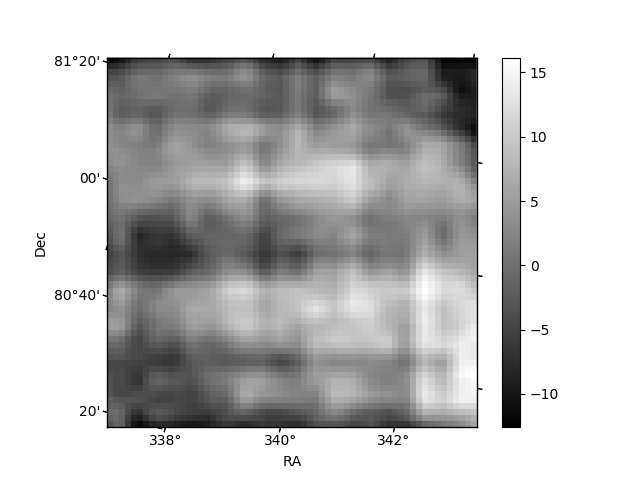
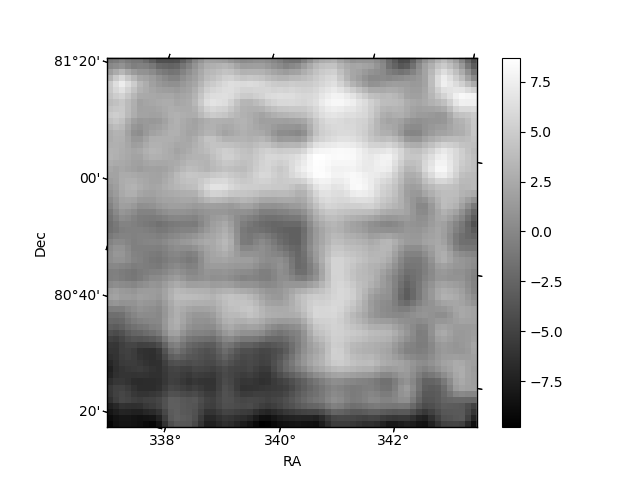
Histogram calculated using DETX and DETY for each event in the final _common_clean file
| Quadrant A | 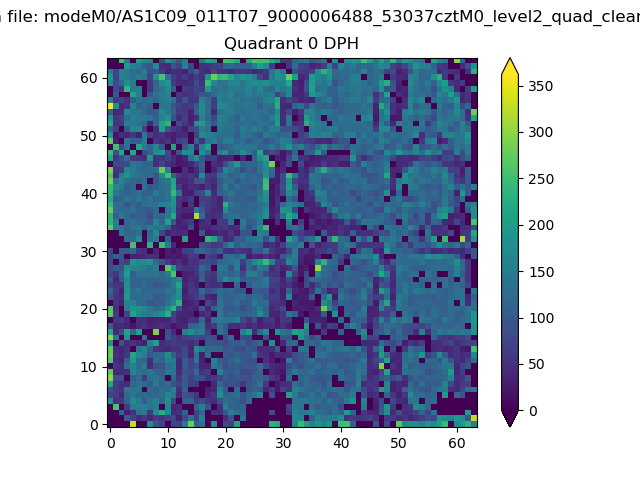 |
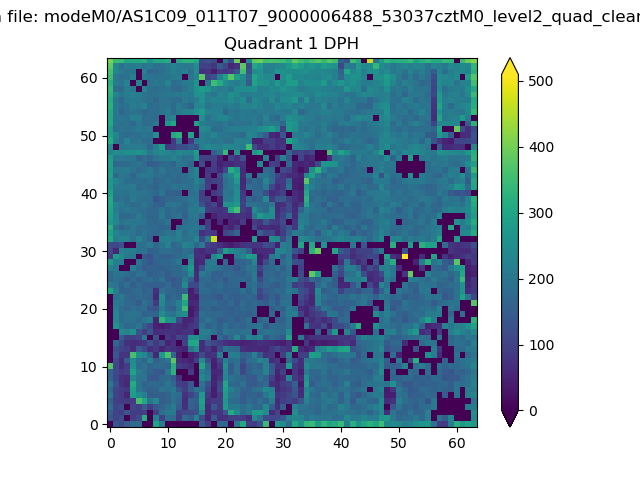 |
Quadrant B |
|---|---|---|---|
| Quadrant D | 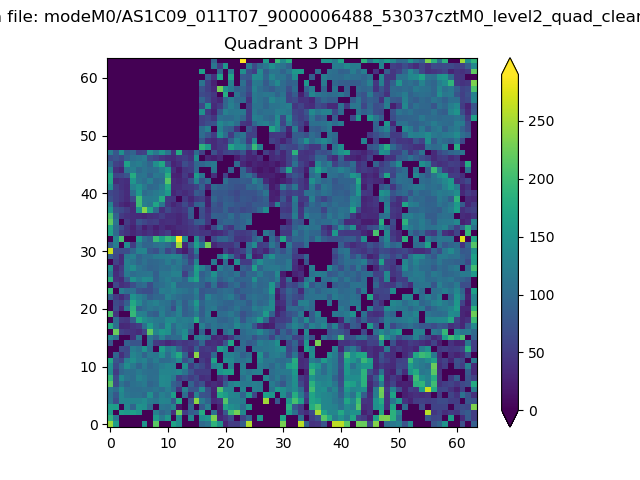 |
 |
Quadrant C |
| Plot type | Count rate plots | Images |
|---|---|---|
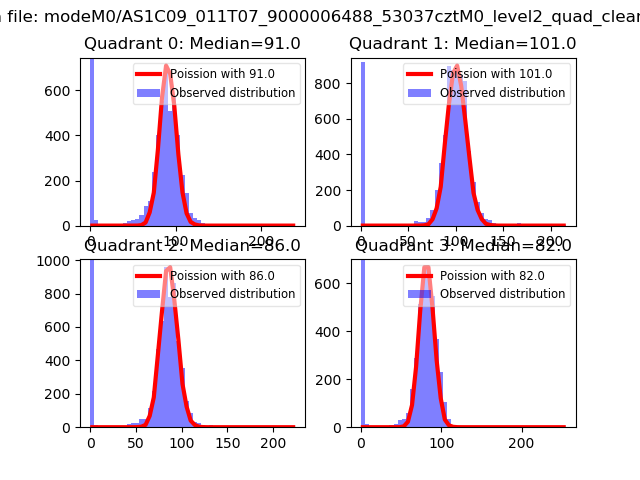
| Comparison with Poisson distribution Blue bars denote a histogram of data divided into 1 sec bins. Red curve is a Poisson curve with rate = median count rate of data. |
 |
 |
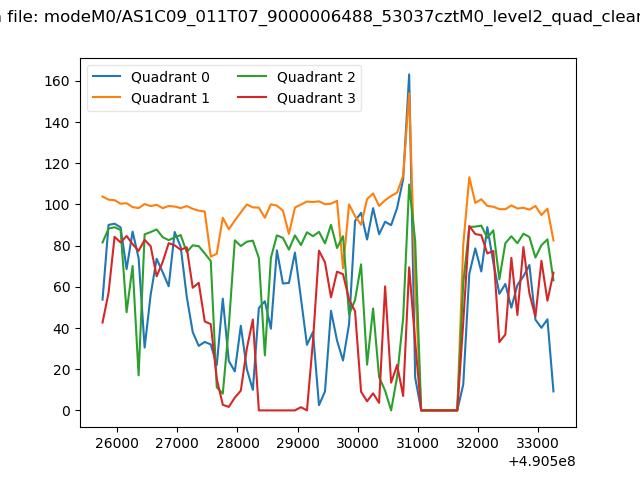
| Quadrant-wise count rates Data is divided into 100 sec bins |
 |
|
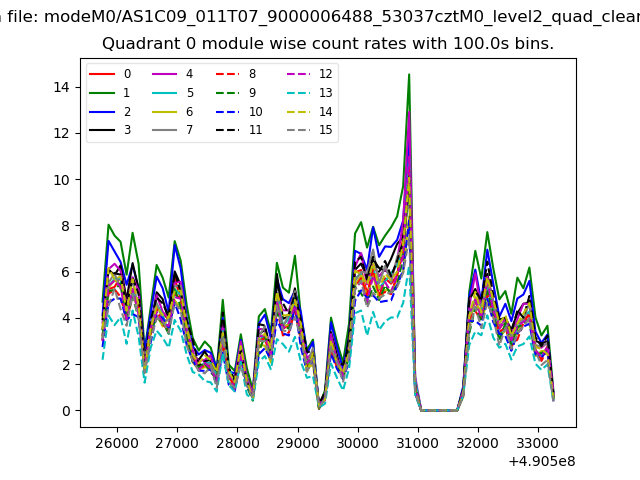
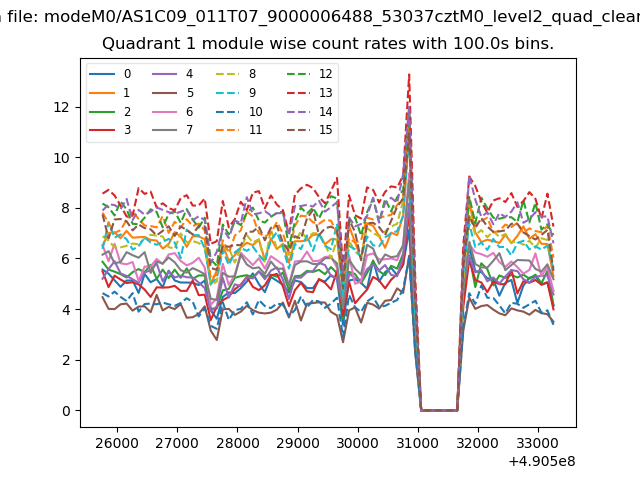
| Module-wise count rates for Quadrant A Data is divided into 100 sec bins |
 |
 |
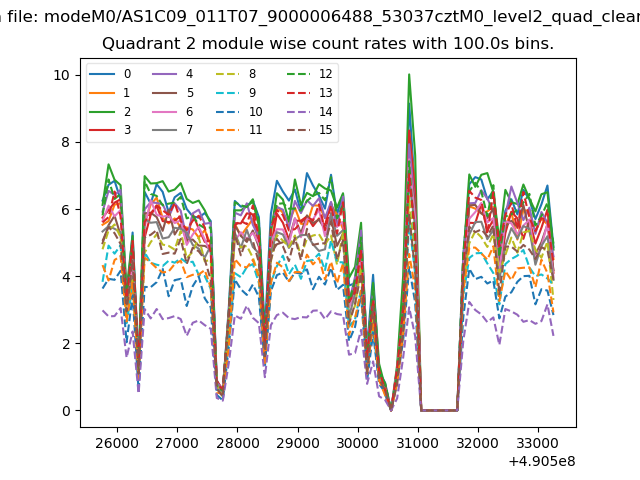
| Module-wise count rates for Quadrant B Data is divided into 100 sec bins |
 |
 |
| Module-wise count rates for Quadrant C Data is divided into 100 sec bins |
 |
 |
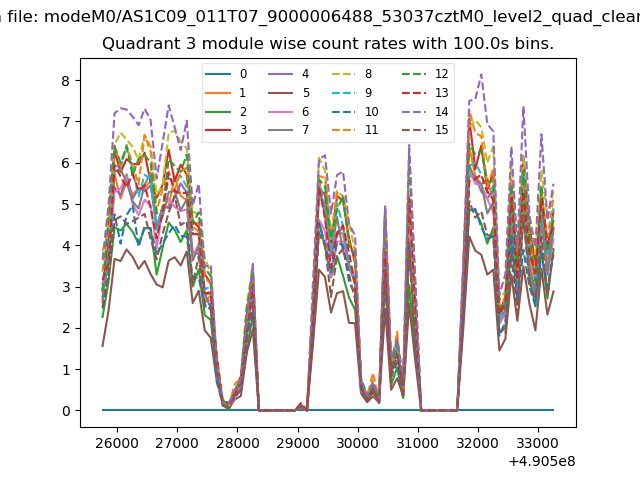
| Module-wise count rates for Quadrant D Data is divided into 100 sec bins |
 |
 |
| Parameter | Plot |
|---|---|
| CZT HV Monitor |  |
| D_VDD | 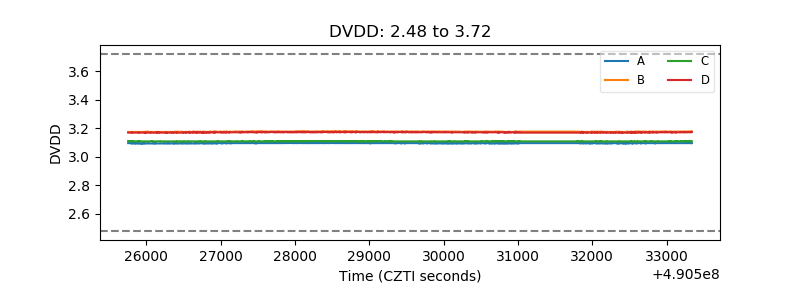 |
| Temperature 1 | 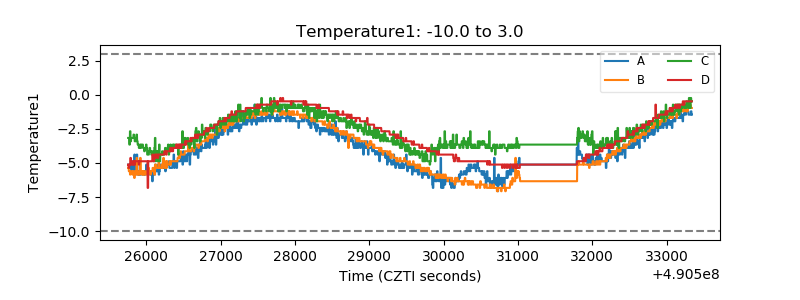 |
| Veto HV Monitor | 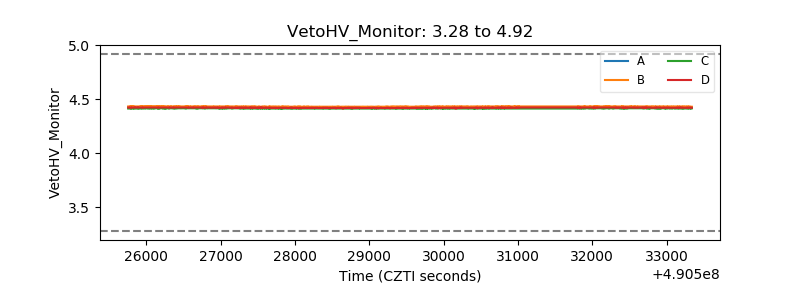 |
| Veto LLD | 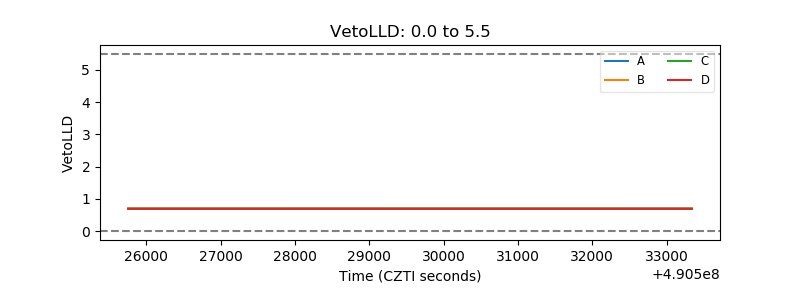 |
| Alpha Counter | 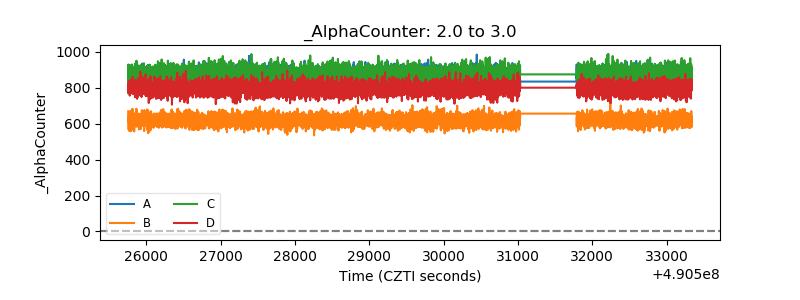 |
| _CPM_Rate | 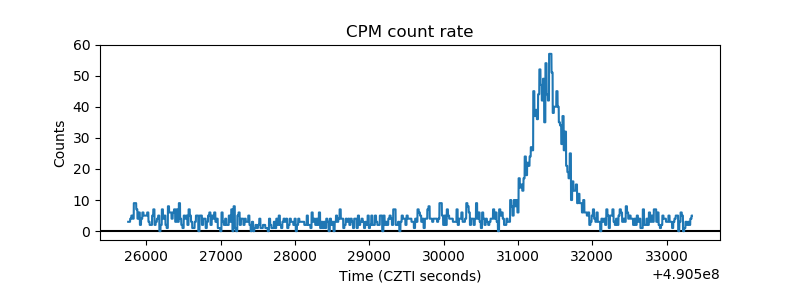 |
| CZT Counter | 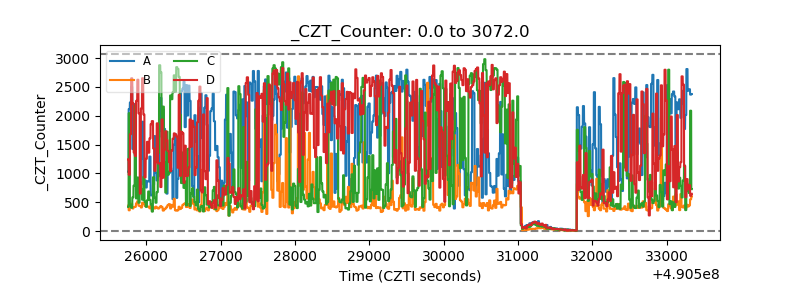 |
| +2.5 Volts monitor |  |
| +5 Volts monitor |  |
| _ROLL_ROT | 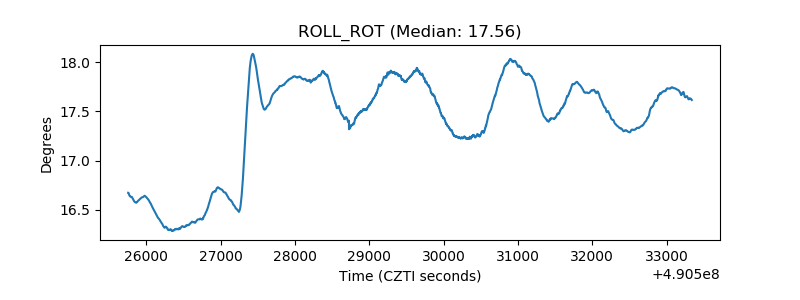 |
| _Roll_DEC | 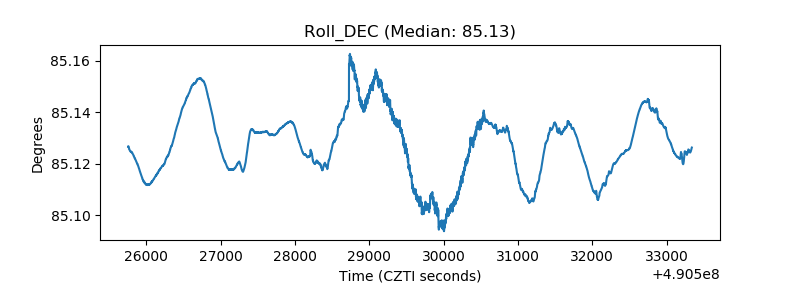 |
| _Roll_RA | 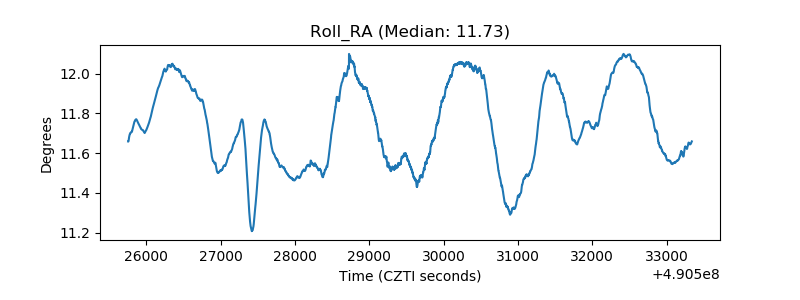 |
| Veto Counter | 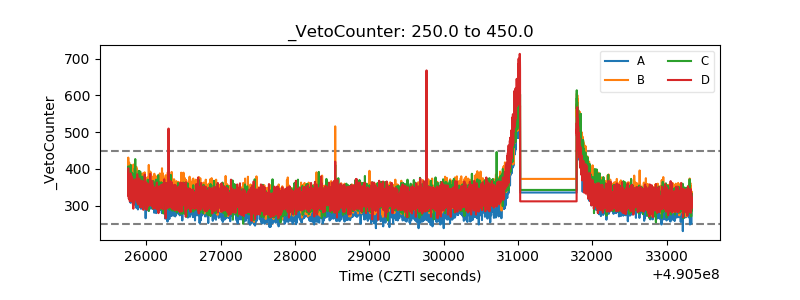 |