| Param | Original file | Final file |
|---|---|---|
| Filename | modeM0/AS1C09_011T07_9000006488_53038cztM0_level2.fits | modeM0/AS1C09_011T07_9000006488_53038cztM0_level2_quad_clean.evt |
| Size (bytes) | 1,149,779,520 | 61,453,440 |
| Size | 1.1 GB | 58.6 MB |
| Events in quadrant A | 15,323,282 | 67,967 |
| Events in quadrant B | 3,905,993 | 688,278 |
| Events in quadrant C | 9,152,007 | 442,477 |
| Events in quadrant D | 13,652,351 | 185,036 |
| Mode SS | |||
|---|---|---|---|
| Quadrant | BADHDUFLAG | Total packets | Discarded packets |
| A | 0 | 143 | 4 |
| B | 0 | 144 | 0 |
| C | 0 | 144 | 8 |
| D | 0 | 142 | 2 |
| Mode M9 | |||
|---|---|---|---|
| Quadrant | BADHDUFLAG | Total packets | Discarded packets |
| A | 0 | 2 | 0 |
| B | 0 | 2 | 0 |
| C | 0 | 2 | 0 |
| D | 0 | 2 | 0 |
| Mode M0 | |||
|---|---|---|---|
| Quadrant | BADHDUFLAG | Total packets | Discarded packets |
| A | 0 | 53471 | 3478 |
| B | 0 | 17200 | 550 |
| C | 0 | 33273 | 1277 |
| D | 0 | 48052 | 2842 |
| Quadrant | Total seconds | Saturated seconds | Saturation percentage |
|---|---|---|---|
| A | 6707 | 6021 | 89.771880% |
| B | 6957 | 219 | 3.147909% |
| C | 6898 | 2027 | 29.385329% |
| D | 6771 | 4905 | 72.441294% |
Noise dominated data is calculated using 1-second bins in cleaned event files. If a bin has >2000 counts, and if more than 50% of those come from <1% of pixels, then it is considered to be noise-dominated and hence unusable.
| Quadrant | # 1 sec bins | Bins with >0 counts | Bins with >2000 counts | High rate bins dominated by noise | Noise dominated (total time) | Noise dominated (detector-on time) | Marked lightcurve |
|---|---|---|---|---|---|---|---|
| A | 7378 | 6760 | 5817 | 5817 | 78.84% | 86.05% | 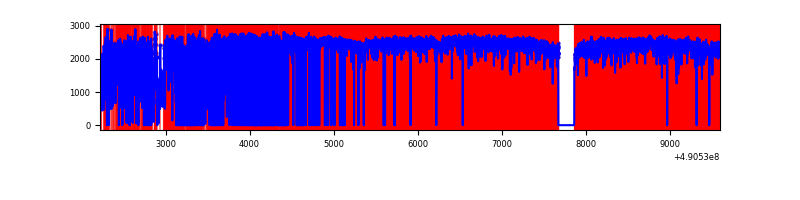 |
| B | 7380 | 7115 | 136 | 136 | 1.84% | 1.91% | 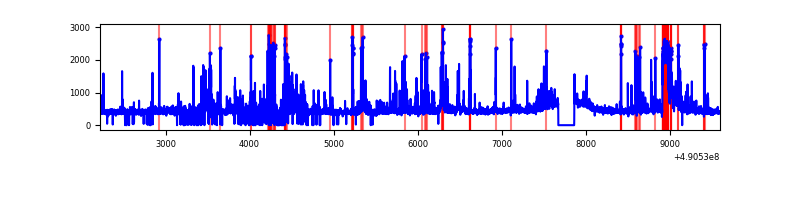 |
| C | 7378 | 7057 | 2003 | 2003 | 27.15% | 28.38% | 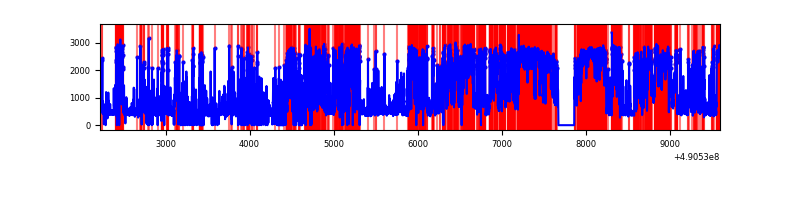 |
| D | 7378 | 6833 | 4232 | 4232 | 57.36% | 61.93% | 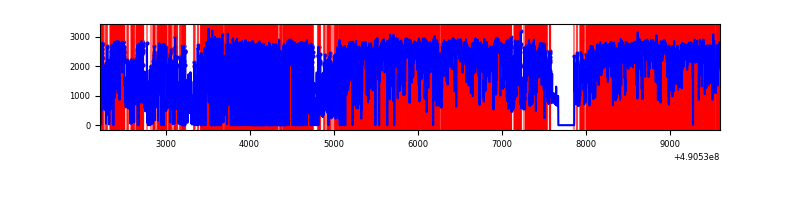 |
Top three noisy pixels from each quadrant. If the there are fewer than three noisy pixels in the level2.evt file, extra rows are filled as -1
| Pixel properties | Quadrant properties | ||||||
|---|---|---|---|---|---|---|---|
| Quadrant | DetID | PixID | Counts | Sigma | Mean | Median | Sigma |
| A | 9 | 191 | 12983093 | 234216.88 | 217 | 212 | 55.4 |
| A | 7 | 206 | 1009619 | 18210.15 | 217 | 212 | 55.4 |
| A | 0 | 8 | 342913 | 6182.48 | 217 | 212 | 55.4 |
| B | 10 | 44 | 271741 | 1783.52 | 714 | 691 | 152.0 |
| B | 10 | 247 | 147965 | 969.07 | 714 | 691 | 152.0 |
| B | 4 | 81 | 108654 | 710.4 | 714 | 691 | 152.0 |
| C | 1 | 241 | 3516682 | 21459.86 | 600 | 595 | 163.8 |
| C | 7 | 80 | 848803 | 5176.9 | 600 | 595 | 163.8 |
| C | 4 | 5 | 789811 | 4816.85 | 600 | 595 | 163.8 |
| D | 8 | 176 | 8369900 | 73843.44 | 390 | 372 | 113.3 |
| D | 12 | 17 | 2658031 | 23448.24 | 390 | 372 | 113.3 |
| D | 15 | 78 | 393271 | 3466.51 | 390 | 372 | 113.3 |
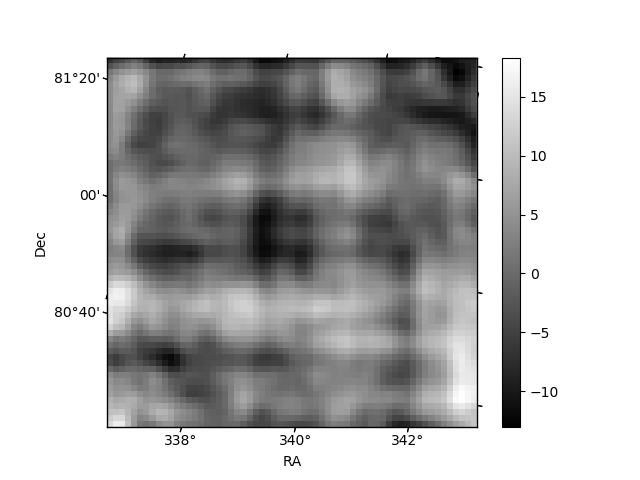
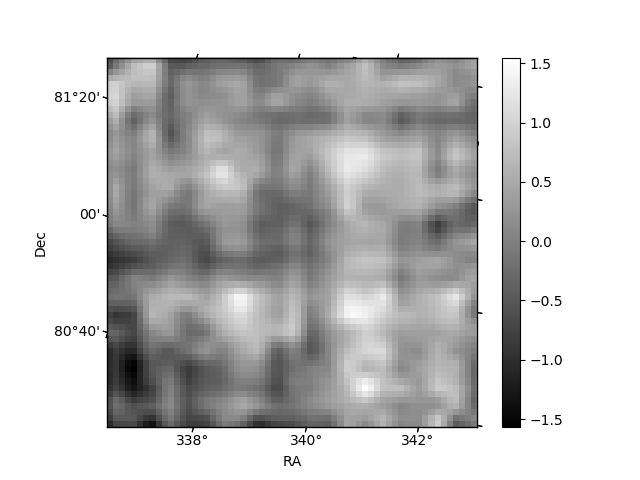
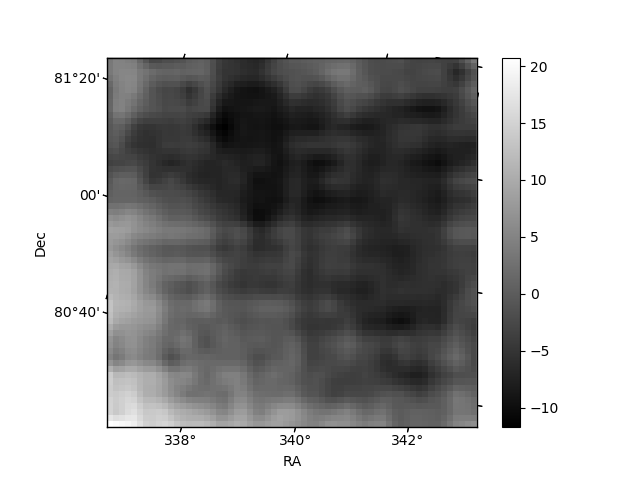
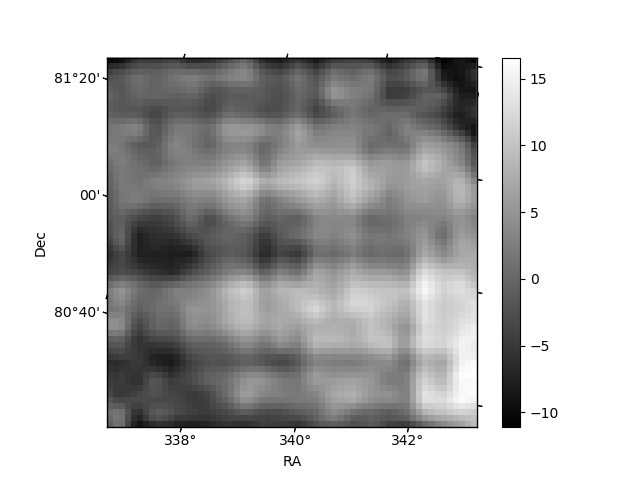
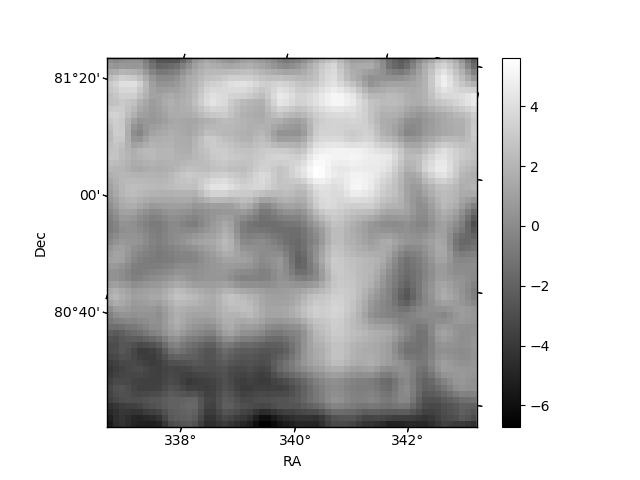
Histogram calculated using DETX and DETY for each event in the final _common_clean file
| Quadrant A | 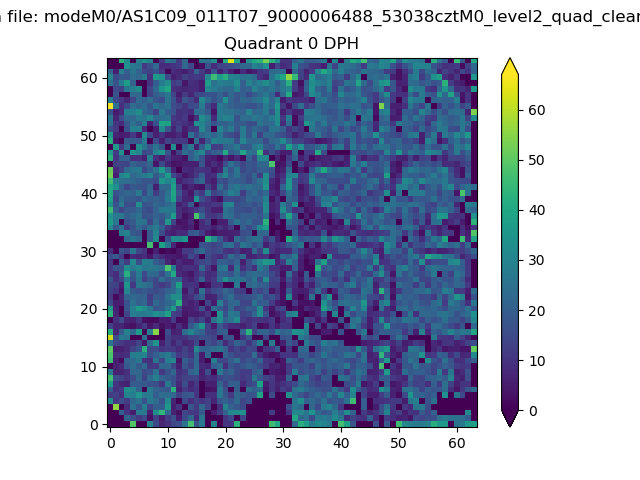 |
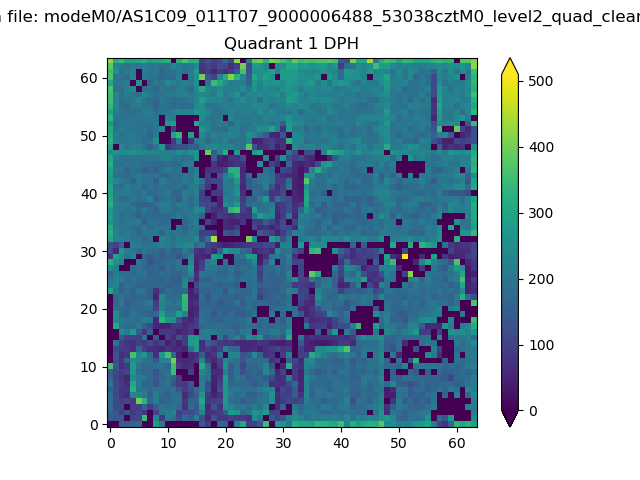 |
Quadrant B |
|---|---|---|---|
| Quadrant D | 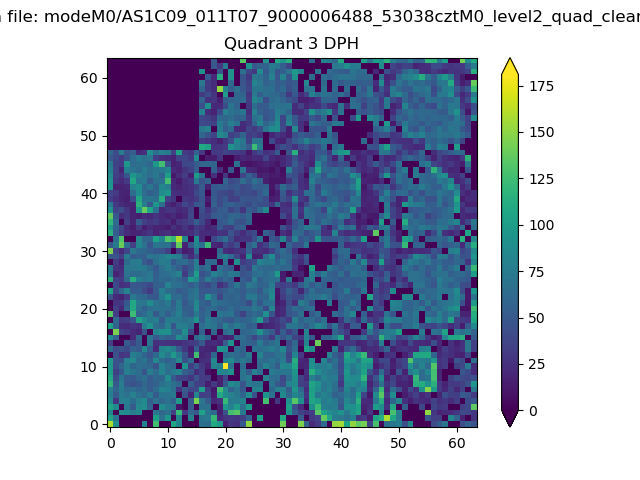 |
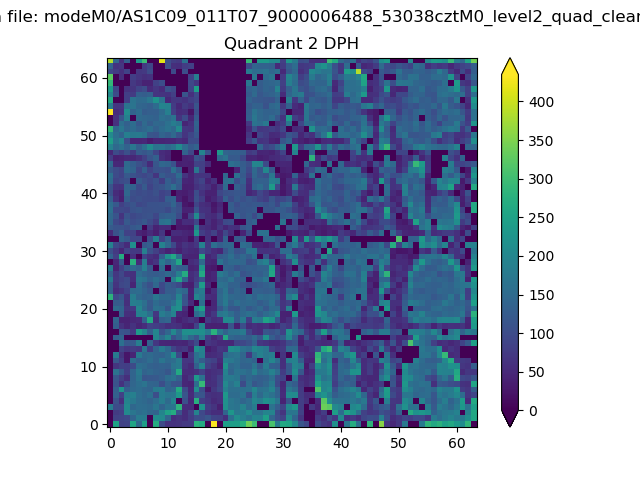 |
Quadrant C |
| Plot type | Count rate plots | Images |
|---|---|---|
| Comparison with Poisson distribution Blue bars denote a histogram of data divided into 1 sec bins. Red curve is a Poisson curve with rate = median count rate of data. |
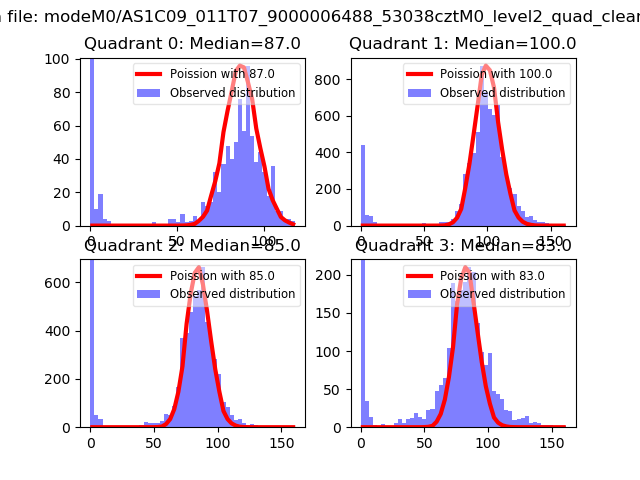 |
 |
| Quadrant-wise count rates Data is divided into 100 sec bins |
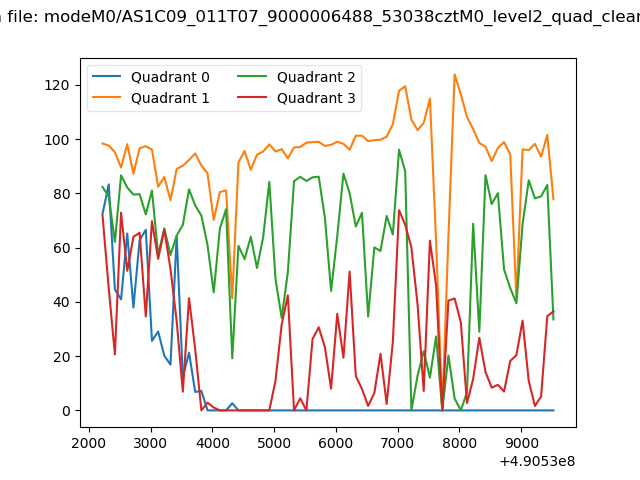 |
|
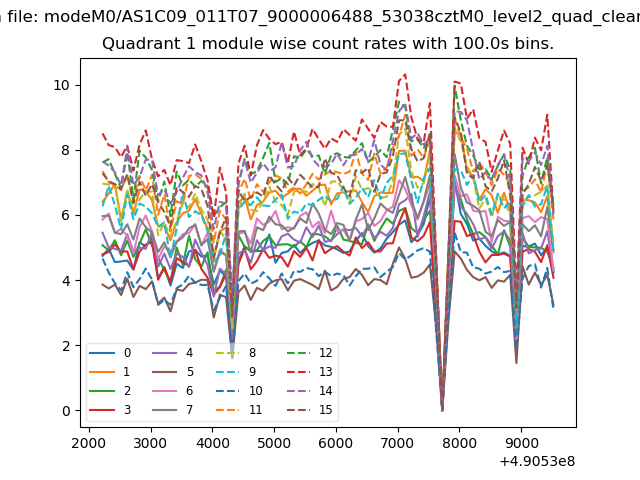
| Module-wise count rates for Quadrant A Data is divided into 100 sec bins |
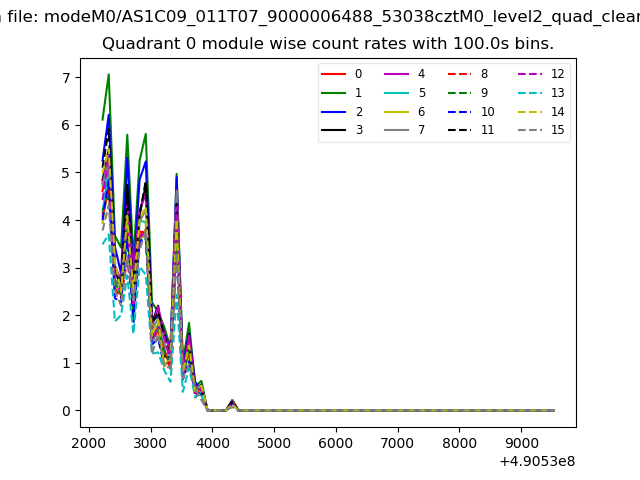 |
 |
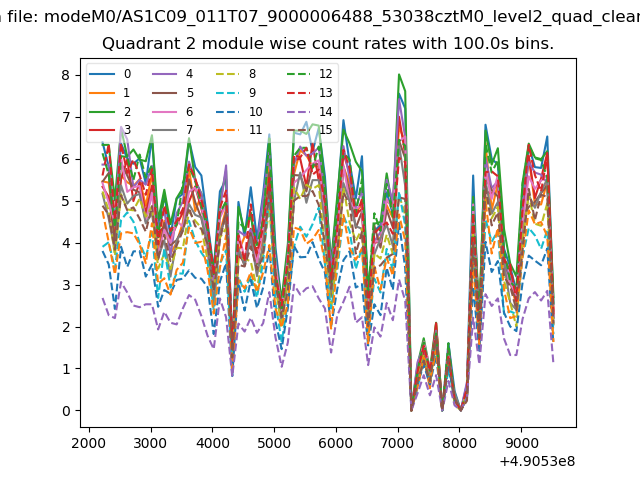
| Module-wise count rates for Quadrant B Data is divided into 100 sec bins |
 |
 |
| Module-wise count rates for Quadrant C Data is divided into 100 sec bins |
 |
 |
| Module-wise count rates for Quadrant D Data is divided into 100 sec bins |
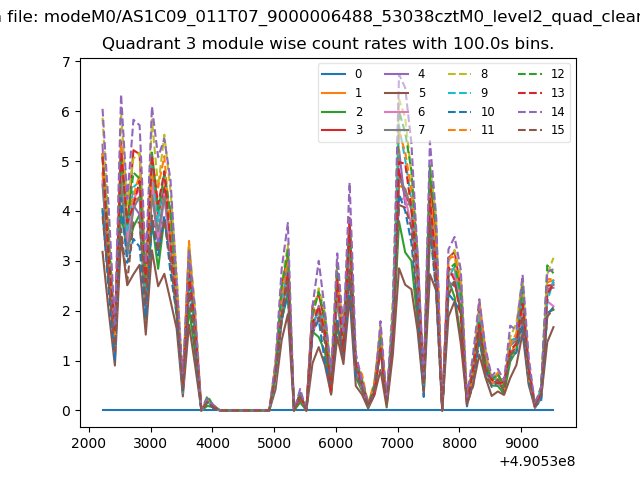 |
 |
| Parameter | Plot |
|---|---|
| CZT HV Monitor | 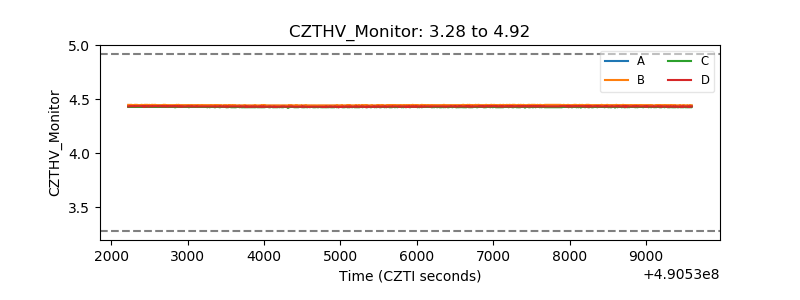 |
| D_VDD | 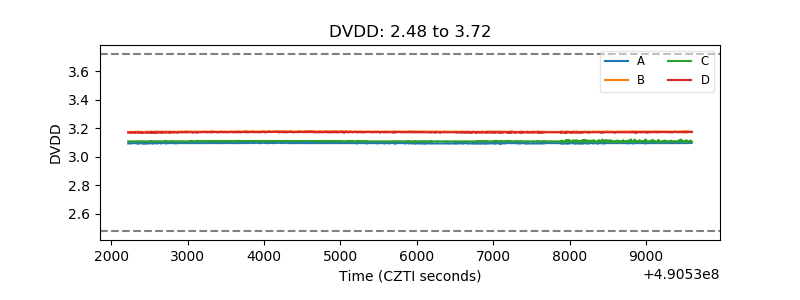 |
| Temperature 1 | 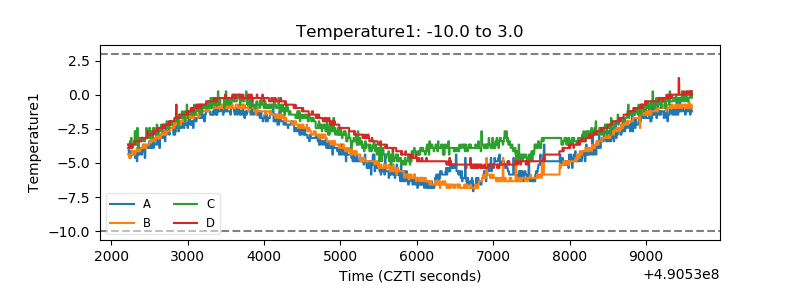 |
| Veto HV Monitor | 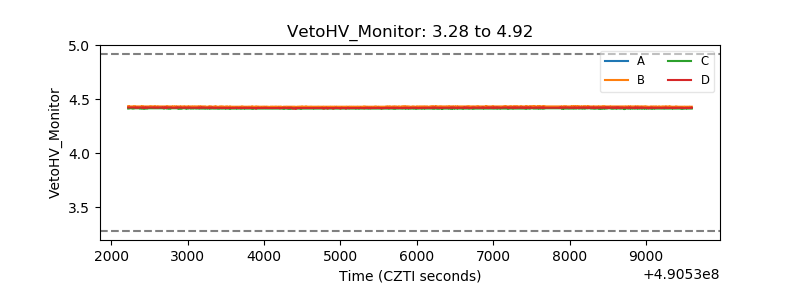 |
| Veto LLD | 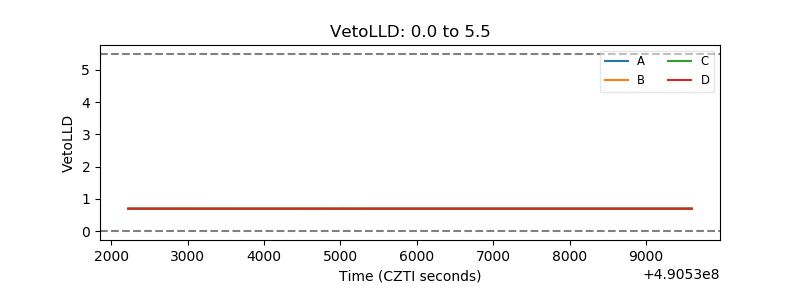 |
| Alpha Counter | 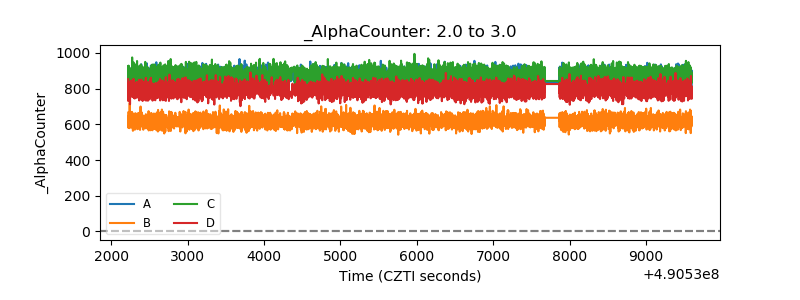 |
| _CPM_Rate | 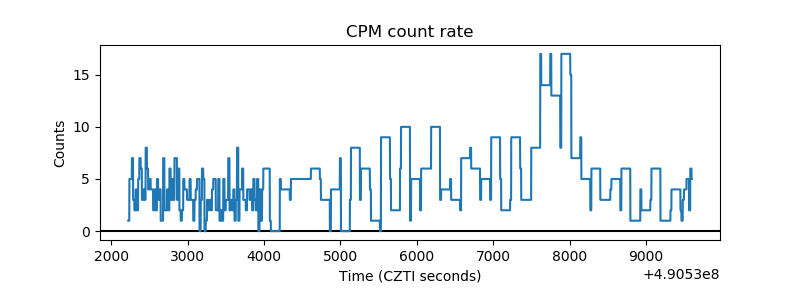 |
| CZT Counter | 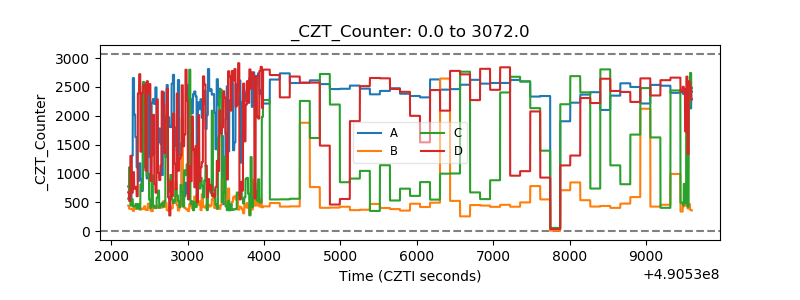 |
| +2.5 Volts monitor | 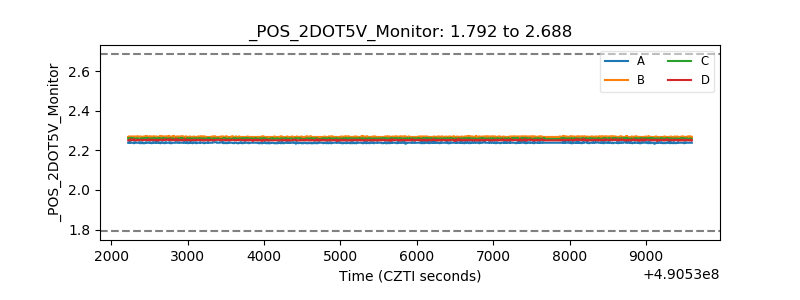 |
| +5 Volts monitor | 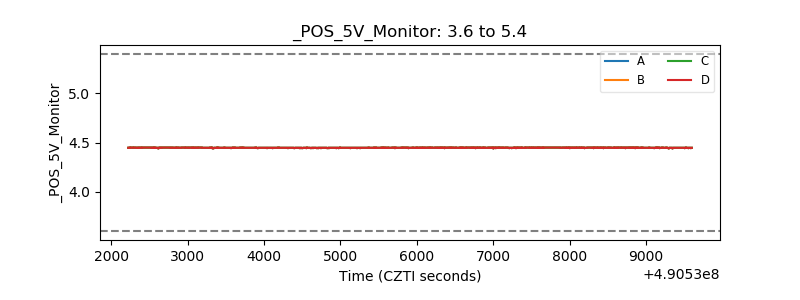 |
| _ROLL_ROT | 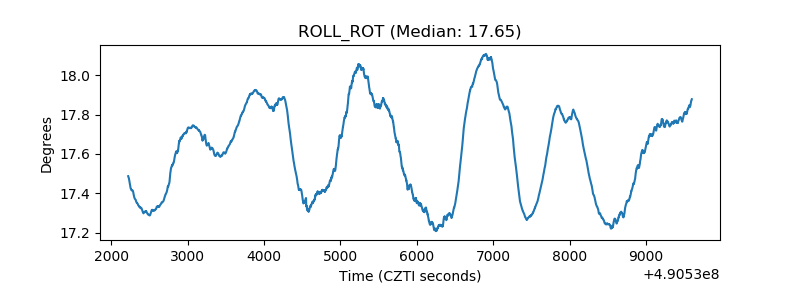 |
| _Roll_DEC | 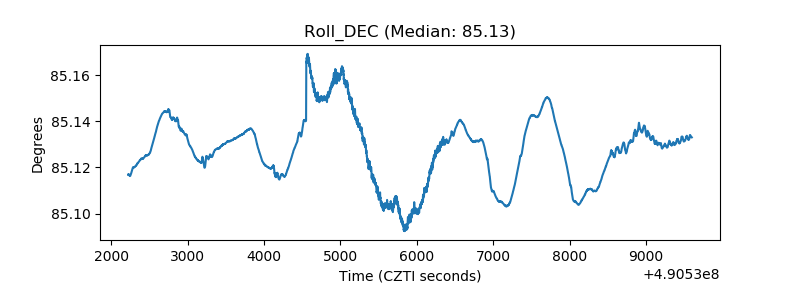 |
| _Roll_RA | 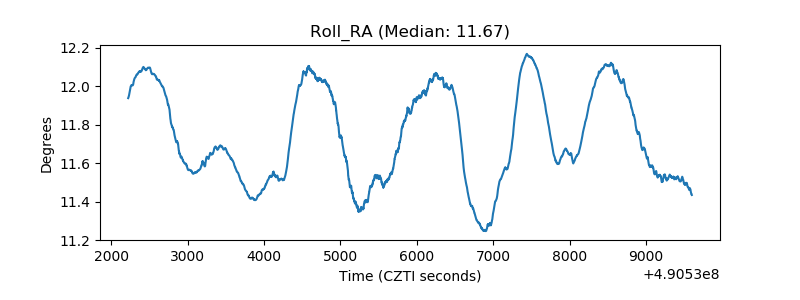 |
| Veto Counter | 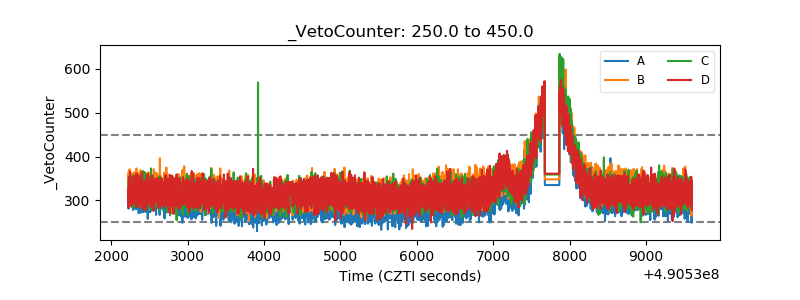 |