| Param | Original file | Final file |
|---|---|---|
| Filename | modeM0/AS1C09_011T07_9000006488_53039cztM0_level2.fits | modeM0/AS1C09_011T07_9000006488_53039cztM0_level2_quad_clean.evt |
| Size (bytes) | 1,185,071,040 | 73,615,680 |
| Size | 1.1 GB | 70.2 MB |
| Events in quadrant A | 16,968,187 | 65,376 |
| Events in quadrant B | 4,741,569 | 707,113 |
| Events in quadrant C | 10,967,002 | 509,878 |
| Events in quadrant D | 10,631,954 | 436,768 |
| Mode SS | |||
|---|---|---|---|
| Quadrant | BADHDUFLAG | Total packets | Discarded packets |
| A | 0 | 144 | 0 |
| B | 0 | 144 | 0 |
| C | 0 | 144 | 0 |
| D | 0 | 144 | 0 |
| Mode M0 | |||
|---|---|---|---|
| Quadrant | BADHDUFLAG | Total packets | Discarded packets |
| A | 0 | 55294 | 0 |
| B | 0 | 19335 | 0 |
| C | 0 | 37547 | 0 |
| D | 0 | 36494 | 0 |
| Quadrant | Total seconds | Saturated seconds | Saturation percentage |
|---|---|---|---|
| A | 7231 | 7231 | 100.000000% |
| B | 7232 | 469 | 6.485066% |
| C | 7230 | 2682 | 37.095436% |
| D | 7232 | 3105 | 42.934181% |
Noise dominated data is calculated using 1-second bins in cleaned event files. If a bin has >2000 counts, and if more than 50% of those come from <1% of pixels, then it is considered to be noise-dominated and hence unusable.
| Quadrant | # 1 sec bins | Bins with >0 counts | Bins with >2000 counts | High rate bins dominated by noise | Noise dominated (total time) | Noise dominated (detector-on time) | Marked lightcurve |
|---|---|---|---|---|---|---|---|
| A | 7230 | 7230 | 6886 | 6886 | 95.24% | 95.24% | 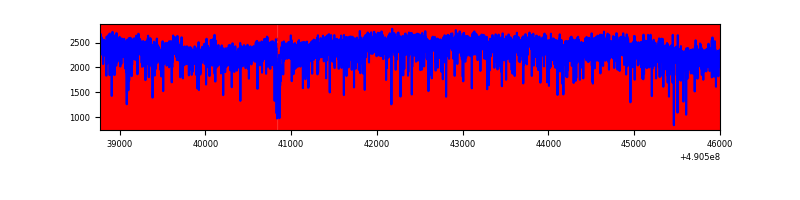 |
| B | 7232 | 7232 | 416 | 416 | 5.75% | 5.75% | 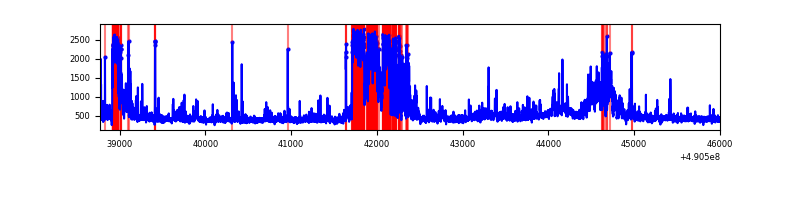 |
| C | 7232 | 7230 | 2738 | 2738 | 37.86% | 37.87% | 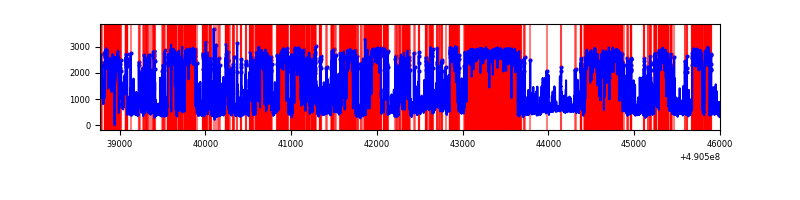 |
| D | 7232 | 7232 | 2810 | 2810 | 38.86% | 38.86% | 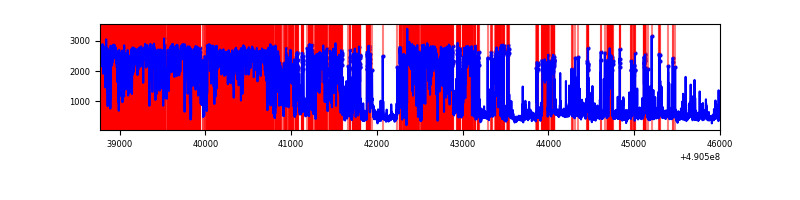 |
Top three noisy pixels from each quadrant. If the there are fewer than three noisy pixels in the level2.evt file, extra rows are filled as -1
| Pixel properties | Quadrant properties | ||||||
|---|---|---|---|---|---|---|---|
| Quadrant | DetID | PixID | Counts | Sigma | Mean | Median | Sigma |
| A | 9 | 191 | 15754572 | 629439.29 | 90 | 87 | 25.0 |
| A | 7 | 206 | 503101 | 20096.93 | 90 | 87 | 25.0 |
| A | 12 | 80 | 245907 | 9821.25 | 90 | 87 | 25.0 |
| B | 10 | 44 | 1071456 | 7004.81 | 725 | 701 | 152.9 |
| B | 7 | 0 | 336761 | 2198.48 | 725 | 701 | 152.9 |
| B | 4 | 81 | 135132 | 879.44 | 725 | 701 | 152.9 |
| C | 1 | 241 | 5705149 | 35098.39 | 587 | 584 | 162.5 |
| C | 7 | 80 | 1093993 | 6727.4 | 587 | 584 | 162.5 |
| C | 15 | 224 | 925075 | 5688.1 | 587 | 584 | 162.5 |
| D | 12 | 17 | 3933336 | 25259.57 | 535 | 510 | 155.7 |
| D | 8 | 176 | 3585747 | 23027.1 | 535 | 510 | 155.7 |
| D | 2 | 249 | 159738 | 1022.68 | 535 | 510 | 155.7 |
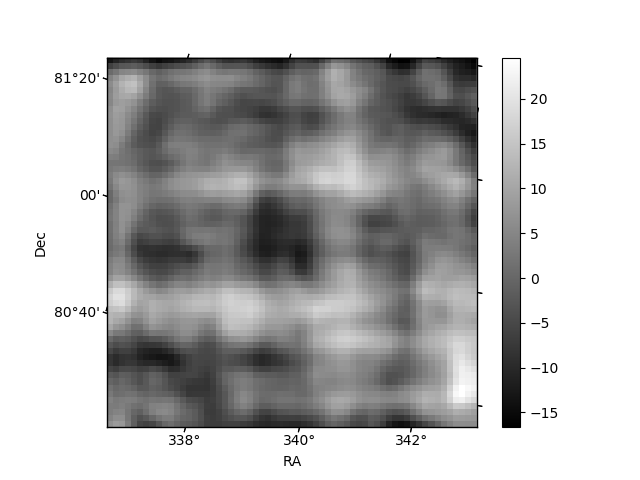
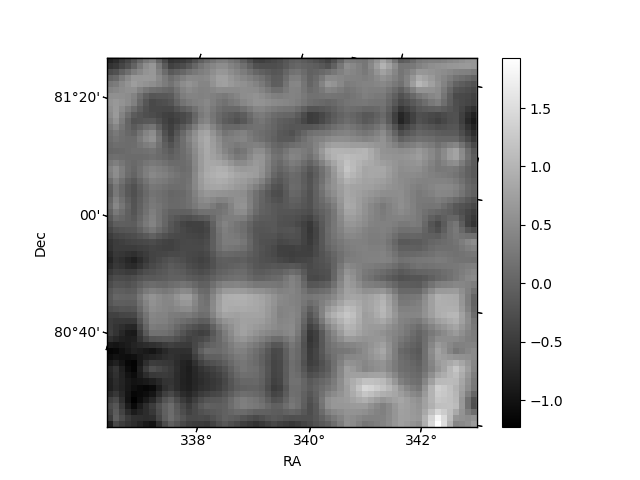
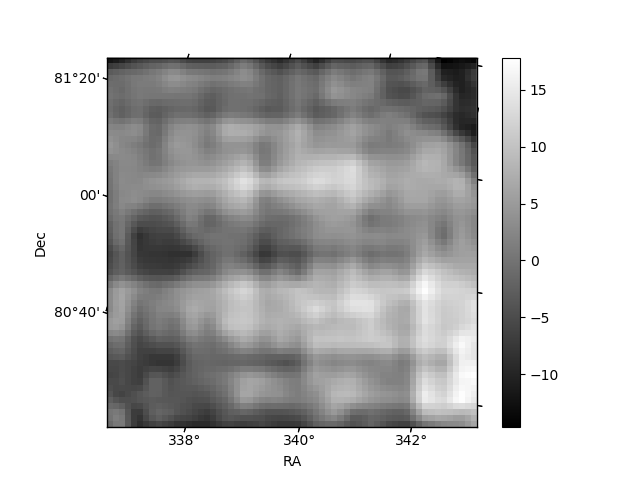
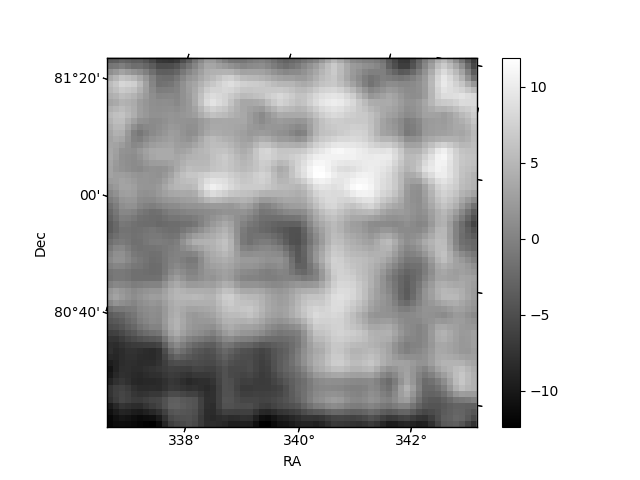
Histogram calculated using DETX and DETY for each event in the final _common_clean file
| Quadrant A | 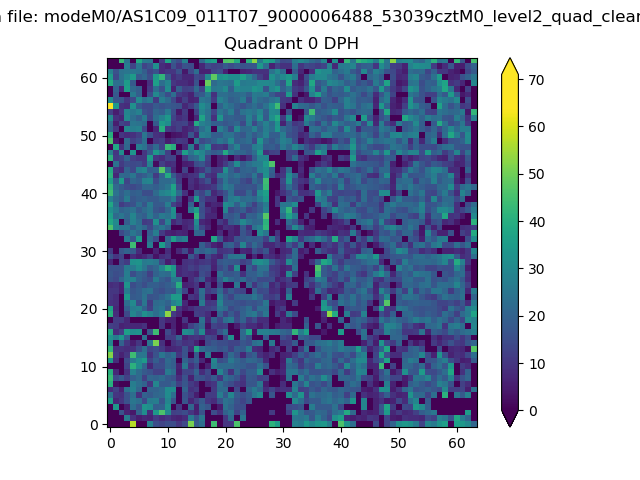 |
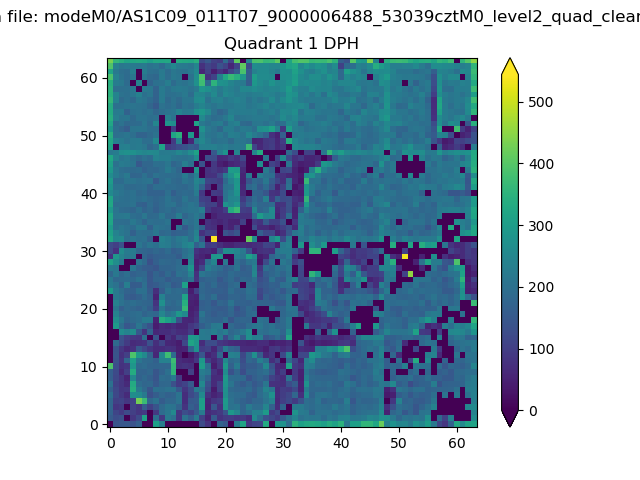 |
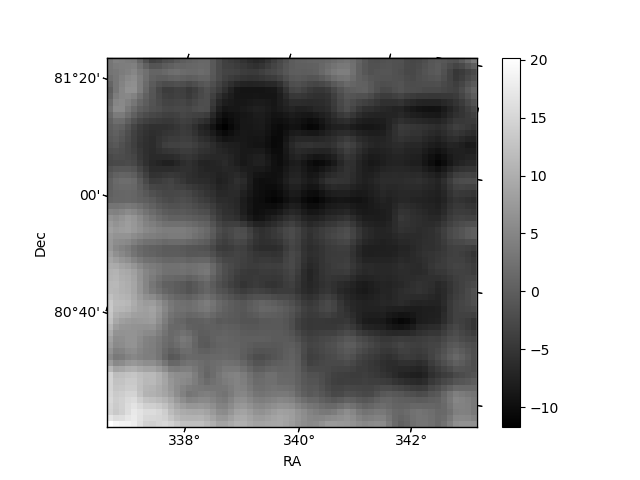
Quadrant B |
|---|---|---|---|
| Quadrant D | 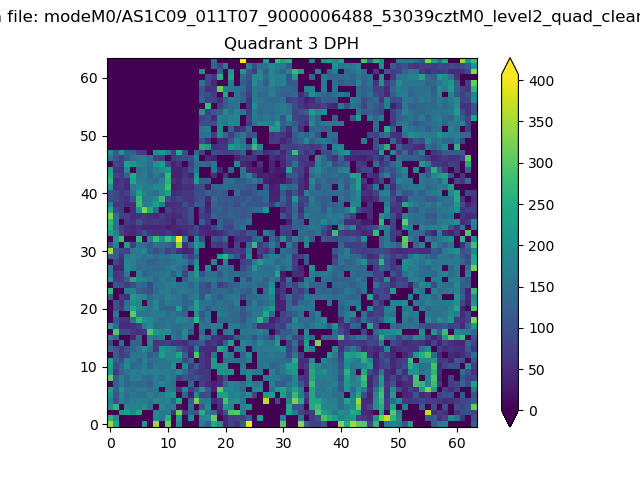 |
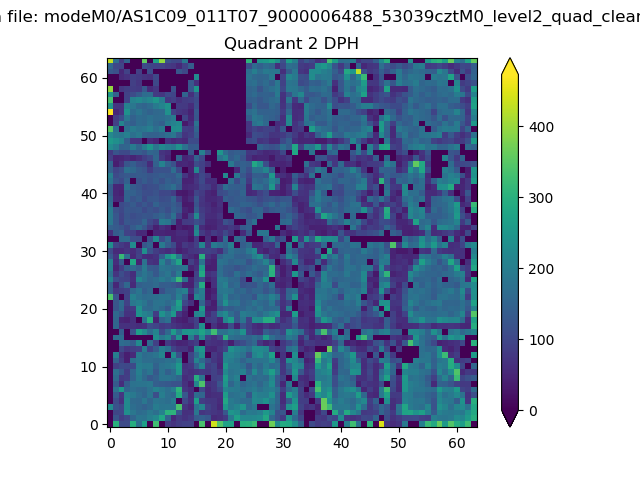 |
Quadrant C |
| Plot type | Count rate plots | Images |
|---|---|---|
| Comparison with Poisson distribution Blue bars denote a histogram of data divided into 1 sec bins. Red curve is a Poisson curve with rate = median count rate of data. |
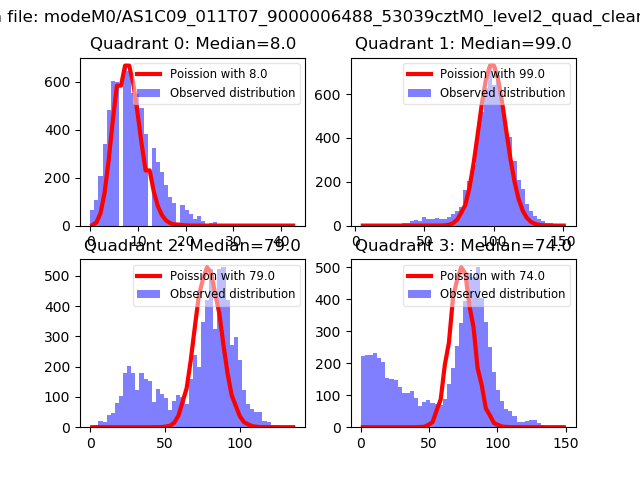 |
 |
| Quadrant-wise count rates Data is divided into 100 sec bins |
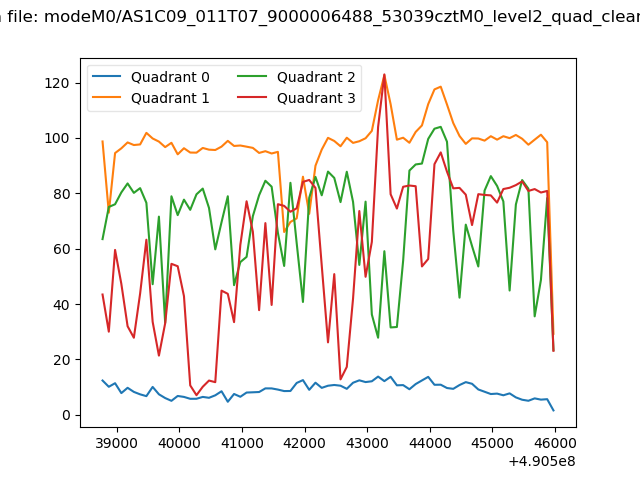 |
|
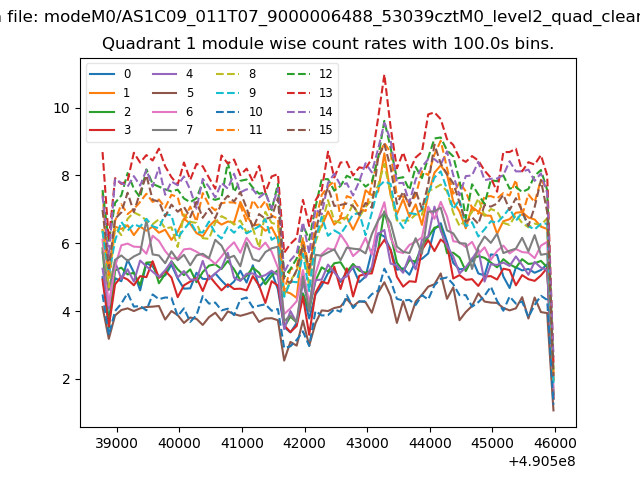
| Module-wise count rates for Quadrant A Data is divided into 100 sec bins |
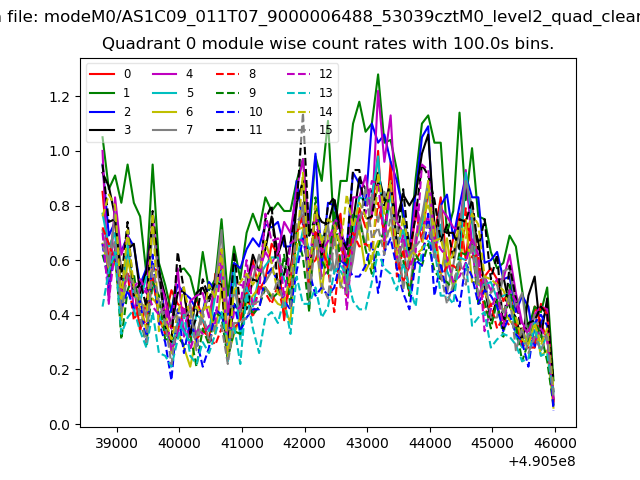 |
 |
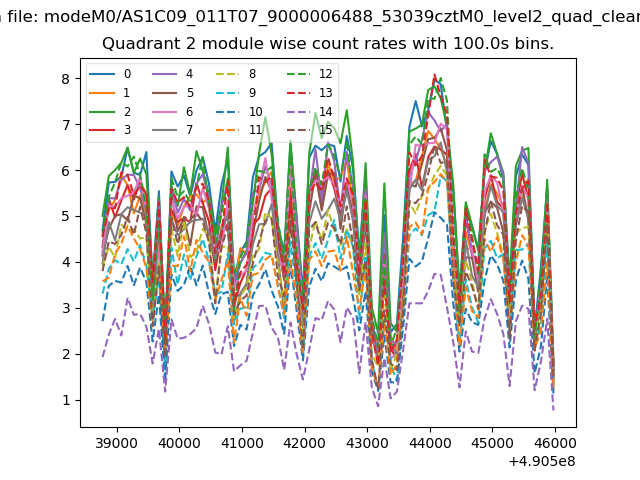
| Module-wise count rates for Quadrant B Data is divided into 100 sec bins |
 |
 |
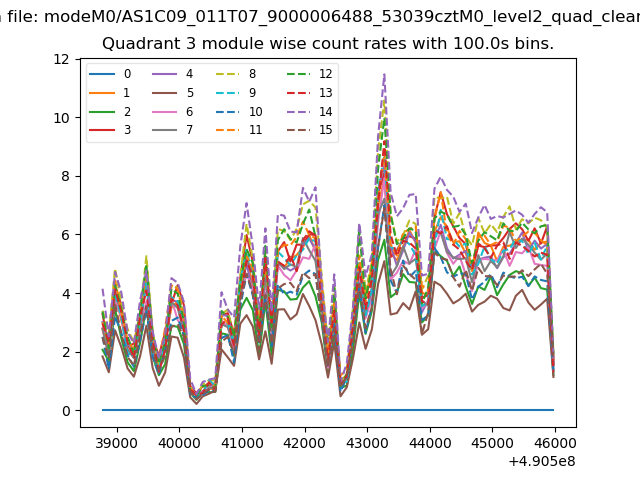
| Module-wise count rates for Quadrant C Data is divided into 100 sec bins |
 |
 |
| Module-wise count rates for Quadrant D Data is divided into 100 sec bins |
 |
 |
| Parameter | Plot |
|---|---|
| CZT HV Monitor | 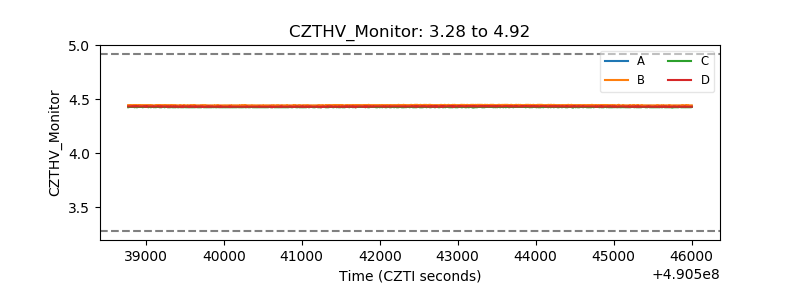 |
| D_VDD | 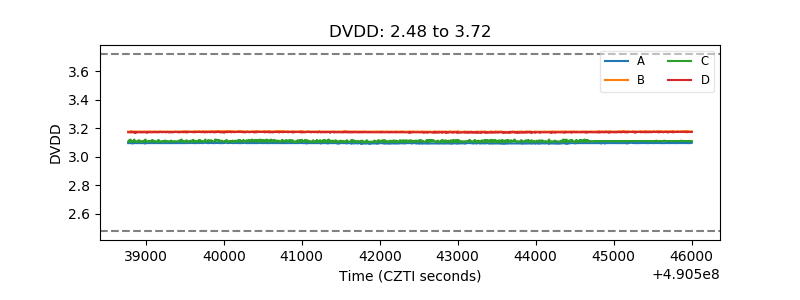 |
| Temperature 1 | 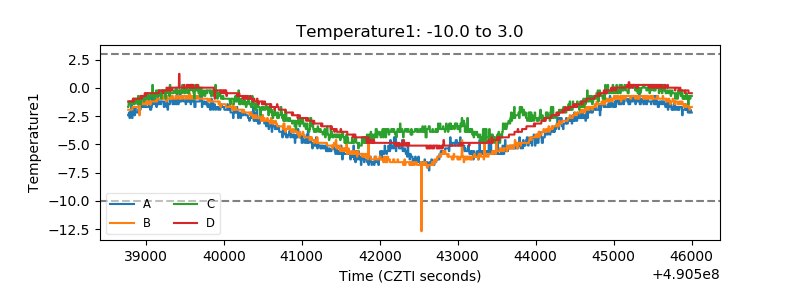 |
| Veto HV Monitor |  |
| Veto LLD | 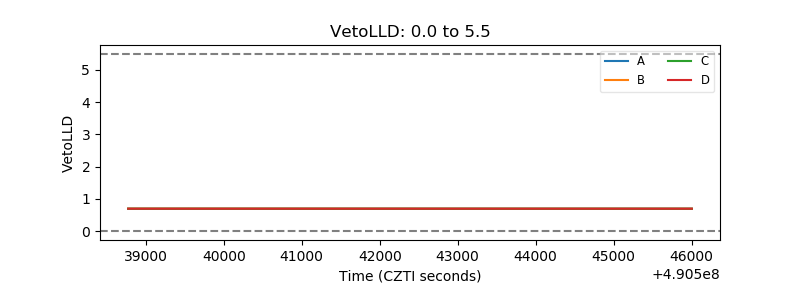 |
| Alpha Counter | 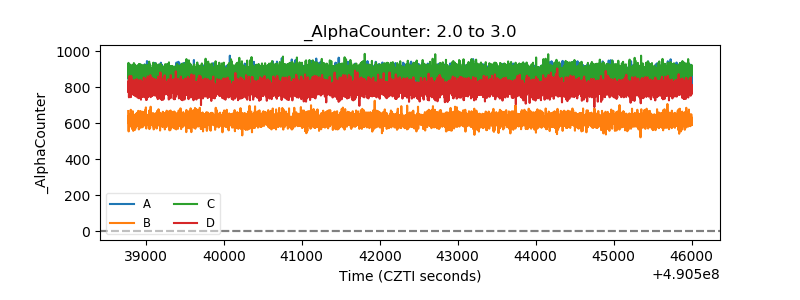 |
| _CPM_Rate | 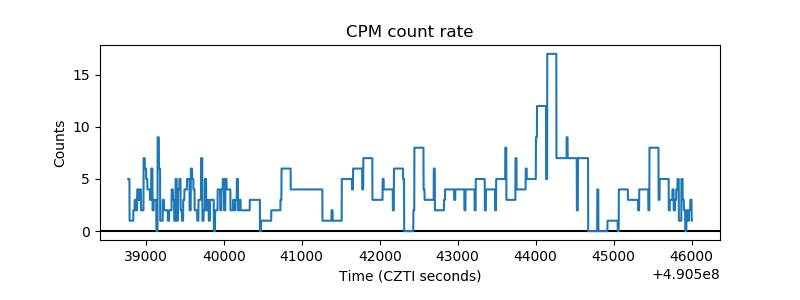 |
| CZT Counter | 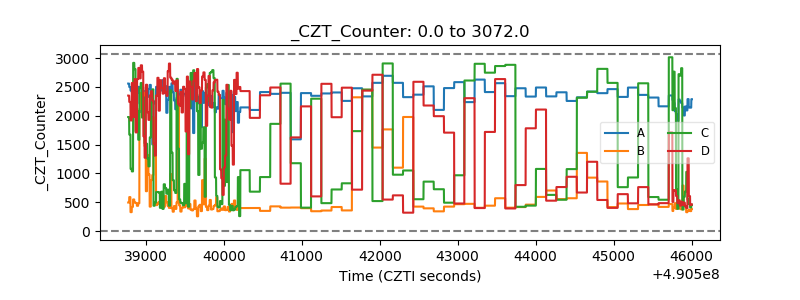 |
| +2.5 Volts monitor |  |
| +5 Volts monitor |  |
| _ROLL_ROT | 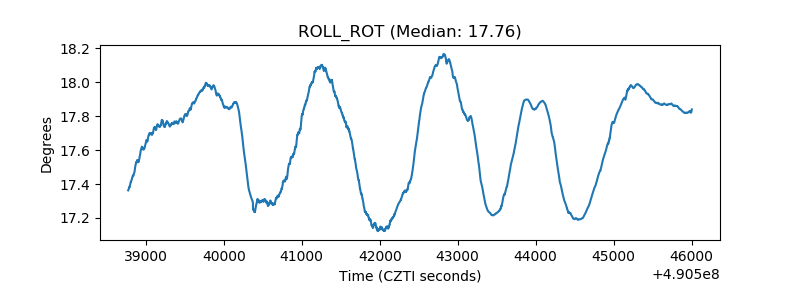 |
| _Roll_DEC | 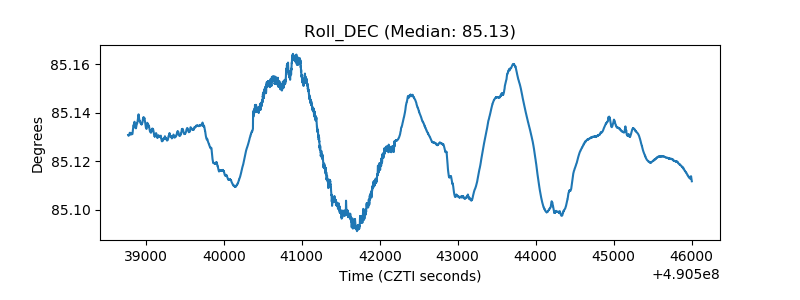 |
| _Roll_RA | 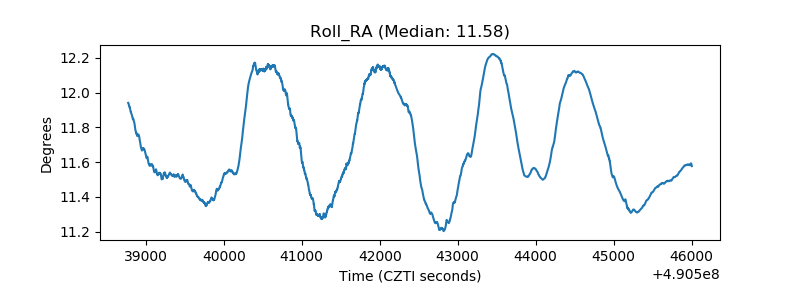 |
| Veto Counter | 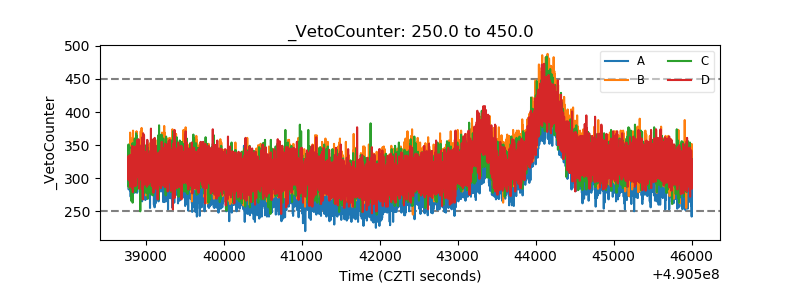 |