| Param | Original file | Final file |
|---|---|---|
| Filename | modeM0/AS1C09_011T07_9000006488_53040cztM0_level2.fits | modeM0/AS1C09_011T07_9000006488_53040cztM0_level2_quad_clean.evt |
| Size (bytes) | 1,036,702,080 | 74,246,400 |
| Size | 988.7 MB | 70.8 MB |
| Events in quadrant A | 15,993,414 | 70,489 |
| Events in quadrant B | 4,045,310 | 685,142 |
| Events in quadrant C | 9,871,823 | 500,303 |
| Events in quadrant D | 7,931,295 | 506,777 |
| Mode SS | |||
|---|---|---|---|
| Quadrant | BADHDUFLAG | Total packets | Discarded packets |
| A | 0 | 138 | 0 |
| B | 0 | 138 | 0 |
| C | 0 | 138 | 0 |
| D | 0 | 138 | 0 |
| Mode M0 | |||
|---|---|---|---|
| Quadrant | BADHDUFLAG | Total packets | Discarded packets |
| A | 0 | 52128 | 0 |
| B | 0 | 17090 | 0 |
| C | 0 | 34106 | 0 |
| D | 0 | 28255 | 0 |
| Quadrant | Total seconds | Saturated seconds | Saturation percentage |
|---|---|---|---|
| A | 6891 | 6891 | 100.000000% |
| B | 6892 | 149 | 2.161927% |
| C | 6892 | 2361 | 34.257110% |
| D | 6892 | 1509 | 21.894951% |
Noise dominated data is calculated using 1-second bins in cleaned event files. If a bin has >2000 counts, and if more than 50% of those come from <1% of pixels, then it is considered to be noise-dominated and hence unusable.
| Quadrant | # 1 sec bins | Bins with >0 counts | Bins with >2000 counts | High rate bins dominated by noise | Noise dominated (total time) | Noise dominated (detector-on time) | Marked lightcurve |
|---|---|---|---|---|---|---|---|
| A | 6890 | 6890 | 6411 | 6411 | 93.05% | 93.05% | 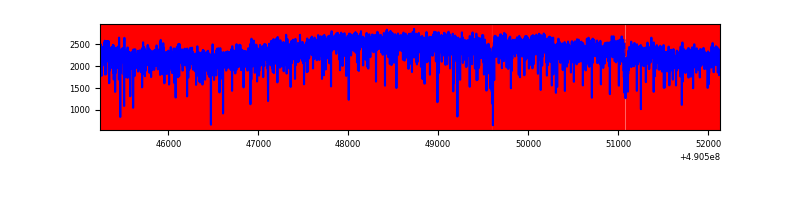 |
| B | 6892 | 6892 | 84 | 84 | 1.22% | 1.22% | 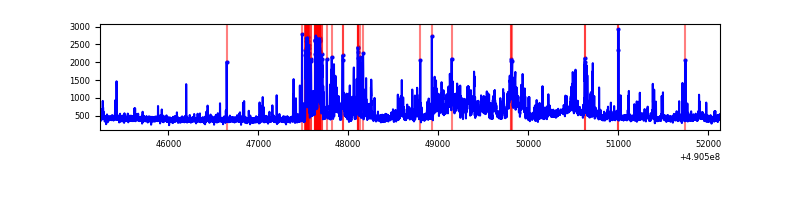 |
| C | 6892 | 6892 | 2385 | 2385 | 34.61% | 34.61% | 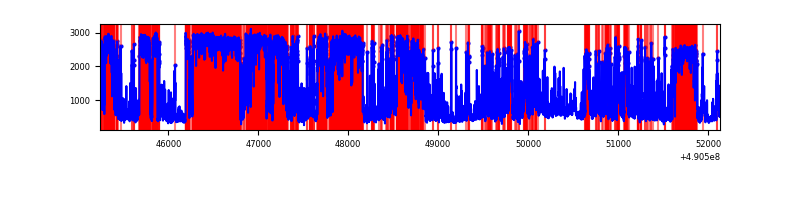 |
| D | 6892 | 6892 | 1386 | 1386 | 20.11% | 20.11% | 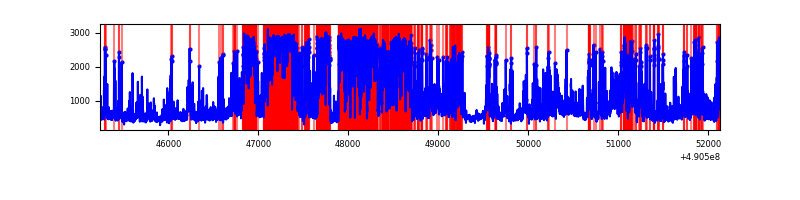 |
Top three noisy pixels from each quadrant. If the there are fewer than three noisy pixels in the level2.evt file, extra rows are filled as -1
| Pixel properties | Quadrant properties | ||||||
|---|---|---|---|---|---|---|---|
| Quadrant | DetID | PixID | Counts | Sigma | Mean | Median | Sigma |
| A | 9 | 191 | 14599179 | 567552.79 | 94 | 91 | 25.7 |
| A | 12 | 80 | 574616 | 22335.18 | 94 | 91 | 25.7 |
| A | 7 | 206 | 340016 | 13214.89 | 94 | 91 | 25.7 |
| B | 4 | 81 | 470711 | 3138.14 | 709 | 684 | 149.8 |
| B | 10 | 44 | 275301 | 1833.48 | 709 | 684 | 149.8 |
| B | 10 | 254 | 232379 | 1546.91 | 709 | 684 | 149.8 |
| C | 1 | 241 | 4814233 | 30457.33 | 582 | 577 | 158.0 |
| C | 15 | 224 | 931710 | 5891.54 | 582 | 577 | 158.0 |
| C | 15 | 147 | 582146 | 3679.75 | 582 | 577 | 158.0 |
| D | 8 | 176 | 3112168 | 17362.6 | 623 | 594 | 179.2 |
| D | 12 | 17 | 1099539 | 6132.12 | 623 | 594 | 179.2 |
| D | 15 | 78 | 278690 | 1551.77 | 623 | 594 | 179.2 |
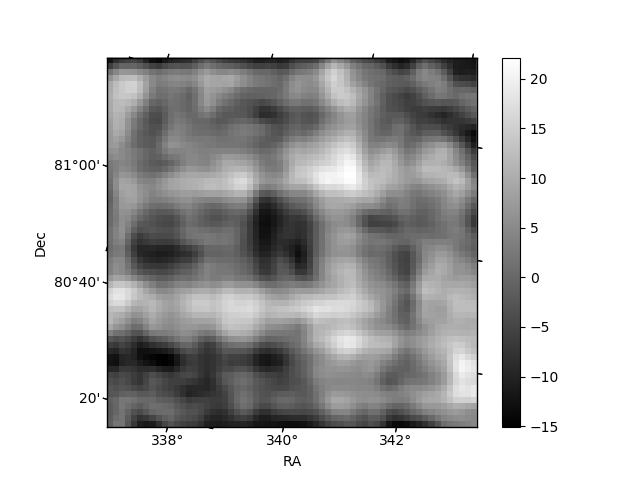
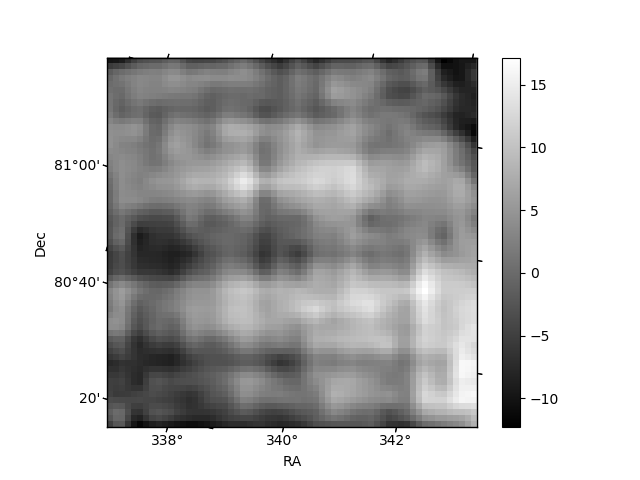
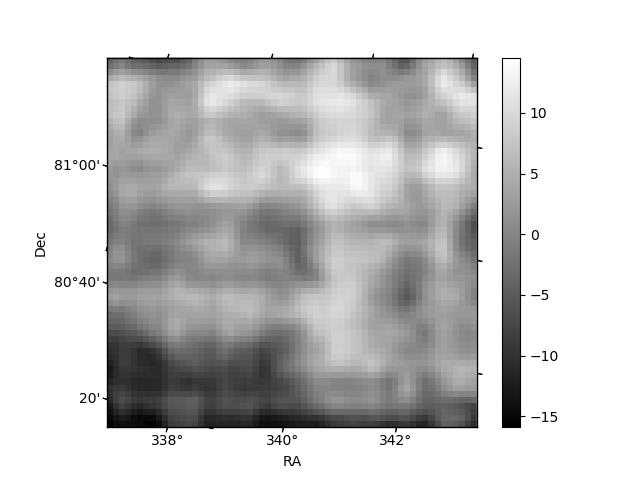
Histogram calculated using DETX and DETY for each event in the final _common_clean file
| Quadrant A | 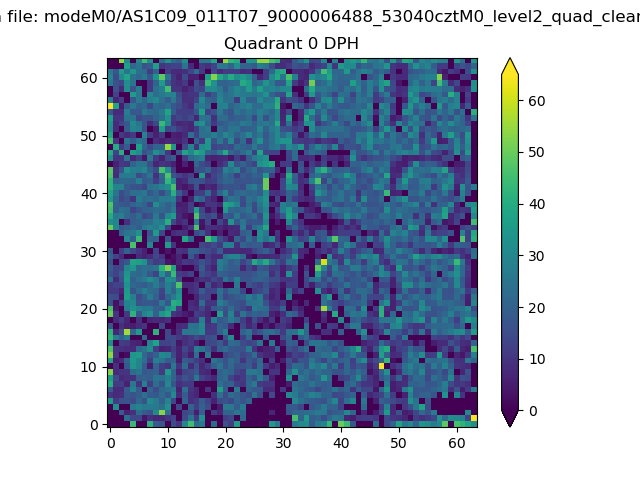 |
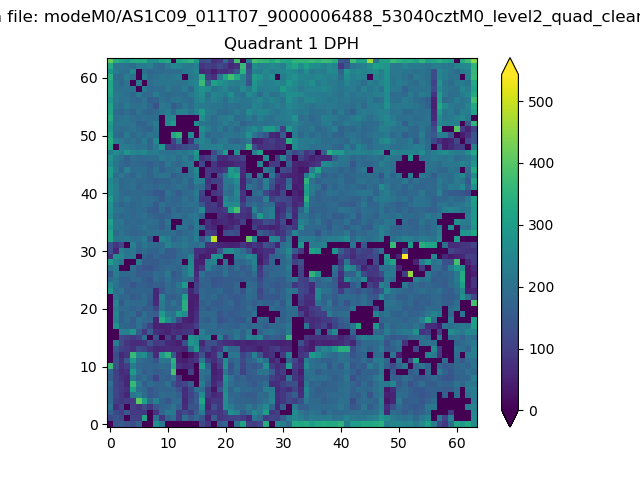 |
Quadrant B |
|---|---|---|---|
| Quadrant D | 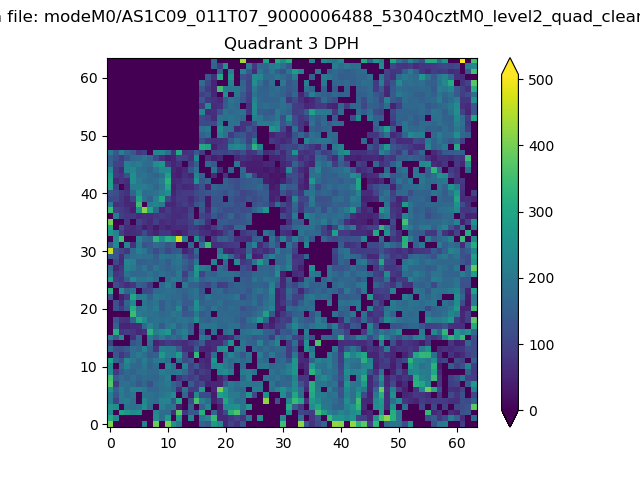 |
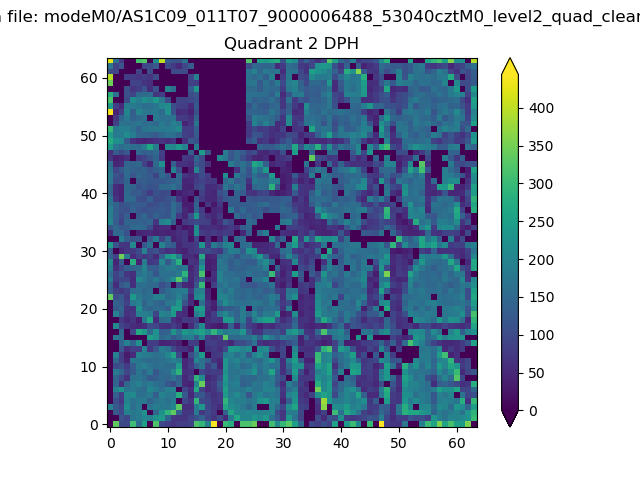 |
Quadrant C |
| Plot type | Count rate plots | Images |
|---|---|---|
| Comparison with Poisson distribution Blue bars denote a histogram of data divided into 1 sec bins. Red curve is a Poisson curve with rate = median count rate of data. |
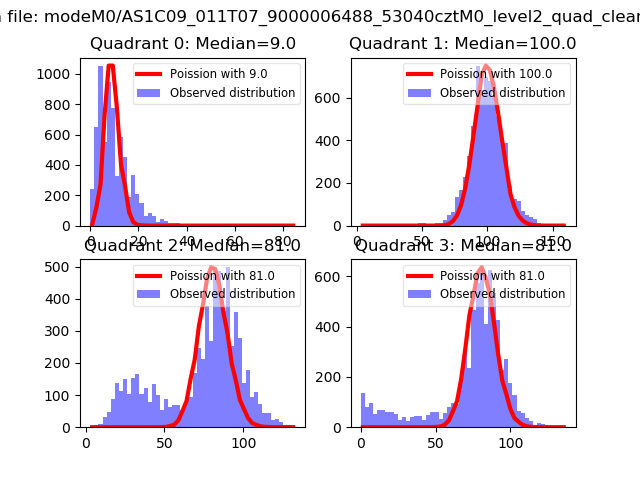 |
 |
| Quadrant-wise count rates Data is divided into 100 sec bins |
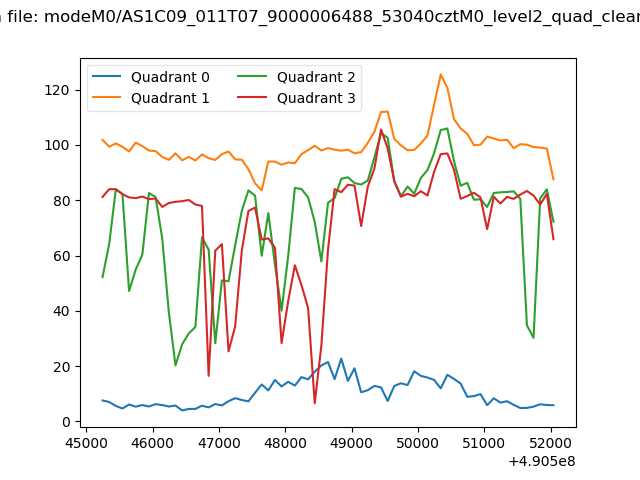 |
|
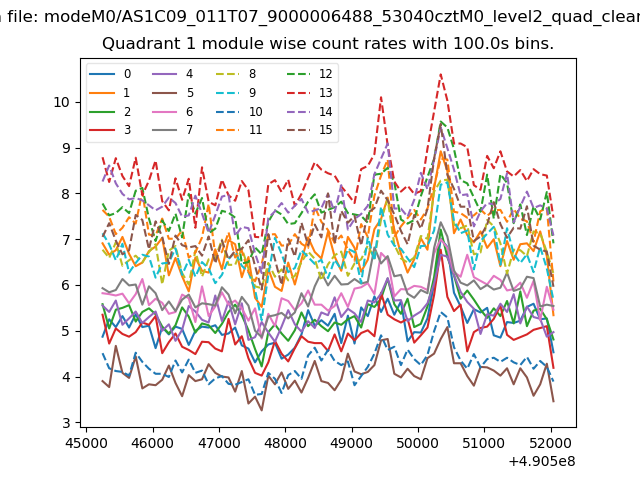
| Module-wise count rates for Quadrant A Data is divided into 100 sec bins |
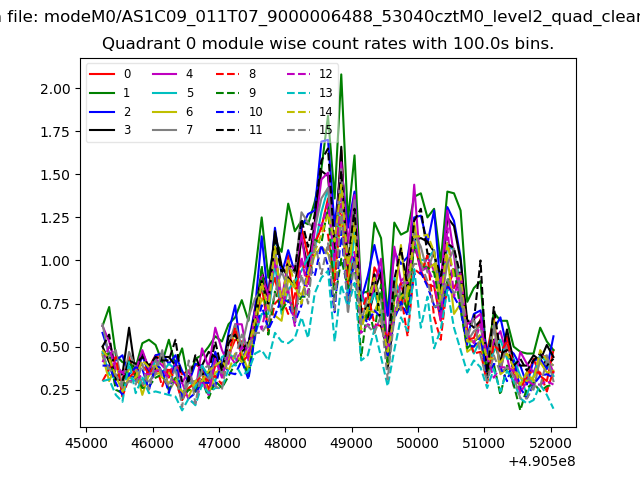 |
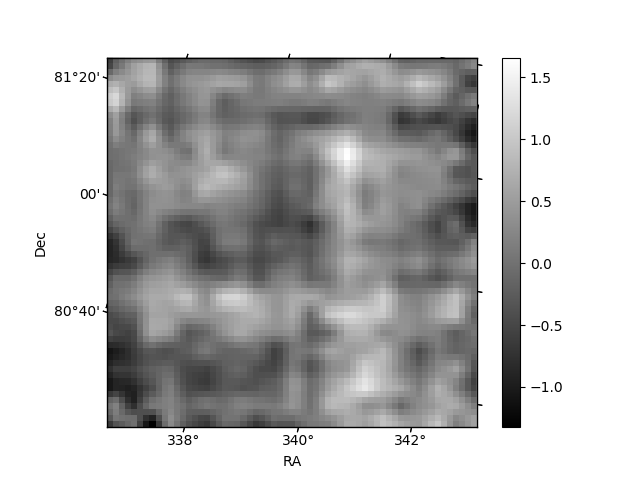 |
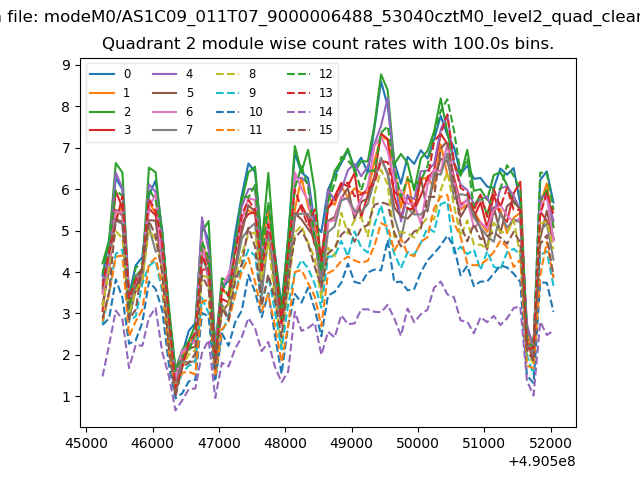
| Module-wise count rates for Quadrant B Data is divided into 100 sec bins |
 |
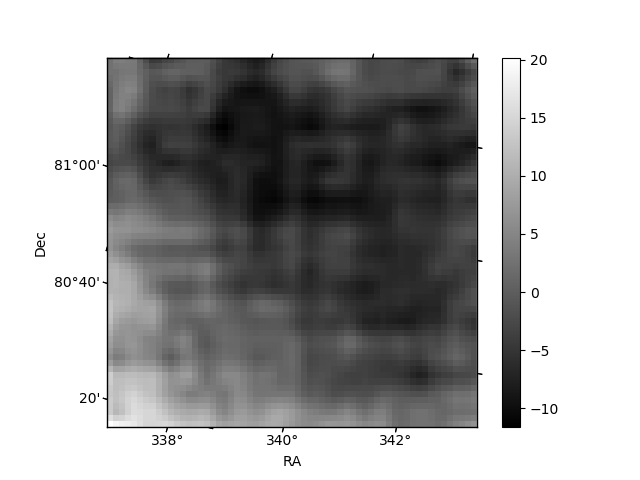 |
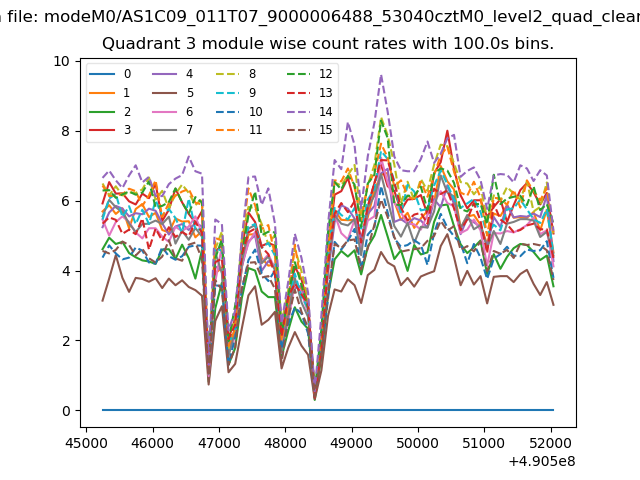
| Module-wise count rates for Quadrant C Data is divided into 100 sec bins |
 |
 |
| Module-wise count rates for Quadrant D Data is divided into 100 sec bins |
 |
 |
| Parameter | Plot |
|---|---|
| CZT HV Monitor | 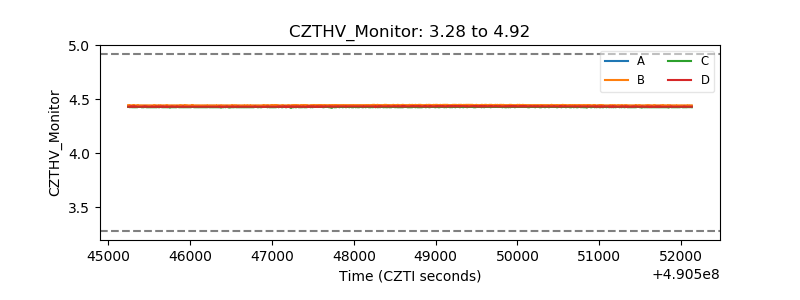 |
| D_VDD | 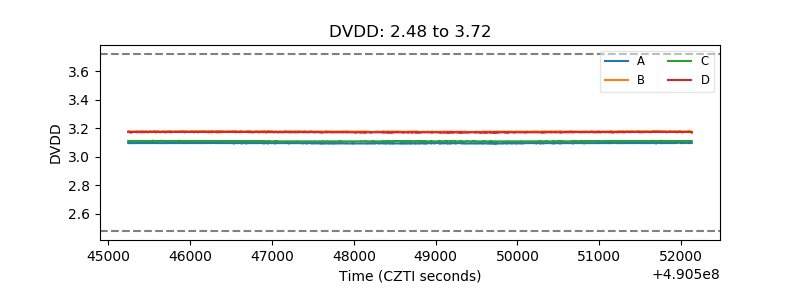 |
| Temperature 1 |  |
| Veto HV Monitor | 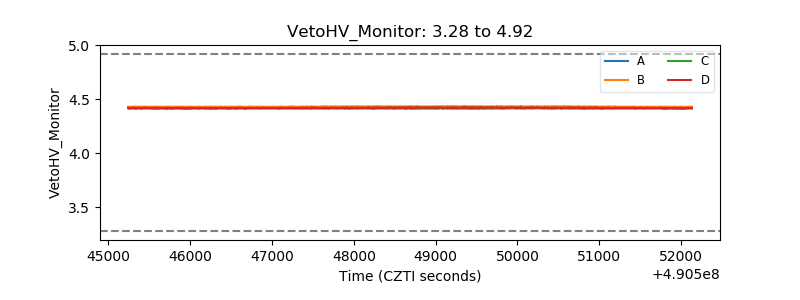 |
| Veto LLD | 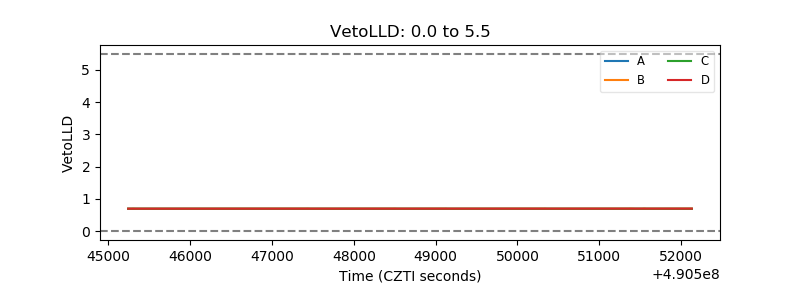 |
| Alpha Counter |  |
| _CPM_Rate | 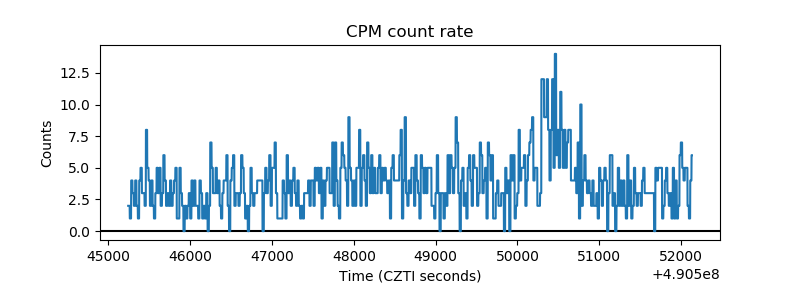 |
| CZT Counter | 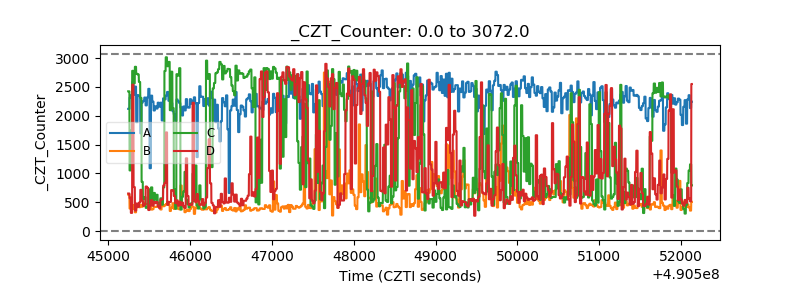 |
| +2.5 Volts monitor |  |
| +5 Volts monitor |  |
| _ROLL_ROT | 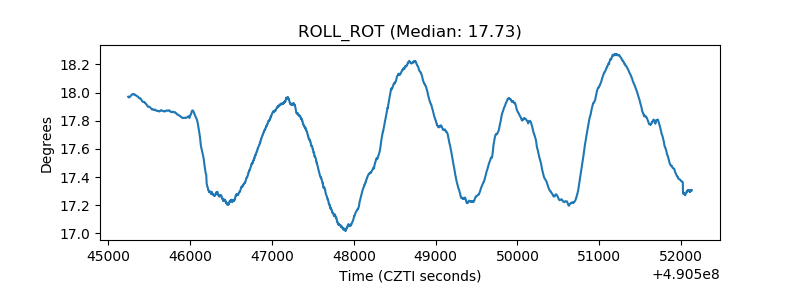 |
| _Roll_DEC | 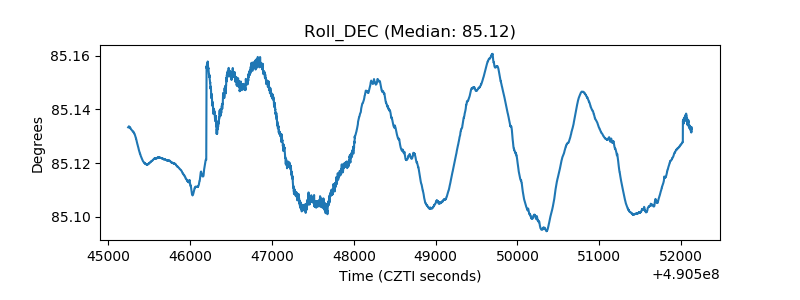 |
| _Roll_RA | 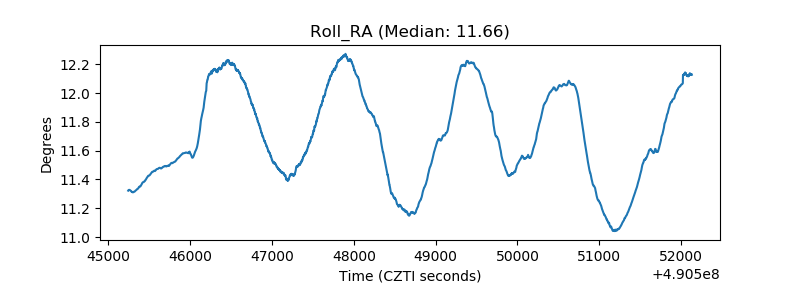 |
| Veto Counter | 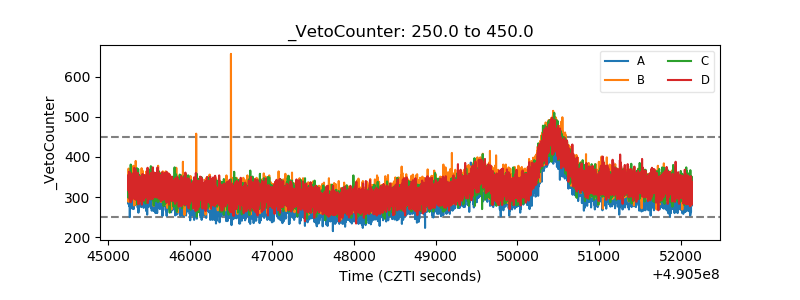 |