| Param | Original file | Final file |
|---|---|---|
| Filename | modeM0/AS1C09_011T07_9000006488_53043cztM0_level2.fits | modeM0/AS1C09_011T07_9000006488_53043cztM0_level2_quad_clean.evt |
| Size (bytes) | 2,203,217,280 | 213,926,400 |
| Size | 2.1 GB | 204.0 MB |
| Events in quadrant A | 35,678,153 | 693,809 |
| Events in quadrant B | 9,944,854 | 1,714,532 |
| Events in quadrant C | 14,385,705 | 1,526,738 |
| Events in quadrant D | 20,143,553 | 1,285,548 |
| Mode SS | |||
|---|---|---|---|
| Quadrant | BADHDUFLAG | Total packets | Discarded packets |
| A | 0 | 368 | 0 |
| B | 0 | 368 | 0 |
| C | 0 | 368 | 0 |
| D | 0 | 368 | 0 |
| Mode M9 | |||
|---|---|---|---|
| Quadrant | BADHDUFLAG | Total packets | Discarded packets |
| A | 0 | 15 | 0 |
| B | 0 | 15 | 0 |
| C | 0 | 15 | 0 |
| D | 0 | 15 | 0 |
| Mode M0 | |||
|---|---|---|---|
| Quadrant | BADHDUFLAG | Total packets | Discarded packets |
| A | 0 | 118404 | 3 |
| B | 0 | 42590 | 1 |
| C | 0 | 55594 | 5 |
| D | 0 | 72712 | 1 |
| Quadrant | Total seconds | Saturated seconds | Saturation percentage |
|---|---|---|---|
| A | 18212 | 11497 | 63.128706% |
| B | 18213 | 430 | 2.360951% |
| C | 18211 | 1266 | 6.951842% |
| D | 18213 | 3264 | 17.921265% |
Noise dominated data is calculated using 1-second bins in cleaned event files. If a bin has >2000 counts, and if more than 50% of those come from <1% of pixels, then it is considered to be noise-dominated and hence unusable.
| Quadrant | # 1 sec bins | Bins with >0 counts | Bins with >2000 counts | High rate bins dominated by noise | Noise dominated (total time) | Noise dominated (detector-on time) | Marked lightcurve |
|---|---|---|---|---|---|---|---|
| A | 19691 | 18211 | 11251 | 11251 | 57.14% | 61.78% | 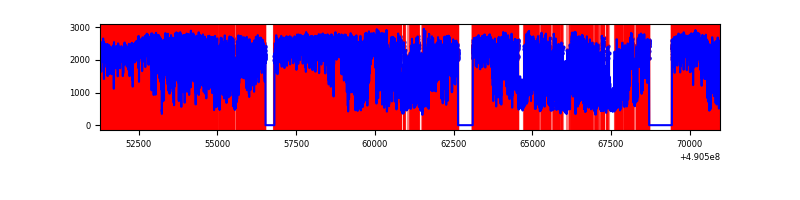 |
| B | 19692 | 18213 | 299 | 299 | 1.52% | 1.64% | 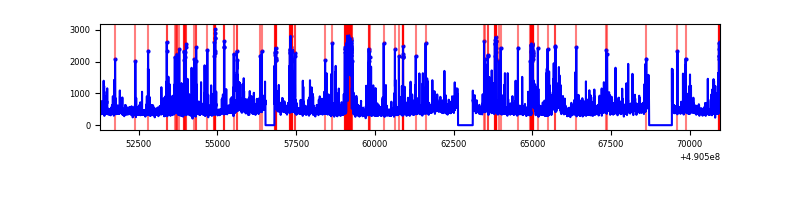 |
| C | 19692 | 18213 | 1125 | 1125 | 5.71% | 6.18% | 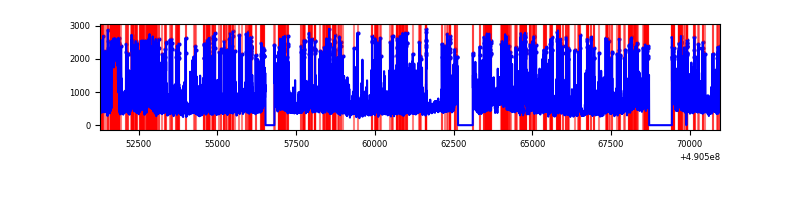 |
| D | 19692 | 18213 | 3129 | 3129 | 15.89% | 17.18% | 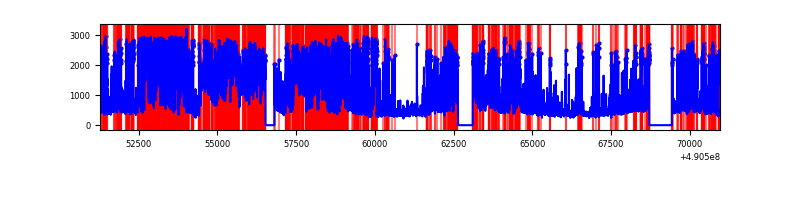 |
Top three noisy pixels from each quadrant. If the there are fewer than three noisy pixels in the level2.evt file, extra rows are filled as -1
| Pixel properties | Quadrant properties | ||||||
|---|---|---|---|---|---|---|---|
| Quadrant | DetID | PixID | Counts | Sigma | Mean | Median | Sigma |
| A | 9 | 191 | 23798093 | 75715.68 | 1253 | 1223 | 314.3 |
| A | 7 | 206 | 4581594 | 14573.59 | 1253 | 1223 | 314.3 |
| A | 0 | 8 | 971045 | 3085.73 | 1253 | 1223 | 314.3 |
| B | 4 | 81 | 613243 | 1552.65 | 1861 | 1796 | 393.8 |
| B | 10 | 44 | 536303 | 1357.28 | 1861 | 1796 | 393.8 |
| B | 10 | 63 | 357983 | 904.47 | 1861 | 1796 | 393.8 |
| C | 15 | 224 | 2683640 | 5448.06 | 1797 | 1779 | 492.3 |
| C | 7 | 80 | 1189004 | 2411.78 | 1797 | 1779 | 492.3 |
| C | 15 | 147 | 818625 | 1659.38 | 1797 | 1779 | 492.3 |
| D | 8 | 176 | 4073019 | 8168.33 | 1723 | 1641 | 498.4 |
| D | 12 | 17 | 3121882 | 6260.08 | 1723 | 1641 | 498.4 |
| D | 2 | 172 | 2334851 | 4681.08 | 1723 | 1641 | 498.4 |
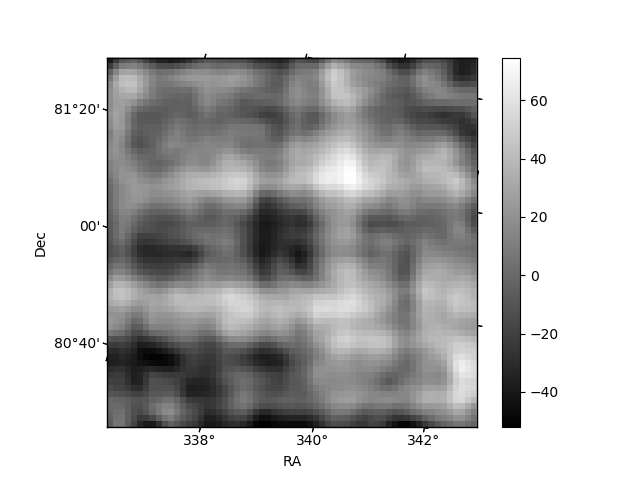
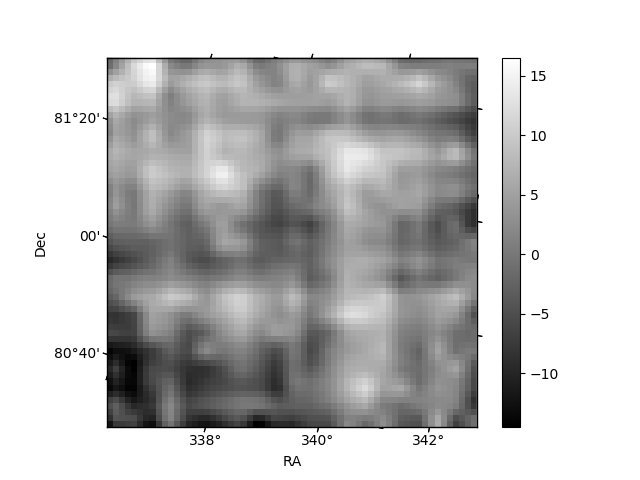
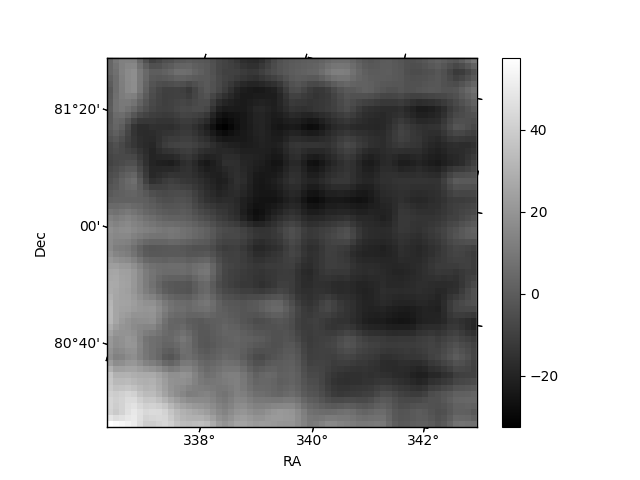
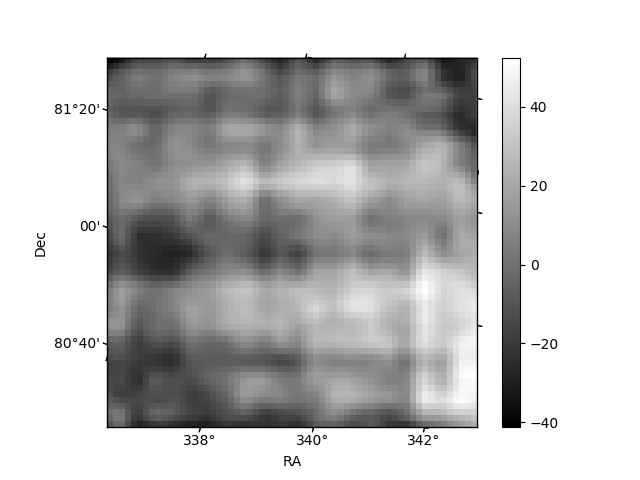
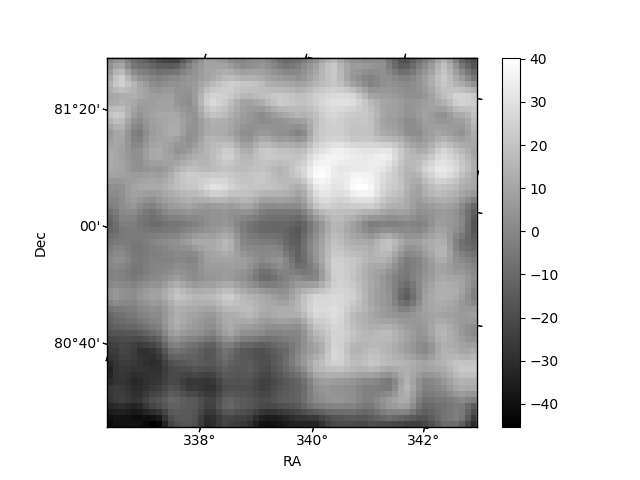
Histogram calculated using DETX and DETY for each event in the final _common_clean file
| Quadrant A | 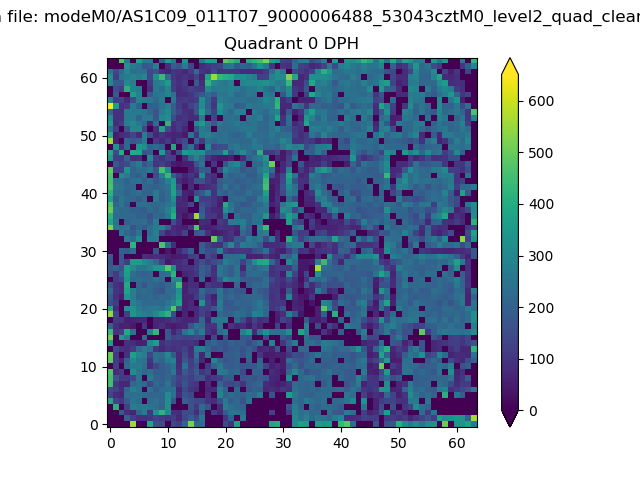 |
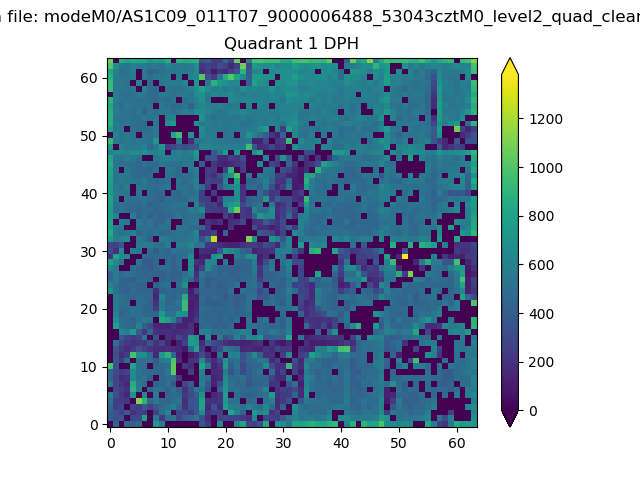 |
Quadrant B |
|---|---|---|---|
| Quadrant D | 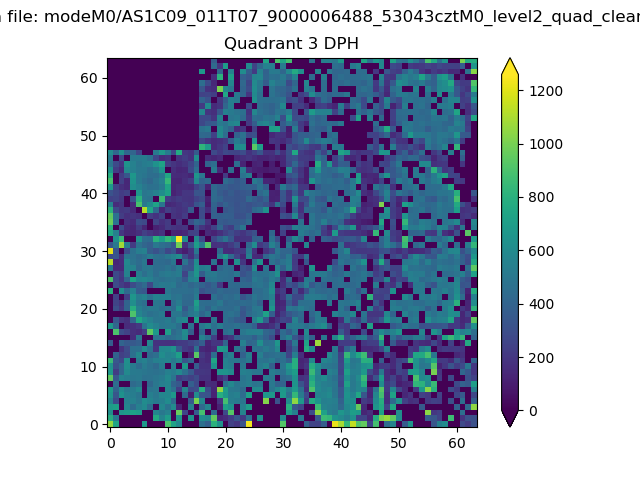 |
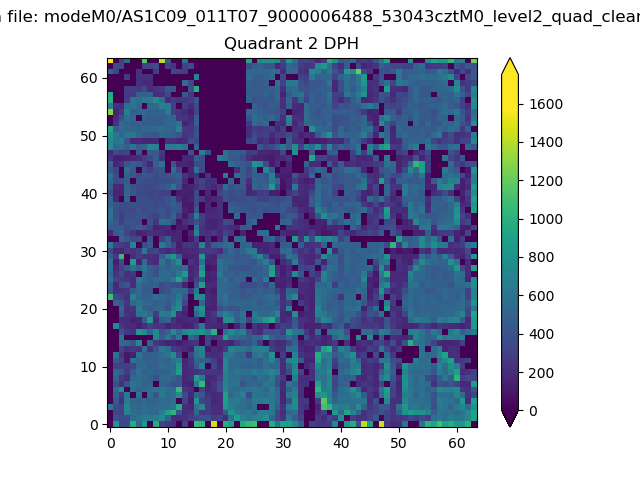 |
Quadrant C |
| Plot type | Count rate plots | Images |
|---|---|---|
| Comparison with Poisson distribution Blue bars denote a histogram of data divided into 1 sec bins. Red curve is a Poisson curve with rate = median count rate of data. |
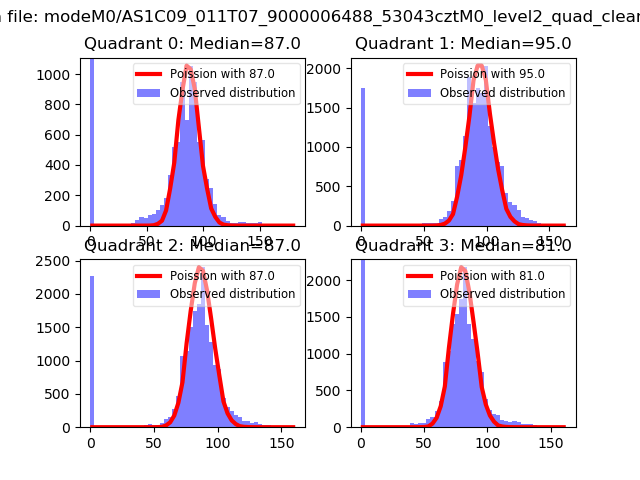 |
 |
| Quadrant-wise count rates Data is divided into 100 sec bins |
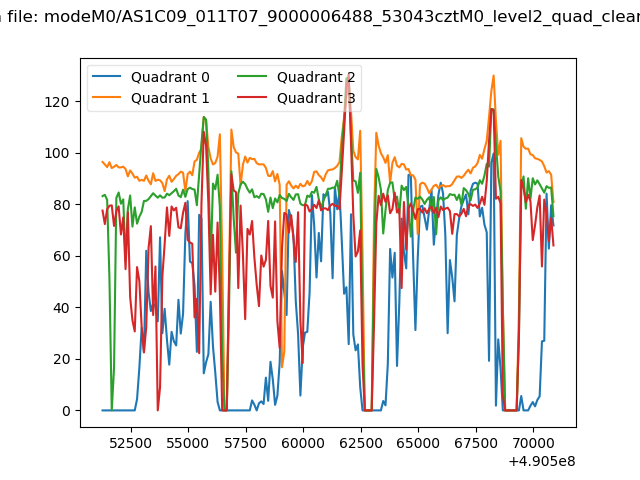 |
|
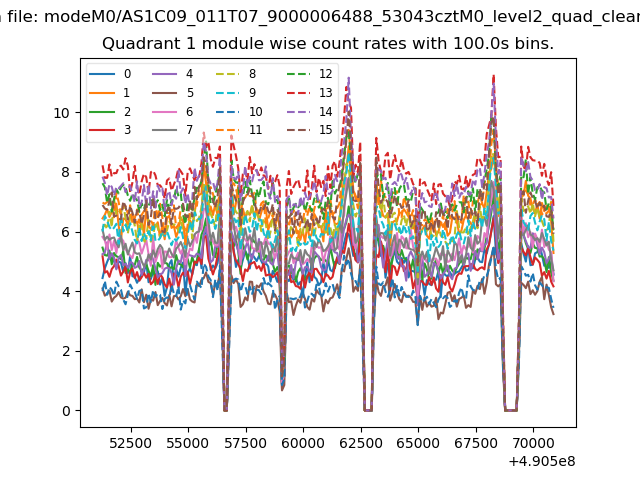
| Module-wise count rates for Quadrant A Data is divided into 100 sec bins |
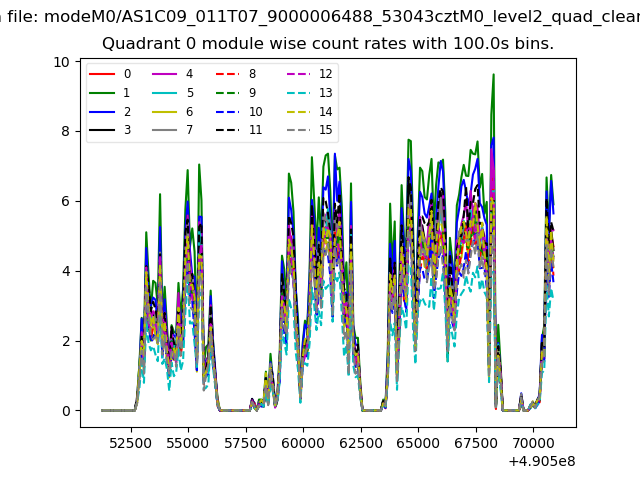 |
 |
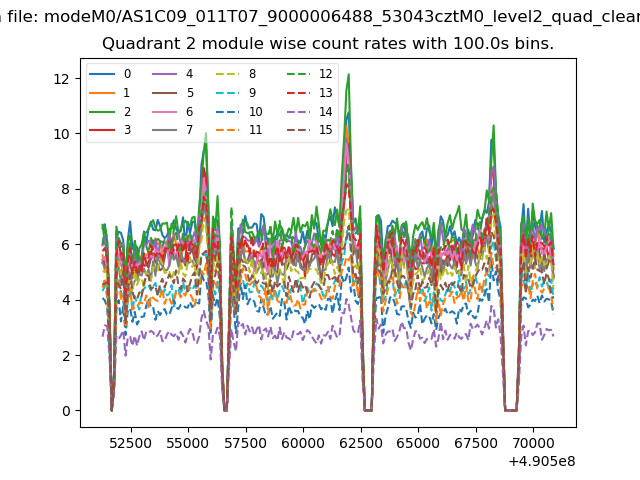
| Module-wise count rates for Quadrant B Data is divided into 100 sec bins |
 |
 |
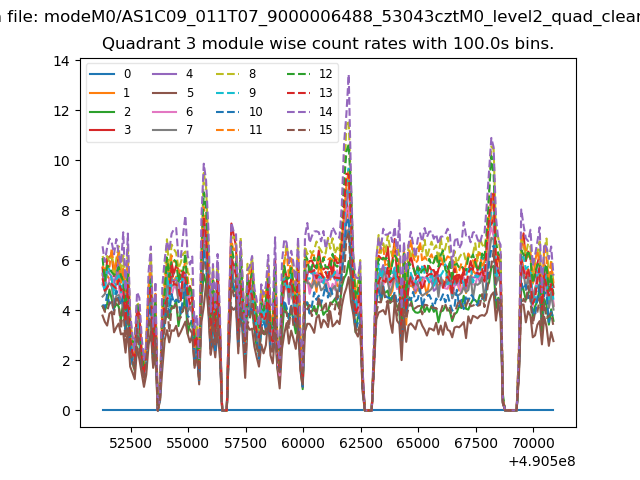
| Module-wise count rates for Quadrant C Data is divided into 100 sec bins |
 |
 |
| Module-wise count rates for Quadrant D Data is divided into 100 sec bins |
 |
 |
| Parameter | Plot |
|---|---|
| CZT HV Monitor |  |
| D_VDD | 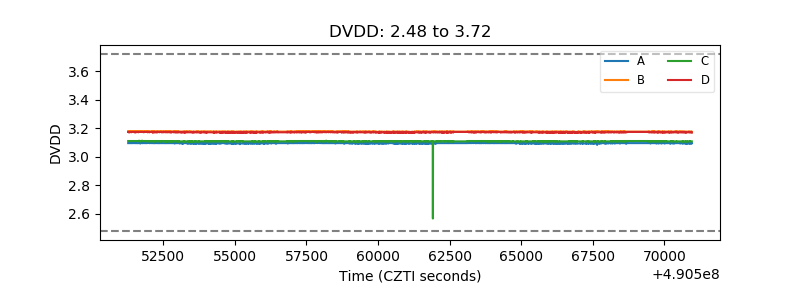 |
| Temperature 1 | 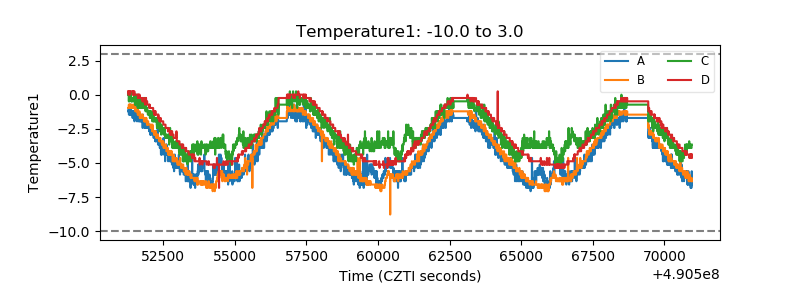 |
| Veto HV Monitor | 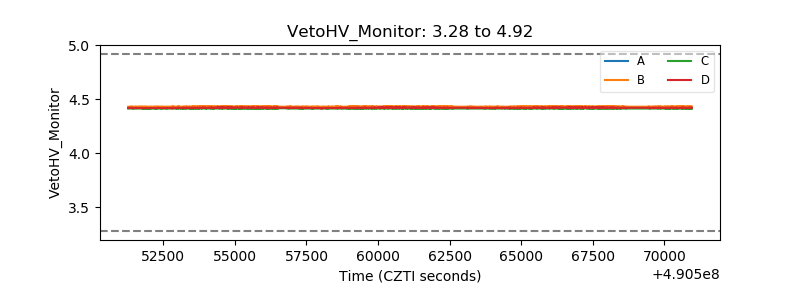 |
| Veto LLD | 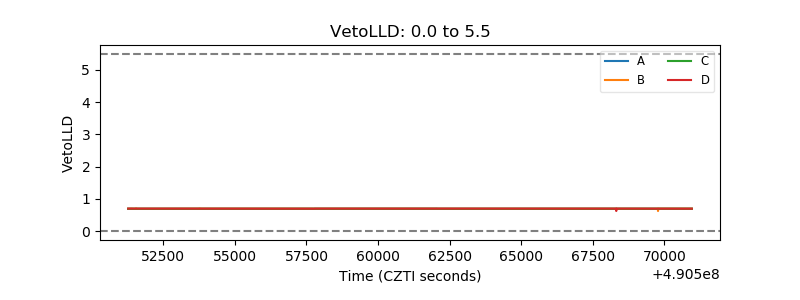 |
| Alpha Counter | 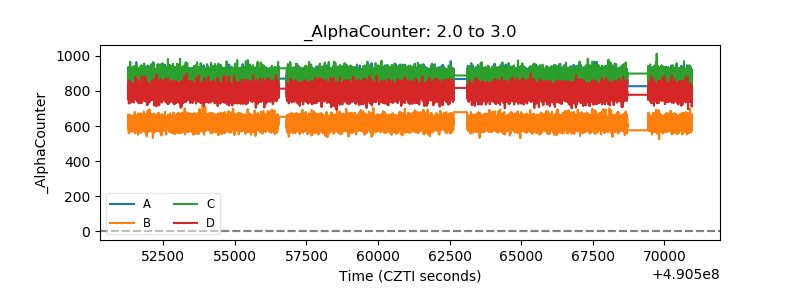 |
| _CPM_Rate | 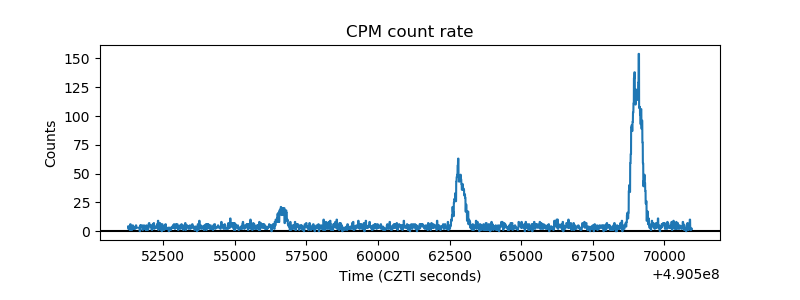 |
| CZT Counter | 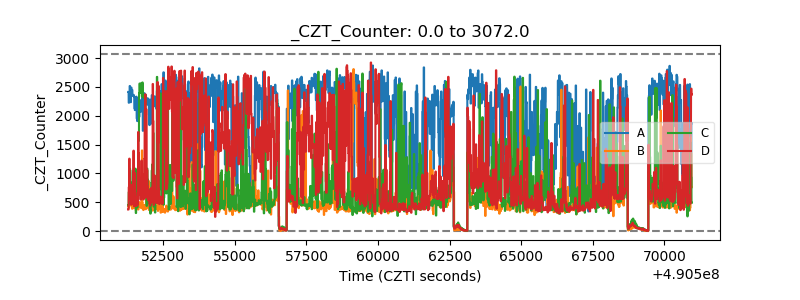 |
| +2.5 Volts monitor | 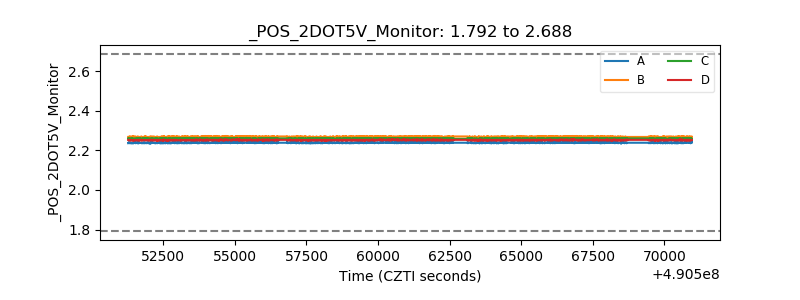 |
| +5 Volts monitor | 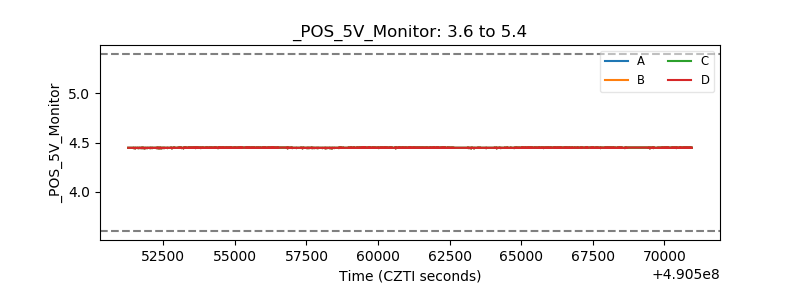 |
| _ROLL_ROT | 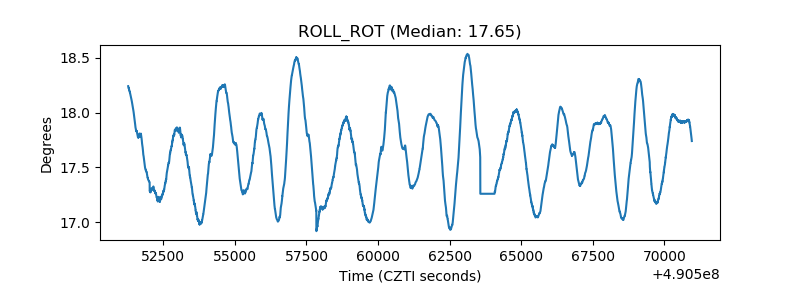 |
| _Roll_DEC | 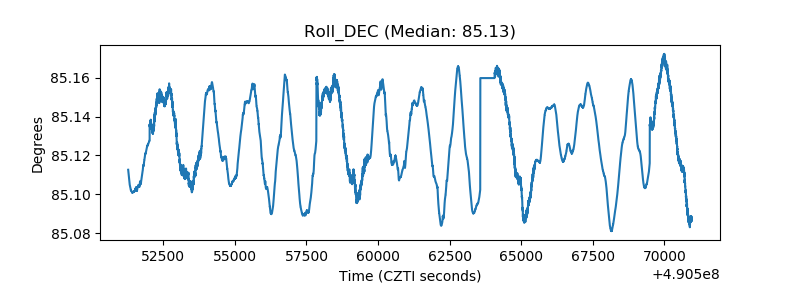 |
| _Roll_RA | 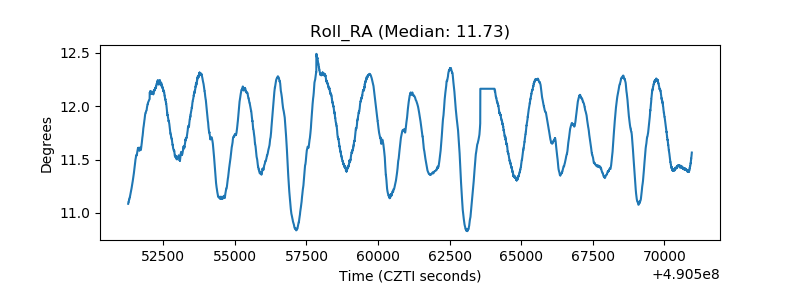 |
| Veto Counter | 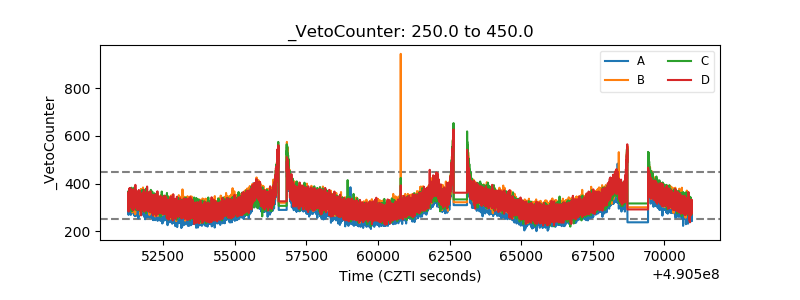 |