| Param | Original file | Final file |
|---|---|---|
| Filename | modeM0/AS1C09_011T07_9000006488_53046cztM0_level2.fits | modeM0/AS1C09_011T07_9000006488_53046cztM0_level2_quad_clean.evt |
| Size (bytes) | 732,706,560 | 90,391,680 |
| Size | 698.8 MB | 86.2 MB |
| Events in quadrant A | 9,474,268 | 499,861 |
| Events in quadrant B | 4,459,425 | 664,902 |
| Events in quadrant C | 7,095,070 | 537,554 |
| Events in quadrant D | 5,572,284 | 564,372 |
| Mode SS | |||
|---|---|---|---|
| Quadrant | BADHDUFLAG | Total packets | Discarded packets |
| A | 0 | 138 | 0 |
| B | 0 | 138 | 0 |
| C | 0 | 138 | 0 |
| D | 0 | 138 | 0 |
| Mode M9 | |||
|---|---|---|---|
| Quadrant | BADHDUFLAG | Total packets | Discarded packets |
| A | 0 | 10 | 0 |
| B | 0 | 10 | 0 |
| C | 0 | 10 | 0 |
| D | 0 | 10 | 0 |
| Mode M0 | |||
|---|---|---|---|
| Quadrant | BADHDUFLAG | Total packets | Discarded packets |
| A | 0 | 32859 | 1 |
| B | 0 | 17932 | 1 |
| C | 0 | 25878 | 1 |
| D | 0 | 21248 | 1 |
| Quadrant | Total seconds | Saturated seconds | Saturation percentage |
|---|---|---|---|
| A | 6738 | 1891 | 28.064708% |
| B | 6738 | 296 | 4.392995% |
| C | 6739 | 1053 | 15.625464% |
| D | 6739 | 510 | 7.567888% |
Noise dominated data is calculated using 1-second bins in cleaned event files. If a bin has >2000 counts, and if more than 50% of those come from <1% of pixels, then it is considered to be noise-dominated and hence unusable.
| Quadrant | # 1 sec bins | Bins with >0 counts | Bins with >2000 counts | High rate bins dominated by noise | Noise dominated (total time) | Noise dominated (detector-on time) | Marked lightcurve |
|---|---|---|---|---|---|---|---|
| A | 7738 | 6739 | 1818 | 1818 | 23.49% | 26.98% | 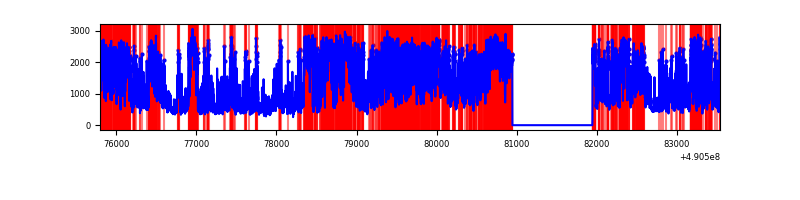 |
| B | 7738 | 6739 | 217 | 217 | 2.80% | 3.22% | 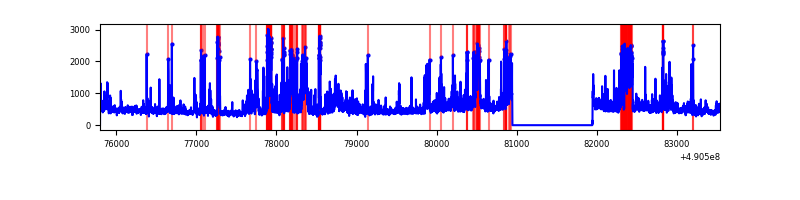 |
| C | 7739 | 6740 | 1038 | 1038 | 13.41% | 15.40% | 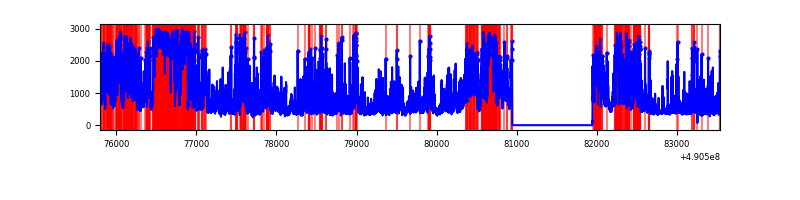 |
| D | 7739 | 6740 | 496 | 496 | 6.41% | 7.36% | 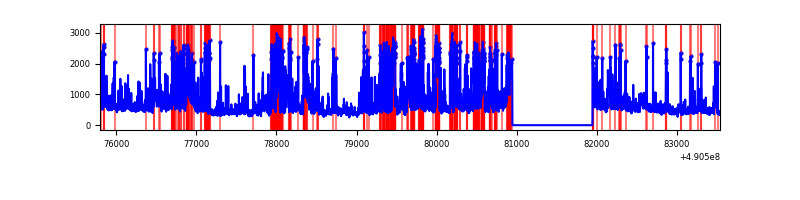 |
Top three noisy pixels from each quadrant. If the there are fewer than three noisy pixels in the level2.evt file, extra rows are filled as -1
| Pixel properties | Quadrant properties | ||||||
|---|---|---|---|---|---|---|---|
| Quadrant | DetID | PixID | Counts | Sigma | Mean | Median | Sigma |
| A | 9 | 191 | 3410476 | 21684.56 | 624 | 611 | 157.2 |
| A | 7 | 206 | 3319680 | 21107.16 | 624 | 611 | 157.2 |
| A | 15 | 174 | 120965 | 765.37 | 624 | 611 | 157.2 |
| B | 10 | 44 | 356392 | 2458.13 | 677 | 652 | 144.7 |
| B | 1 | 255 | 302003 | 2082.3 | 677 | 652 | 144.7 |
| B | 4 | 81 | 245628 | 1692.76 | 677 | 652 | 144.7 |
| C | 1 | 241 | 2245811 | 12908.37 | 630 | 626 | 173.9 |
| C | 15 | 224 | 1102583 | 6335.54 | 630 | 626 | 173.9 |
| C | 7 | 80 | 523239 | 3004.69 | 630 | 626 | 173.9 |
| D | 12 | 17 | 1233937 | 6522.54 | 656 | 626 | 189.1 |
| D | 2 | 62 | 331580 | 1750.3 | 656 | 626 | 189.1 |
| D | 3 | 224 | 325802 | 1719.74 | 656 | 626 | 189.1 |
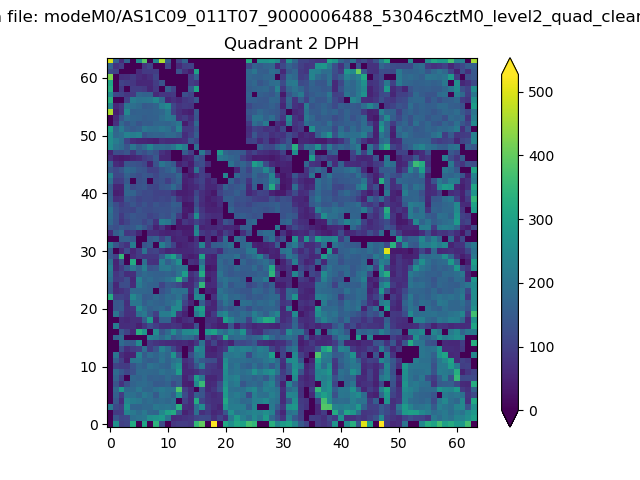
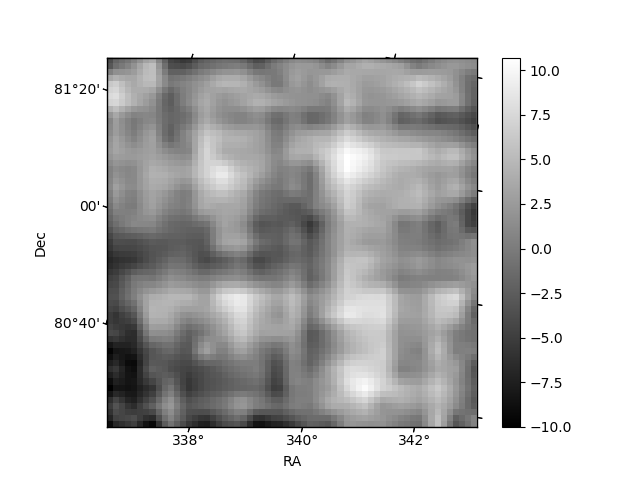
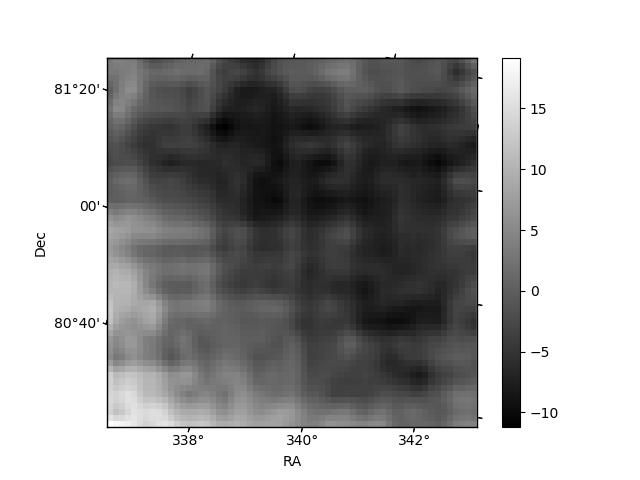
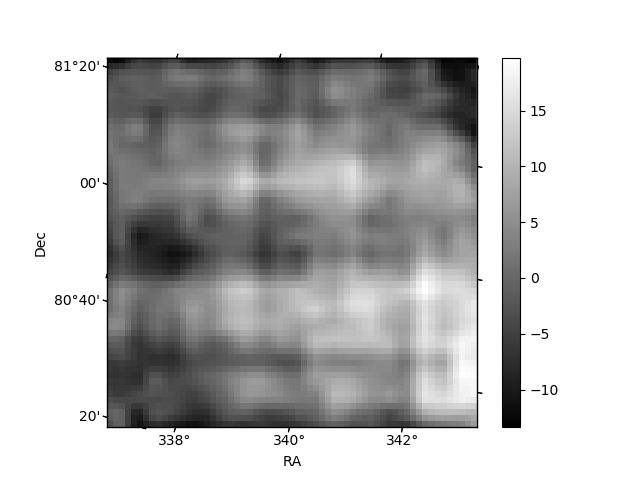
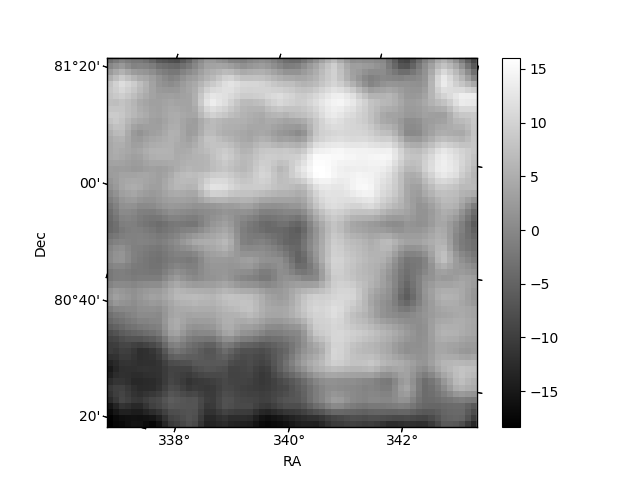
Histogram calculated using DETX and DETY for each event in the final _common_clean file
| Quadrant A | 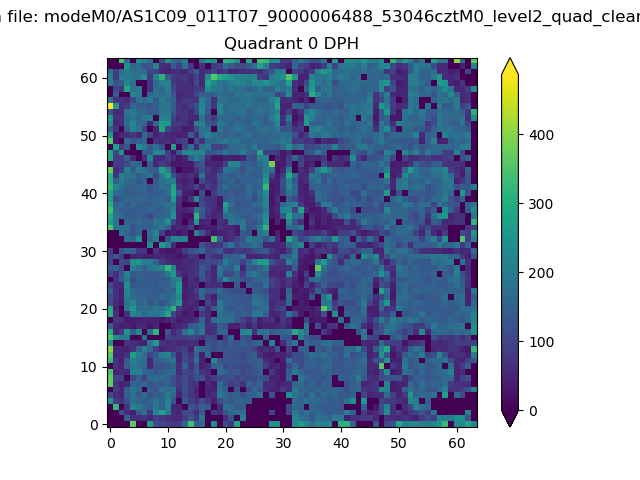 |
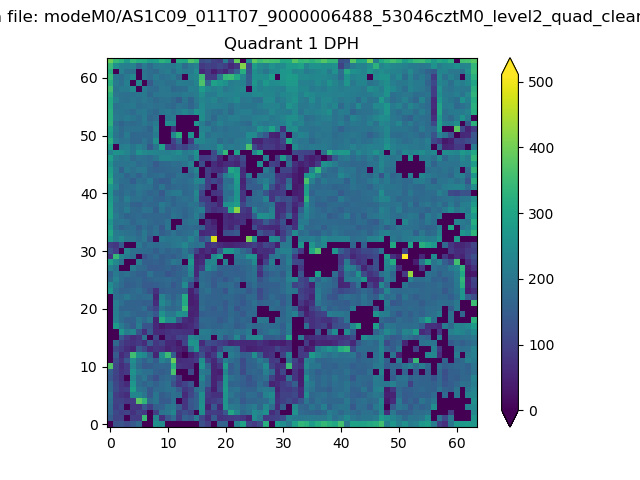 |
Quadrant B |
|---|---|---|---|
| Quadrant D | 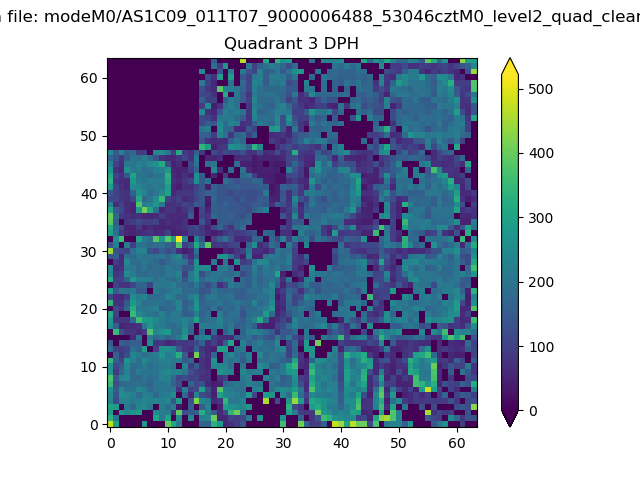 |
 |
Quadrant C |
| Plot type | Count rate plots | Images |
|---|---|---|
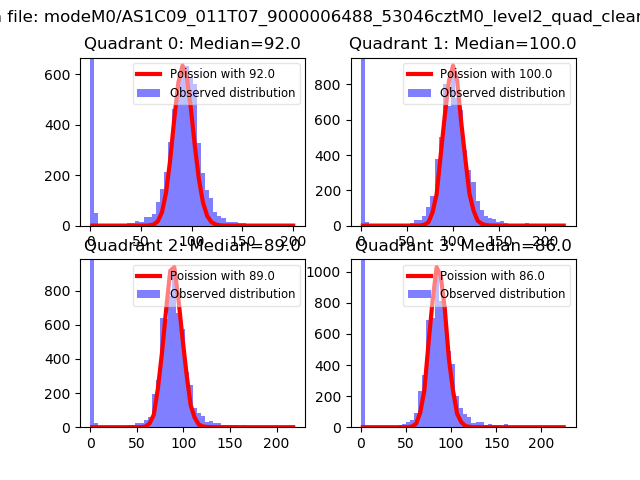
| Comparison with Poisson distribution Blue bars denote a histogram of data divided into 1 sec bins. Red curve is a Poisson curve with rate = median count rate of data. |
 |
 |
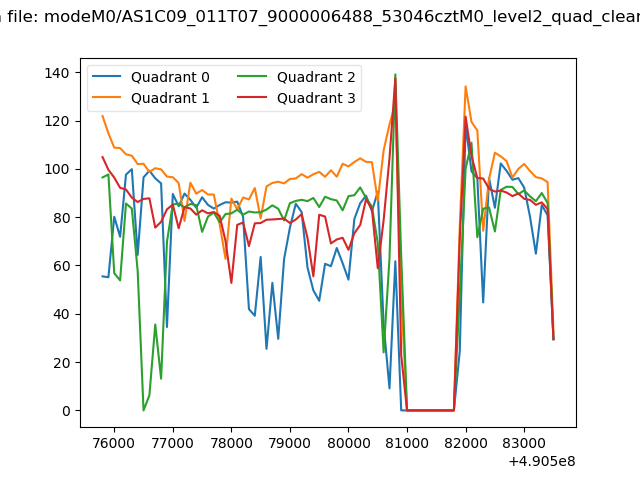
| Quadrant-wise count rates Data is divided into 100 sec bins |
 |
|
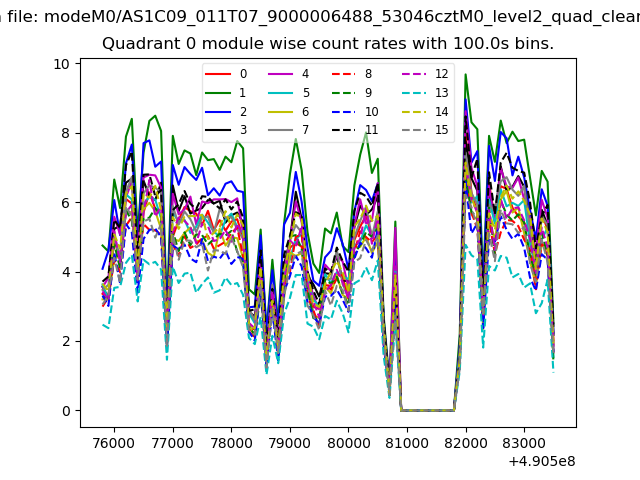
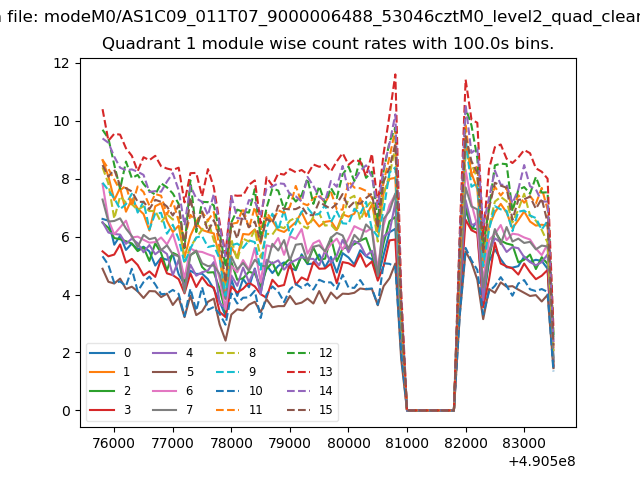
| Module-wise count rates for Quadrant A Data is divided into 100 sec bins |
 |
 |
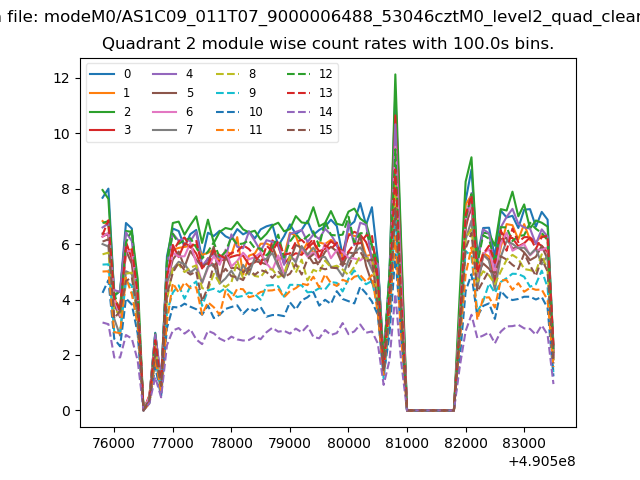
| Module-wise count rates for Quadrant B Data is divided into 100 sec bins |
 |
 |
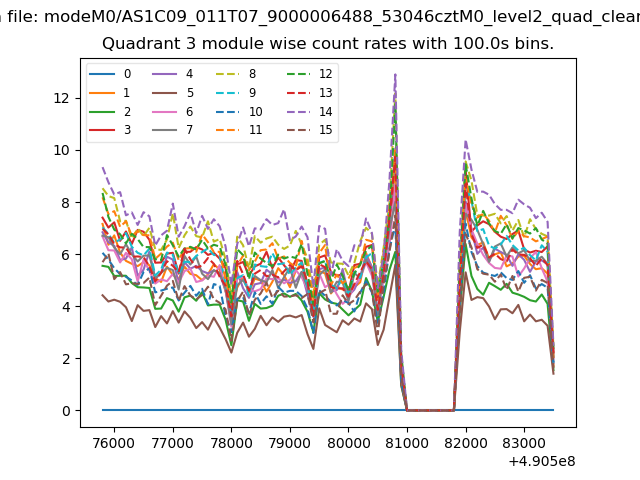
| Module-wise count rates for Quadrant C Data is divided into 100 sec bins |
 |
 |
| Module-wise count rates for Quadrant D Data is divided into 100 sec bins |
 |
 |
| Parameter | Plot |
|---|---|
| CZT HV Monitor | 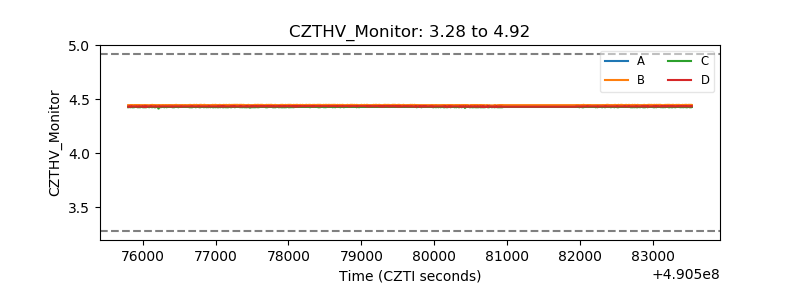 |
| D_VDD | 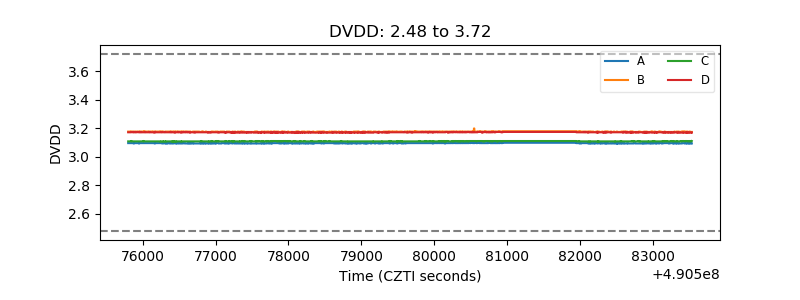 |
| Temperature 1 | 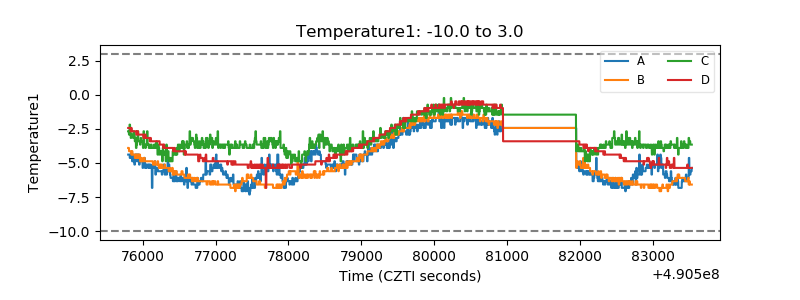 |
| Veto HV Monitor | 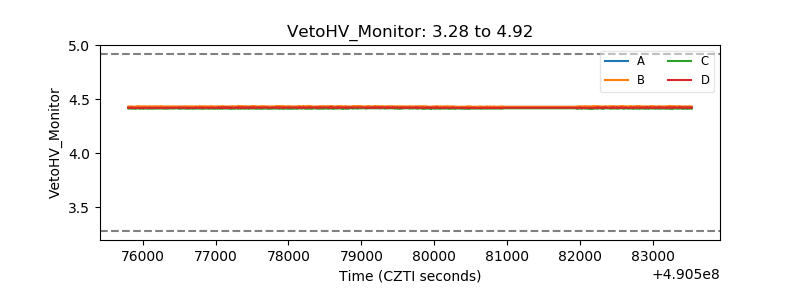 |
| Veto LLD | 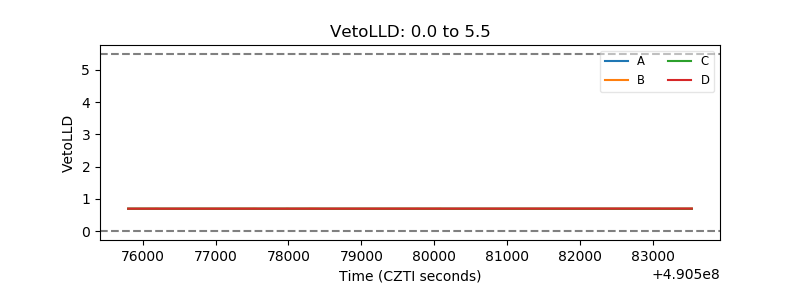 |
| Alpha Counter | 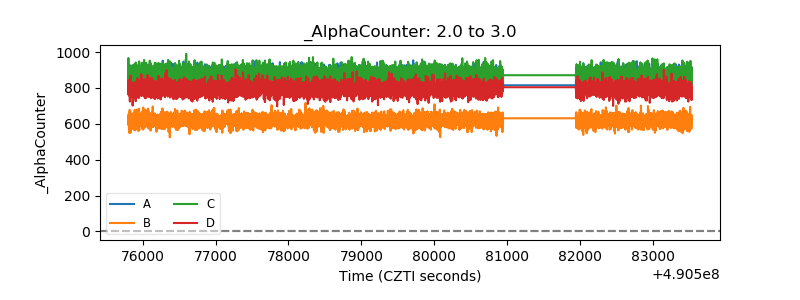 |
| _CPM_Rate | 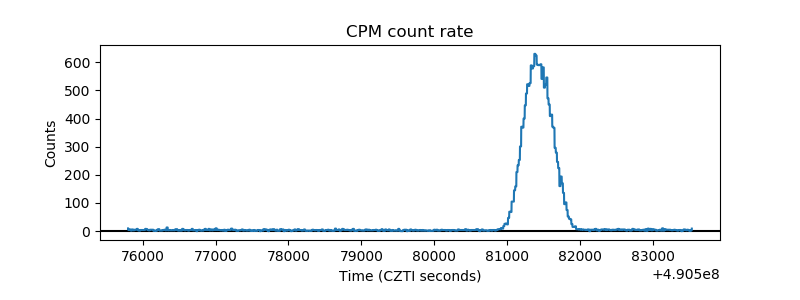 |
| CZT Counter | 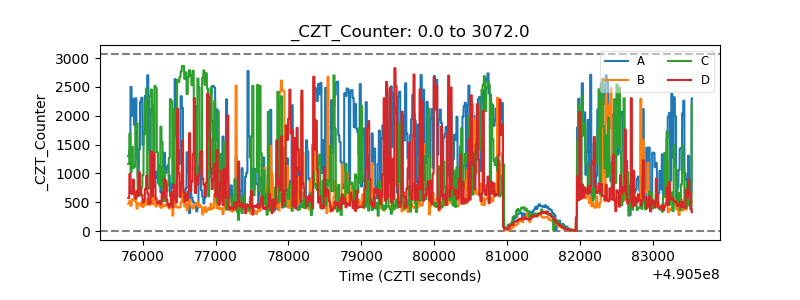 |
| +2.5 Volts monitor |  |
| +5 Volts monitor |  |
| _ROLL_ROT | 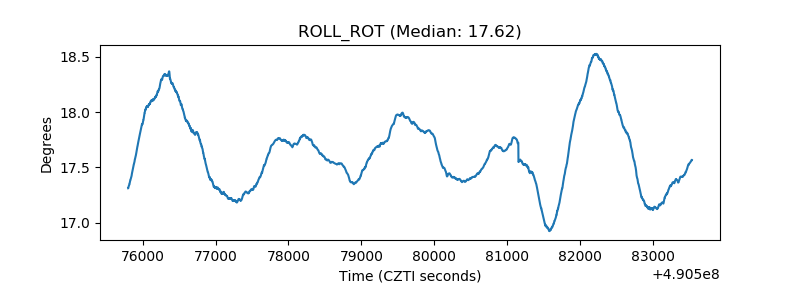 |
| _Roll_DEC | 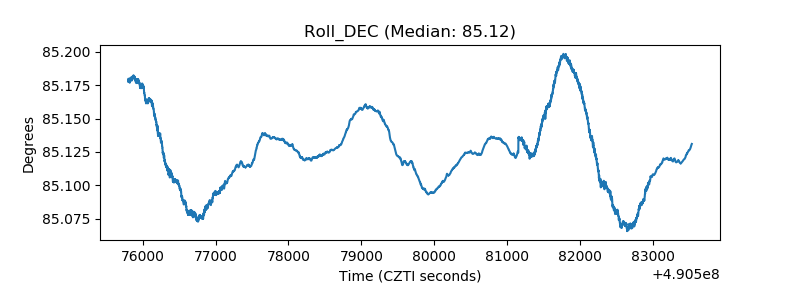 |
| _Roll_RA | 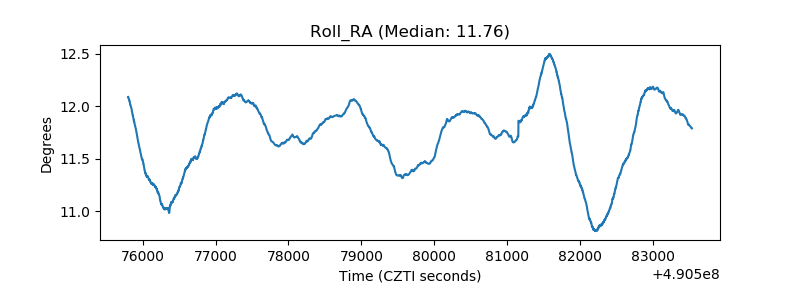 |
| Veto Counter | 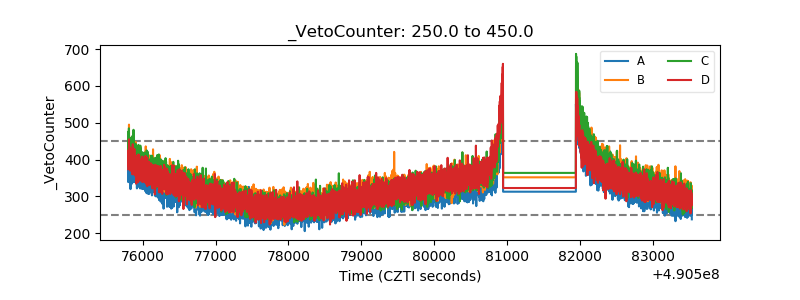 |