| Param | Original file | Final file |
|---|---|---|
| Filename | modeM0/AS1C09_011T07_9000006488_53047cztM0_level2.fits | modeM0/AS1C09_011T07_9000006488_53047cztM0_level2_quad_clean.evt |
| Size (bytes) | 2,725,899,840 | 329,051,520 |
| Size | 2.5 GB | 313.8 MB |
| Events in quadrant A | 37,794,966 | 1,615,699 |
| Events in quadrant B | 15,193,727 | 2,503,750 |
| Events in quadrant C | 25,237,687 | 2,014,503 |
| Events in quadrant D | 20,743,350 | 2,099,143 |
| Mode SS | |||
|---|---|---|---|
| Quadrant | BADHDUFLAG | Total packets | Discarded packets |
| A | 0 | 512 | 0 |
| B | 0 | 512 | 0 |
| C | 0 | 512 | 0 |
| D | 0 | 512 | 0 |
| Mode M9 | |||
|---|---|---|---|
| Quadrant | BADHDUFLAG | Total packets | Discarded packets |
| A | 0 | 41 | 0 |
| B | 0 | 41 | 0 |
| C | 0 | 41 | 0 |
| D | 0 | 41 | 0 |
| Mode M0 | |||
|---|---|---|---|
| Quadrant | BADHDUFLAG | Total packets | Discarded packets |
| A | 0 | 129740 | 4 |
| B | 0 | 62790 | 4 |
| C | 0 | 92688 | 4 |
| D | 0 | 79438 | 5 |
| Quadrant | Total seconds | Saturated seconds | Saturation percentage |
|---|---|---|---|
| A | 25120 | 8563 | 34.088376% |
| B | 25120 | 849 | 3.379777% |
| C | 25120 | 3775 | 15.027866% |
| D | 25119 | 2014 | 8.017835% |
Noise dominated data is calculated using 1-second bins in cleaned event files. If a bin has >2000 counts, and if more than 50% of those come from <1% of pixels, then it is considered to be noise-dominated and hence unusable.
| Quadrant | # 1 sec bins | Bins with >0 counts | Bins with >2000 counts | High rate bins dominated by noise | Noise dominated (total time) | Noise dominated (detector-on time) | Marked lightcurve |
|---|---|---|---|---|---|---|---|
| A | 29274 | 25122 | 8087 | 8087 | 27.63% | 32.19% | 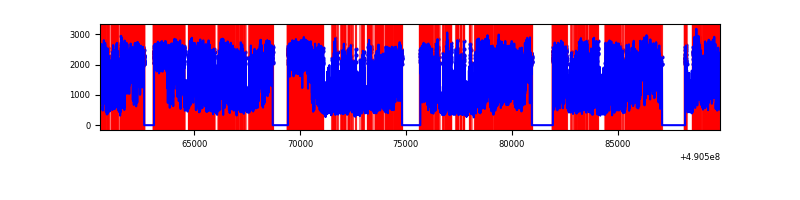 |
| B | 29274 | 25122 | 582 | 582 | 1.99% | 2.32% | 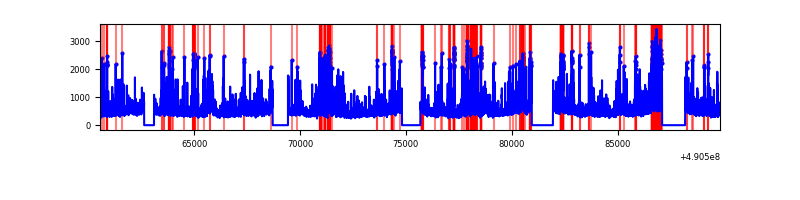 |
| C | 29274 | 25123 | 3818 | 3818 | 13.04% | 15.20% | 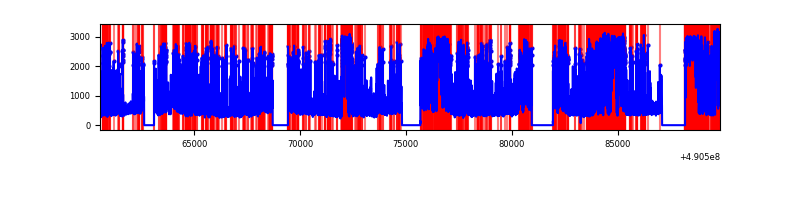 |
| D | 29273 | 25122 | 1871 | 1871 | 6.39% | 7.45% | 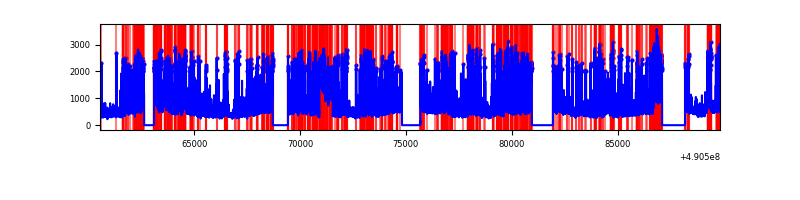 |
Top three noisy pixels from each quadrant. If the there are fewer than three noisy pixels in the level2.evt file, extra rows are filled as -1
| Pixel properties | Quadrant properties | ||||||
|---|---|---|---|---|---|---|---|
| Quadrant | DetID | PixID | Counts | Sigma | Mean | Median | Sigma |
| A | 9 | 191 | 18786303 | 33504.43 | 2253 | 2204 | 560.6 |
| A | 7 | 206 | 7594673 | 13542.38 | 2253 | 2204 | 560.6 |
| A | 15 | 174 | 1458098 | 2596.82 | 2253 | 2204 | 560.6 |
| B | 10 | 44 | 834806 | 1556.13 | 2552 | 2464 | 534.9 |
| B | 10 | 63 | 671270 | 1250.39 | 2552 | 2464 | 534.9 |
| B | 4 | 81 | 665038 | 1238.73 | 2552 | 2464 | 534.9 |
| C | 1 | 241 | 7614873 | 11789.99 | 2362 | 2340 | 645.7 |
| C | 15 | 224 | 3712451 | 5746.07 | 2362 | 2340 | 645.7 |
| C | 7 | 80 | 1633042 | 2525.57 | 2362 | 2340 | 645.7 |
| D | 12 | 17 | 4978944 | 7020.8 | 2476 | 2361 | 708.8 |
| D | 15 | 78 | 1371304 | 1931.26 | 2476 | 2361 | 708.8 |
| D | 3 | 224 | 882164 | 1241.2 | 2476 | 2361 | 708.8 |
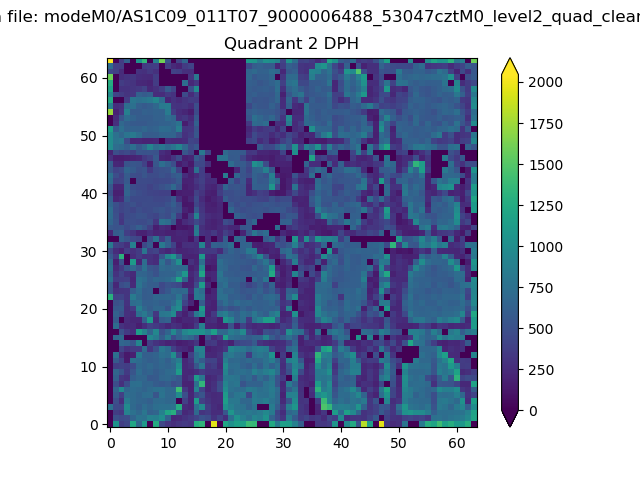
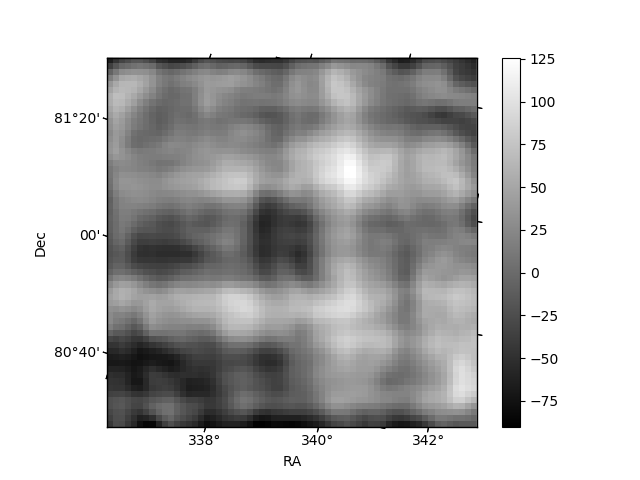
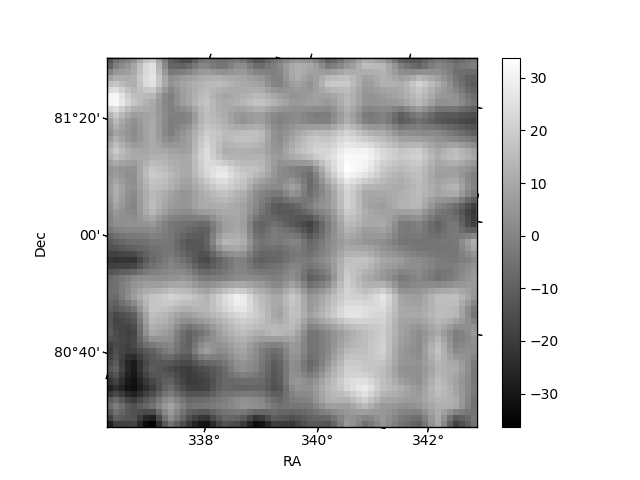
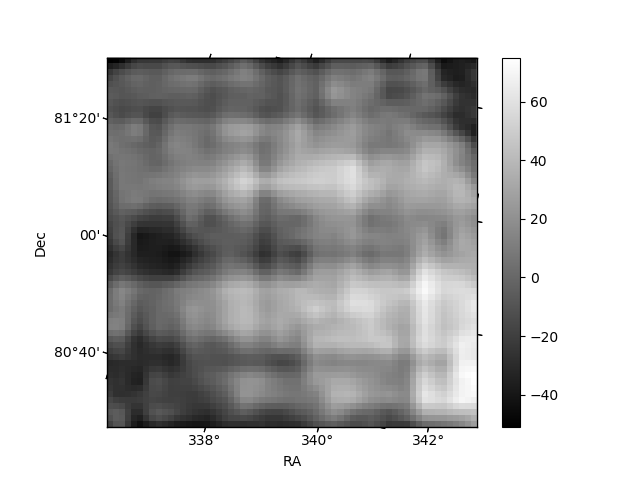
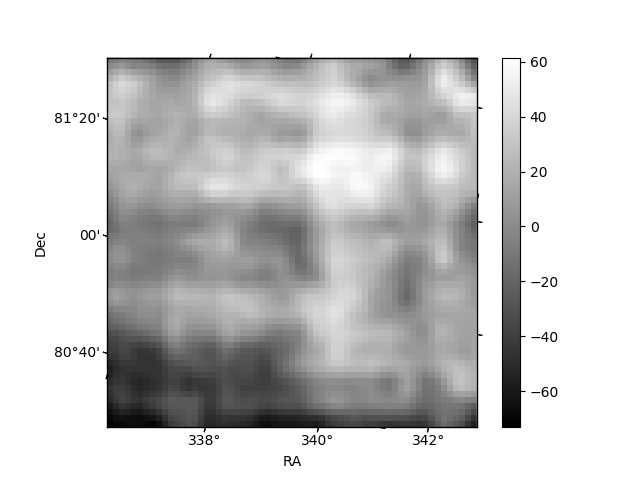
Histogram calculated using DETX and DETY for each event in the final _common_clean file
| Quadrant A | 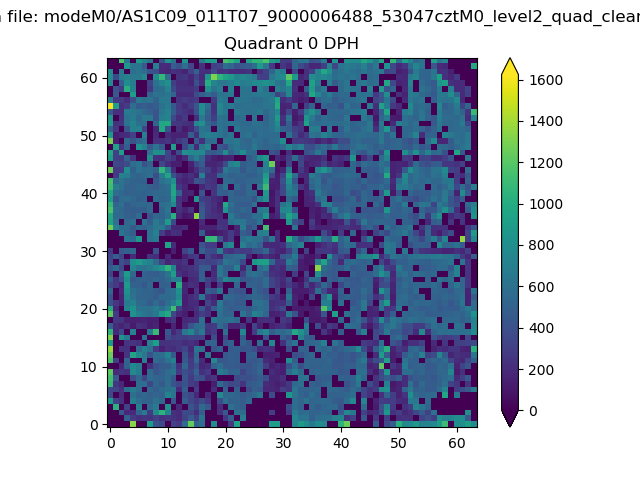 |
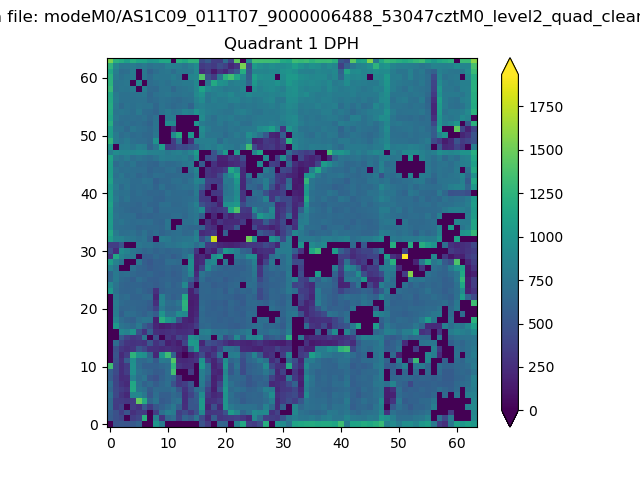 |
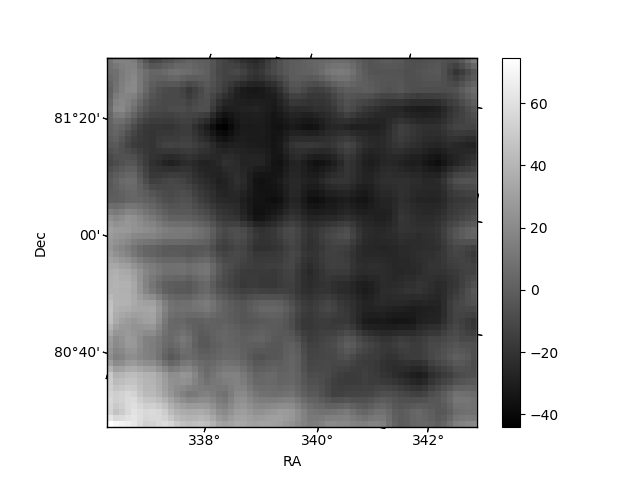
Quadrant B |
|---|---|---|---|
| Quadrant D | 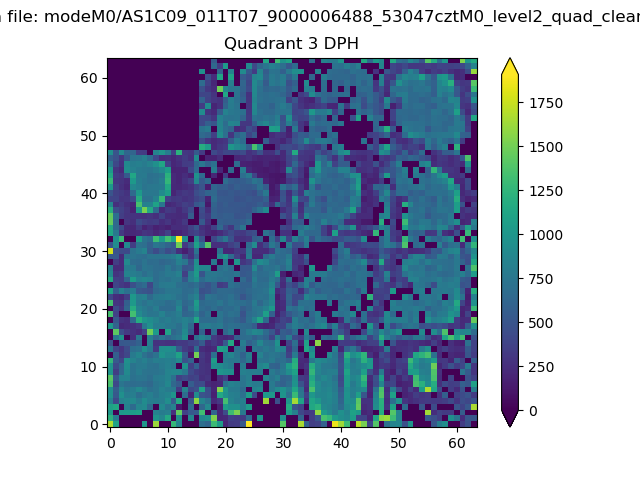 |
 |
Quadrant C |
| Plot type | Count rate plots | Images |
|---|---|---|
| Comparison with Poisson distribution Blue bars denote a histogram of data divided into 1 sec bins. Red curve is a Poisson curve with rate = median count rate of data. |
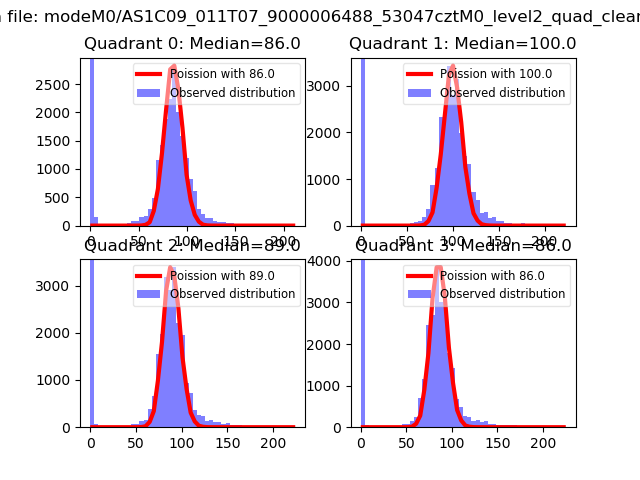 |
 |
| Quadrant-wise count rates Data is divided into 100 sec bins |
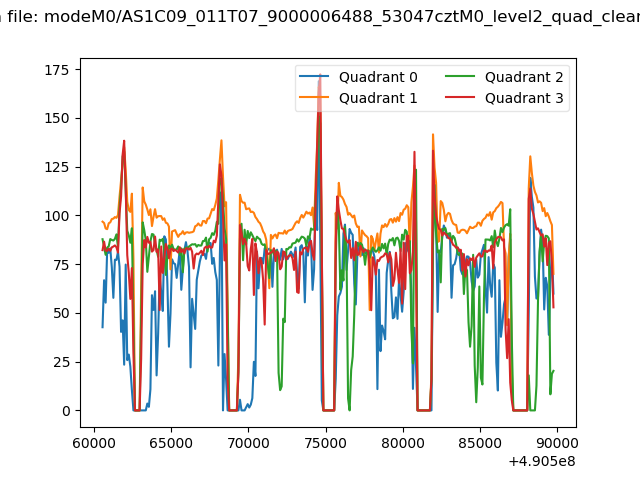 |
|
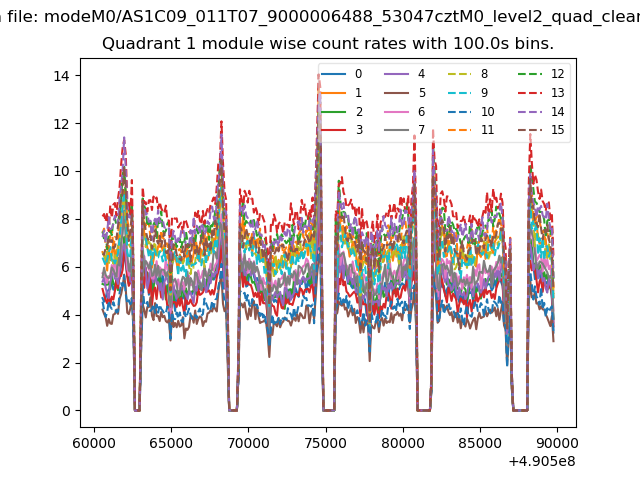
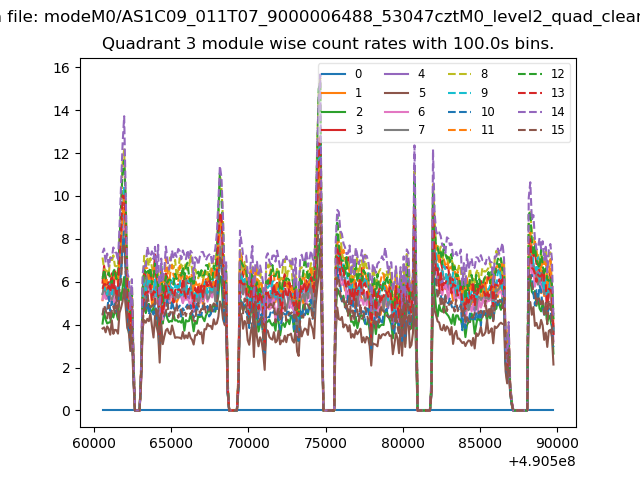
| Module-wise count rates for Quadrant A Data is divided into 100 sec bins |
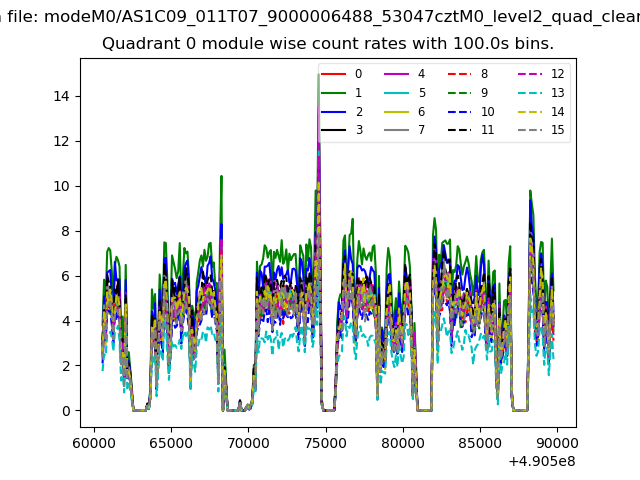 |
 |
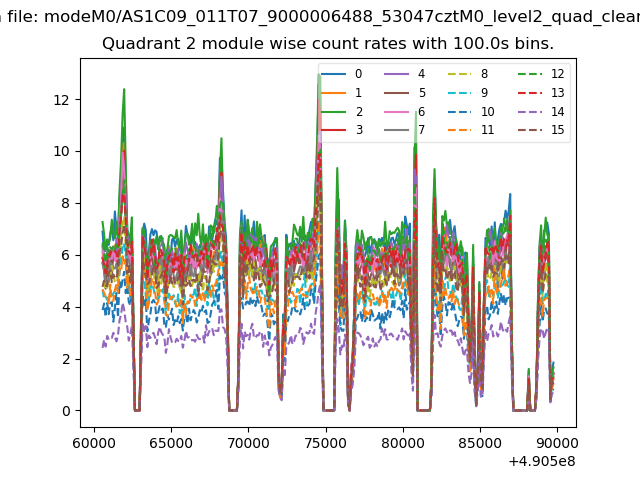
| Module-wise count rates for Quadrant B Data is divided into 100 sec bins |
 |
 |
| Module-wise count rates for Quadrant C Data is divided into 100 sec bins |
 |
 |
| Module-wise count rates for Quadrant D Data is divided into 100 sec bins |
 |
 |
| Parameter | Plot |
|---|---|
| CZT HV Monitor | 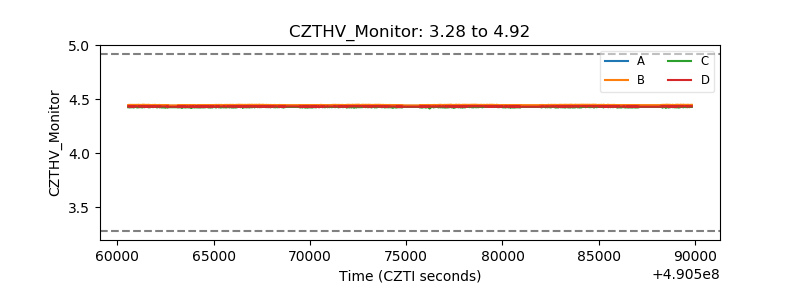 |
| D_VDD | 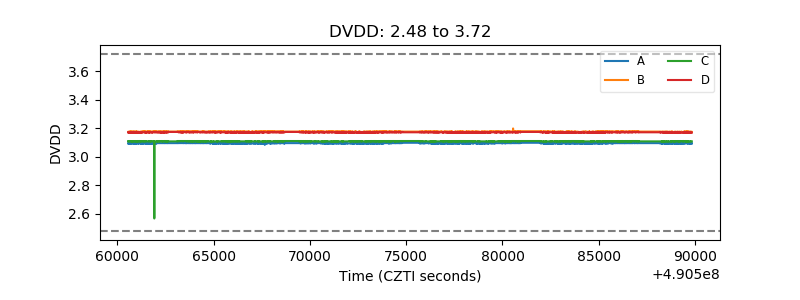 |
| Temperature 1 | 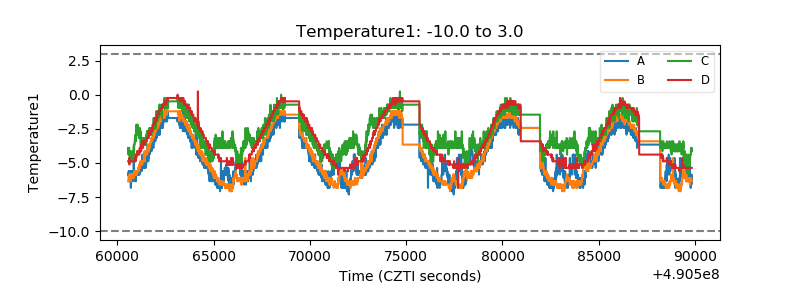 |
| Veto HV Monitor |  |
| Veto LLD | 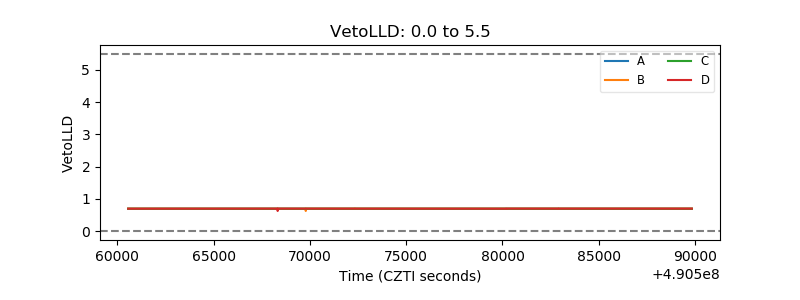 |
| Alpha Counter | 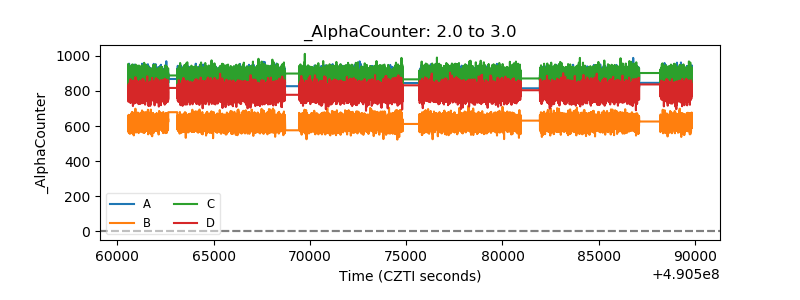 |
| _CPM_Rate | 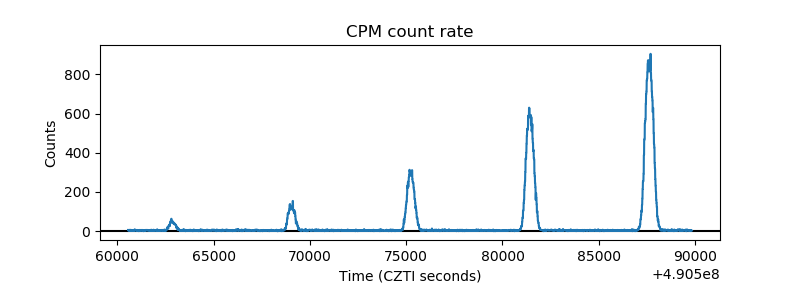 |
| CZT Counter | 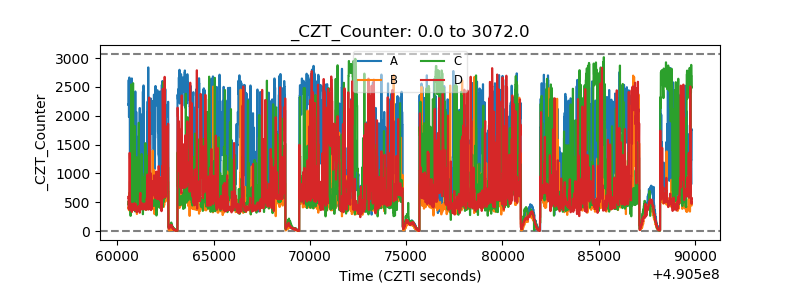 |
| +2.5 Volts monitor |  |
| +5 Volts monitor |  |
| _ROLL_ROT | 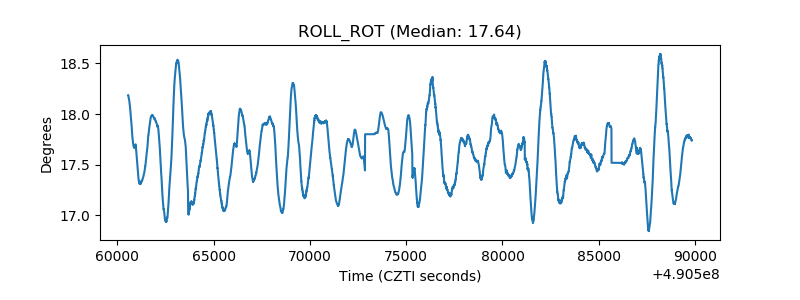 |
| _Roll_DEC | 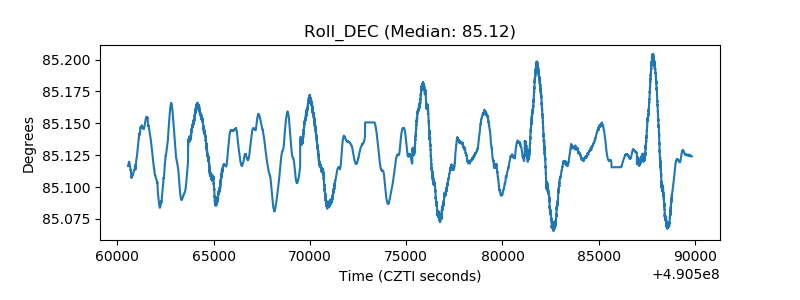 |
| _Roll_RA | 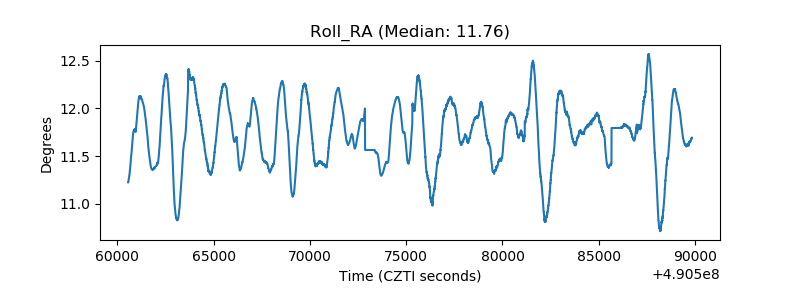 |
| Veto Counter | 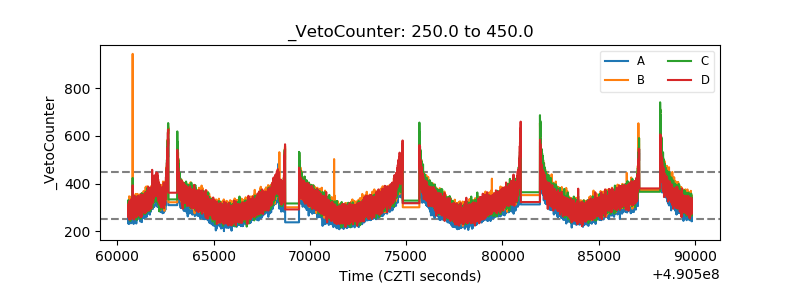 |