| Param | Original file | Final file |
|---|---|---|
| Filename | modeM0/AS1C09_011T07_9000006488_53048cztM0_level2.fits | modeM0/AS1C09_011T07_9000006488_53048cztM0_level2_quad_clean.evt |
| Size (bytes) | 660,674,880 | 82,019,520 |
| Size | 630.1 MB | 78.2 MB |
| Events in quadrant A | 7,284,279 | 504,829 |
| Events in quadrant B | 3,705,600 | 616,982 |
| Events in quadrant C | 7,495,448 | 450,615 |
| Events in quadrant D | 5,503,028 | 488,295 |
| Mode SS | |||
|---|---|---|---|
| Quadrant | BADHDUFLAG | Total packets | Discarded packets |
| A | 0 | 124 | 0 |
| B | 0 | 124 | 0 |
| C | 0 | 124 | 0 |
| D | 0 | 124 | 0 |
| Mode M9 | |||
|---|---|---|---|
| Quadrant | BADHDUFLAG | Total packets | Discarded packets |
| A | 0 | 11 | 0 |
| B | 0 | 11 | 0 |
| C | 0 | 11 | 0 |
| D | 0 | 11 | 0 |
| Mode M0 | |||
|---|---|---|---|
| Quadrant | BADHDUFLAG | Total packets | Discarded packets |
| A | 0 | 25819 | 1 |
| B | 0 | 15122 | 1 |
| C | 0 | 26485 | 1 |
| D | 0 | 20520 | 3 |
| Quadrant | Total seconds | Saturated seconds | Saturation percentage |
|---|---|---|---|
| A | 6045 | 1117 | 18.478081% |
| B | 6046 | 186 | 3.076414% |
| C | 6046 | 1411 | 23.337744% |
| D | 6045 | 562 | 9.296940% |
Noise dominated data is calculated using 1-second bins in cleaned event files. If a bin has >2000 counts, and if more than 50% of those come from <1% of pixels, then it is considered to be noise-dominated and hence unusable.
| Quadrant | # 1 sec bins | Bins with >0 counts | Bins with >2000 counts | High rate bins dominated by noise | Noise dominated (total time) | Noise dominated (detector-on time) | Marked lightcurve |
|---|---|---|---|---|---|---|---|
| A | 7205 | 6046 | 1064 | 1064 | 14.77% | 17.60% | 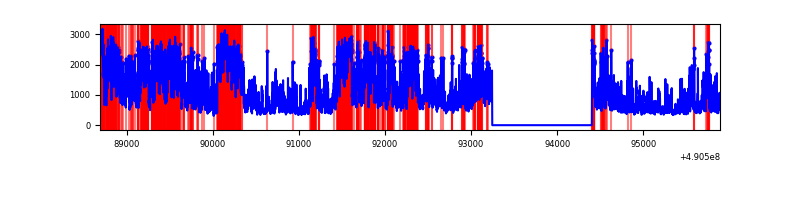 |
| B | 7206 | 6047 | 124 | 124 | 1.72% | 2.05% | 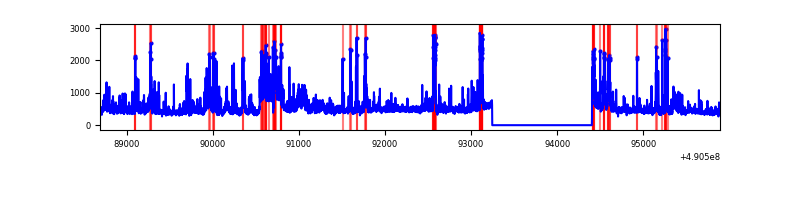 |
| C | 7206 | 6047 | 1343 | 1343 | 18.64% | 22.21% | 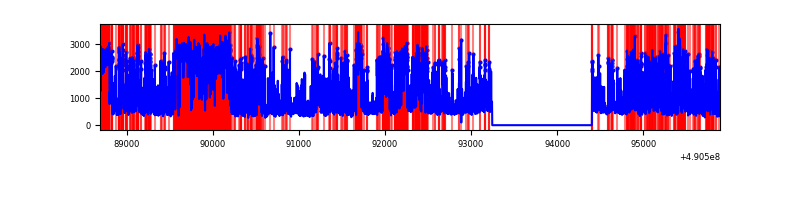 |
| D | 7205 | 6046 | 617 | 617 | 8.56% | 10.21% | 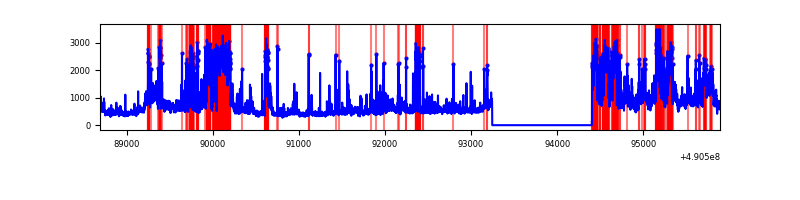 |
Top three noisy pixels from each quadrant. If the there are fewer than three noisy pixels in the level2.evt file, extra rows are filled as -1
| Pixel properties | Quadrant properties | ||||||
|---|---|---|---|---|---|---|---|
| Quadrant | DetID | PixID | Counts | Sigma | Mean | Median | Sigma |
| A | 9 | 191 | 3403219 | 23313.04 | 586 | 573 | 146.0 |
| A | 7 | 206 | 1221839 | 8367.44 | 586 | 573 | 146.0 |
| A | 15 | 174 | 148251 | 1011.81 | 586 | 573 | 146.0 |
| B | 1 | 255 | 583563 | 4471.84 | 610 | 588 | 130.4 |
| B | 10 | 63 | 141784 | 1083.08 | 610 | 588 | 130.4 |
| B | 4 | 81 | 119140 | 909.38 | 610 | 588 | 130.4 |
| C | 15 | 224 | 2531658 | 16870.45 | 540 | 534 | 150.0 |
| C | 1 | 241 | 1276623 | 8505.39 | 540 | 534 | 150.0 |
| C | 13 | 3 | 528060 | 3516.07 | 540 | 534 | 150.0 |
| D | 8 | 176 | 1134515 | 6855.53 | 574 | 548 | 165.4 |
| D | 15 | 78 | 706661 | 4268.89 | 574 | 548 | 165.4 |
| D | 3 | 224 | 666435 | 4025.7 | 574 | 548 | 165.4 |
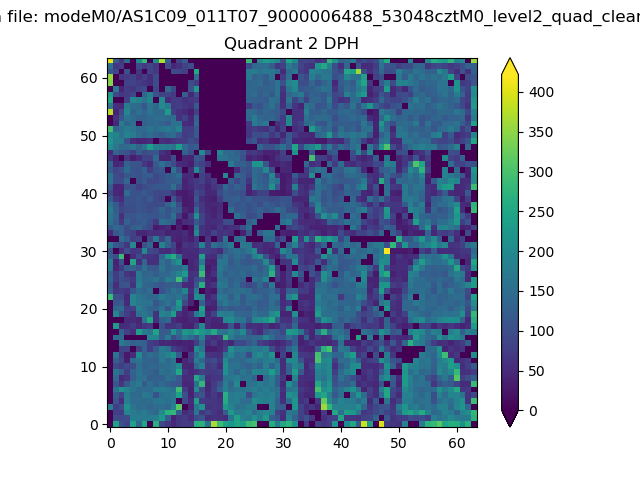
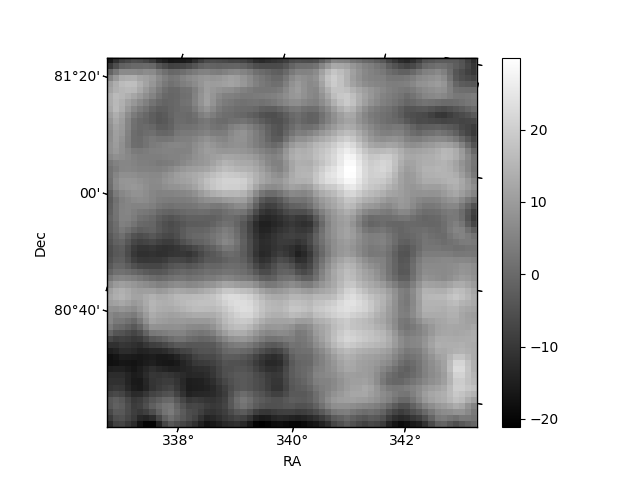
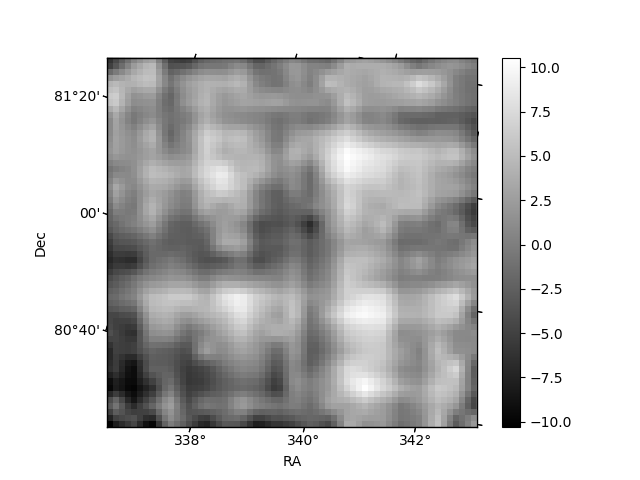
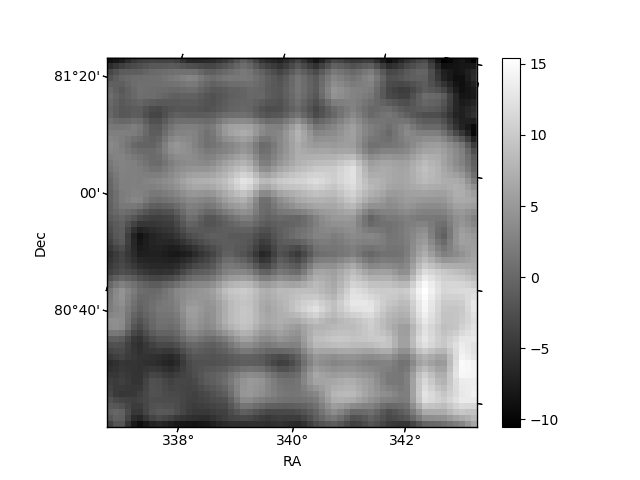
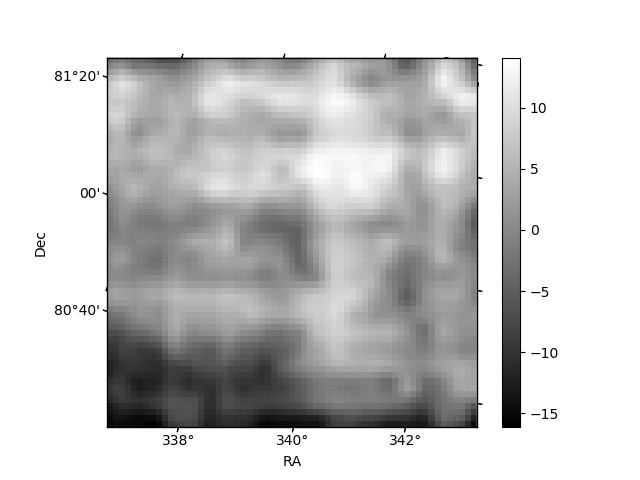
Histogram calculated using DETX and DETY for each event in the final _common_clean file
| Quadrant A | 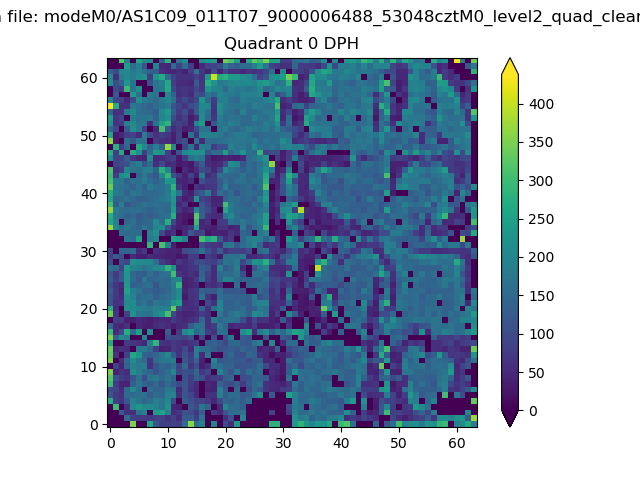 |
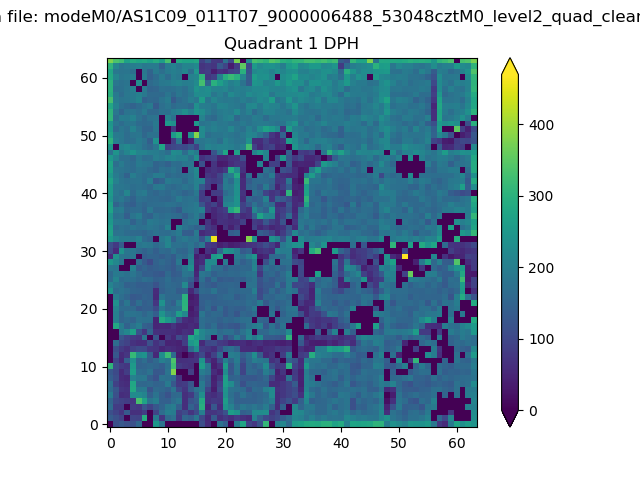 |
Quadrant B |
|---|---|---|---|
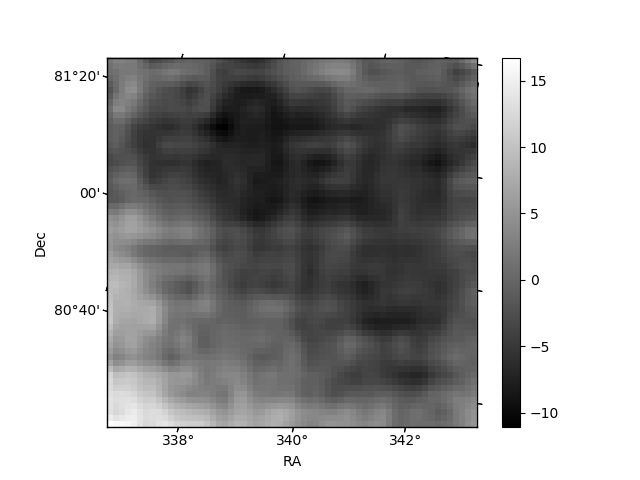
| Quadrant D | 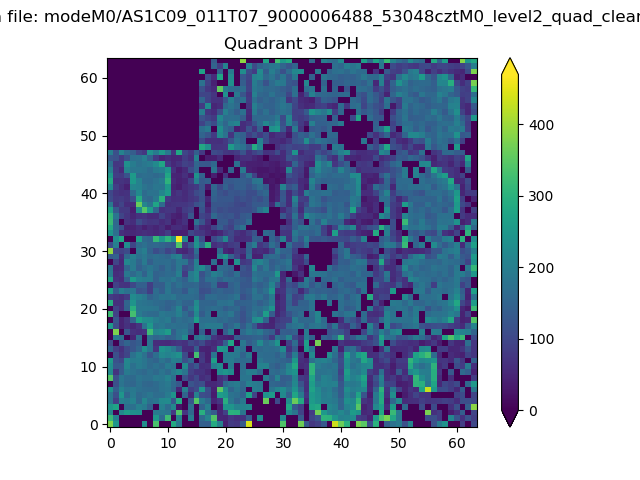 |
 |
Quadrant C |
| Plot type | Count rate plots | Images |
|---|---|---|
| Comparison with Poisson distribution Blue bars denote a histogram of data divided into 1 sec bins. Red curve is a Poisson curve with rate = median count rate of data. |
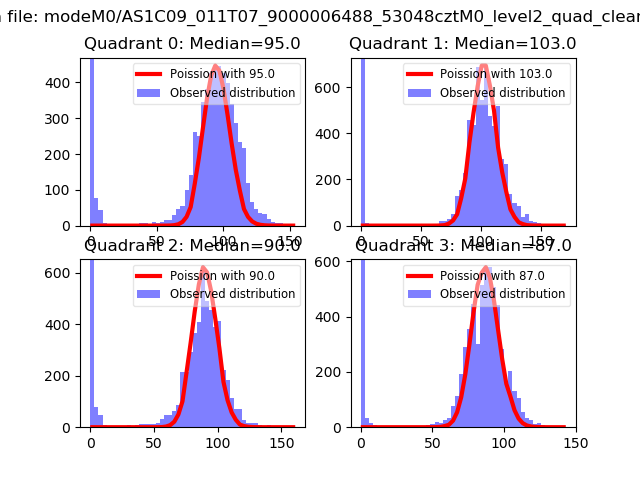 |
 |
| Quadrant-wise count rates Data is divided into 100 sec bins |
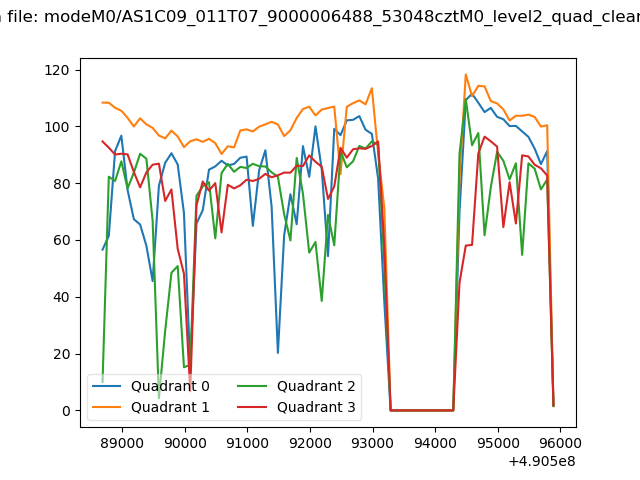 |
|
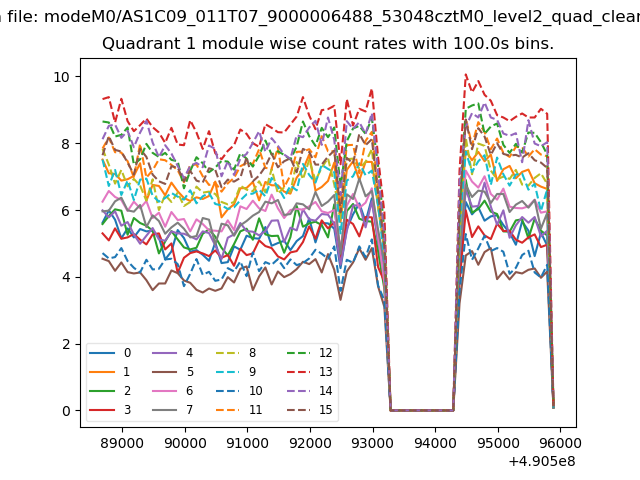
| Module-wise count rates for Quadrant A Data is divided into 100 sec bins |
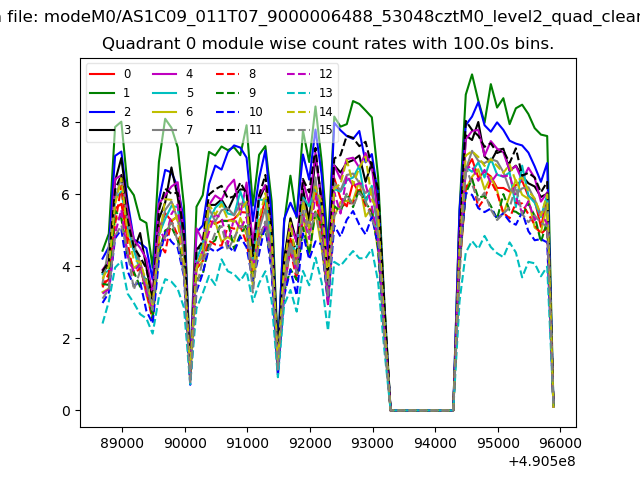 |
 |
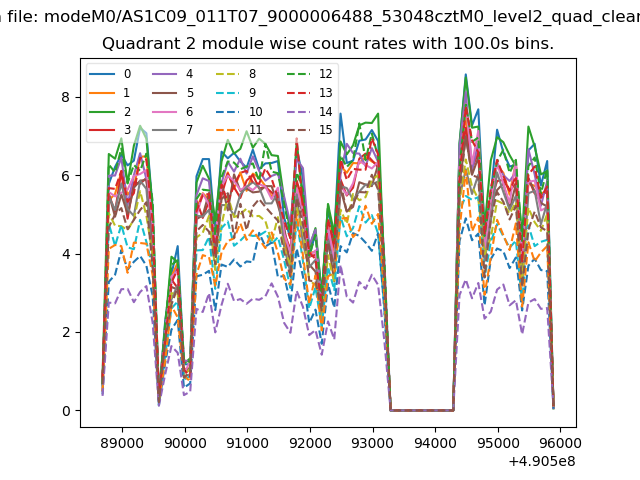
| Module-wise count rates for Quadrant B Data is divided into 100 sec bins |
 |
 |
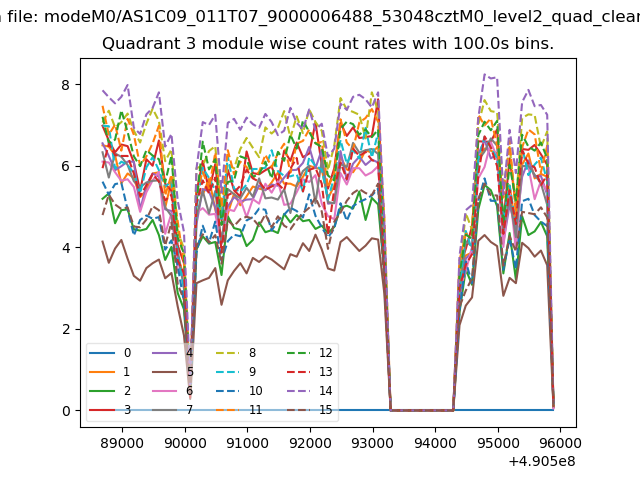
| Module-wise count rates for Quadrant C Data is divided into 100 sec bins |
 |
 |
| Module-wise count rates for Quadrant D Data is divided into 100 sec bins |
 |
 |
| Parameter | Plot |
|---|---|
| CZT HV Monitor |  |
| D_VDD | 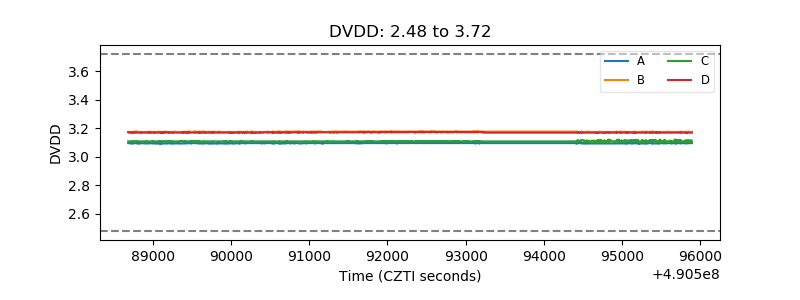 |
| Temperature 1 | 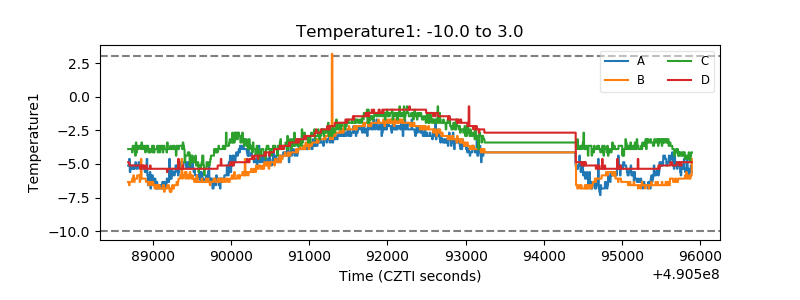 |
| Veto HV Monitor | 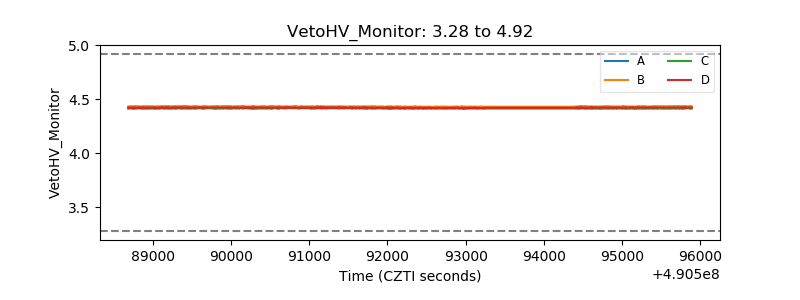 |
| Veto LLD | 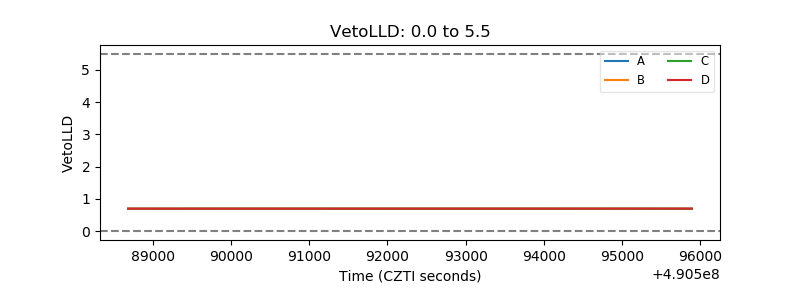 |
| Alpha Counter | 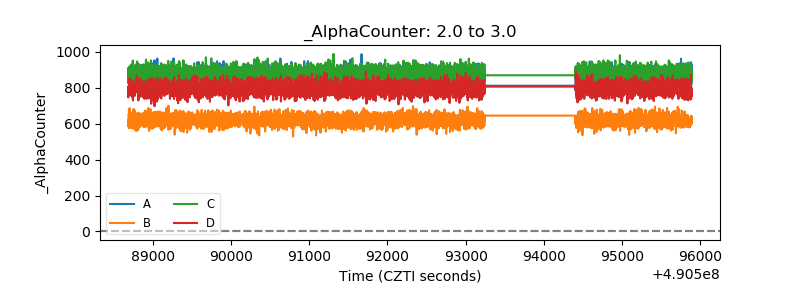 |
| _CPM_Rate | 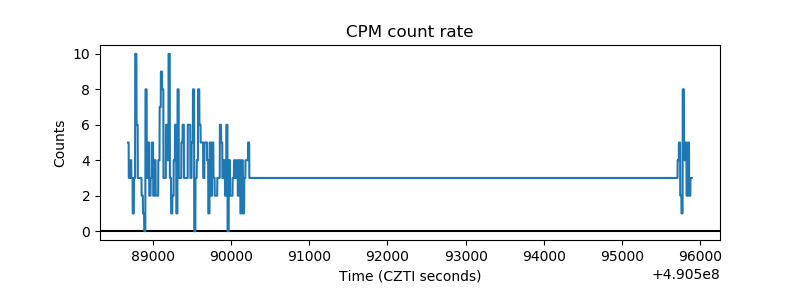 |
| CZT Counter | 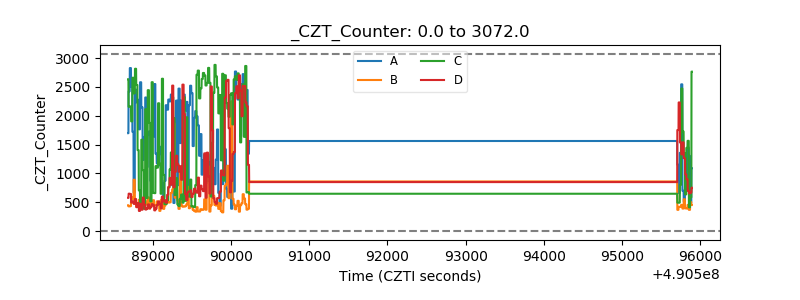 |
| +2.5 Volts monitor |  |
| +5 Volts monitor |  |
| _ROLL_ROT | 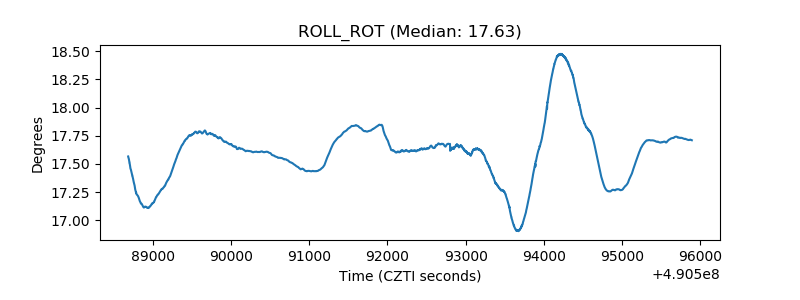 |
| _Roll_DEC | 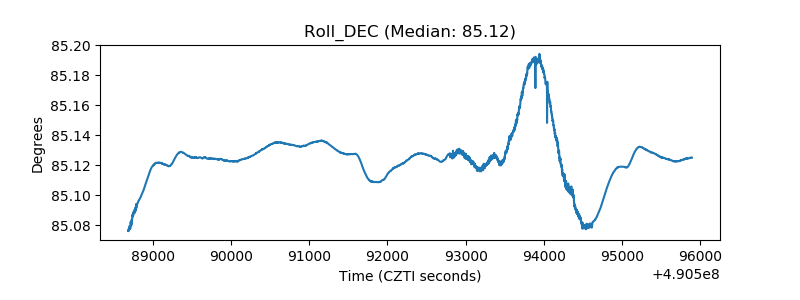 |
| _Roll_RA | 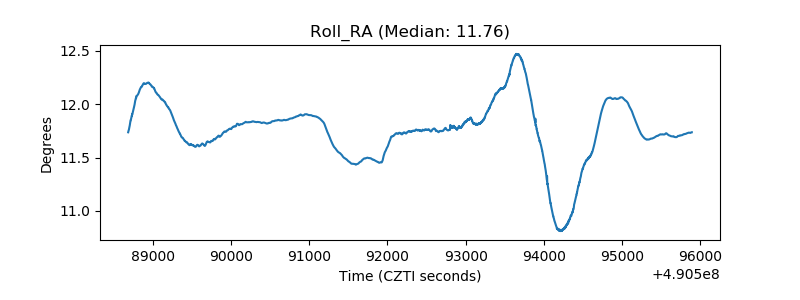 |
| Veto Counter | 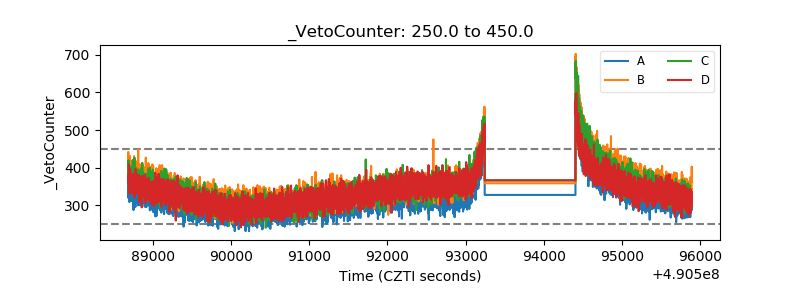 |