| Param | Original file | Final file |
|---|---|---|
| Filename | modeM0/AS1C09_011T07_9000006488_53049cztM0_level2.fits | modeM0/AS1C09_011T07_9000006488_53049cztM0_level2_quad_clean.evt |
| Size (bytes) | 545,005,440 | 81,544,320 |
| Size | 519.8 MB | 77.8 MB |
| Events in quadrant A | 5,855,490 | 518,186 |
| Events in quadrant B | 3,074,536 | 592,869 |
| Events in quadrant C | 5,618,619 | 476,850 |
| Events in quadrant D | 5,176,691 | 475,559 |
| Mode SS | |||
|---|---|---|---|
| Quadrant | BADHDUFLAG | Total packets | Discarded packets |
| A | 0 | 121 | 0 |
| B | 0 | 122 | 0 |
| C | 0 | 121 | 0 |
| D | 0 | 122 | 0 |
| Mode M9 | |||
|---|---|---|---|
| Quadrant | BADHDUFLAG | Total packets | Discarded packets |
| A | 0 | 11 | 0 |
| B | 0 | 11 | 0 |
| C | 0 | 11 | 0 |
| D | 0 | 11 | 0 |
| Mode M0 | |||
|---|---|---|---|
| Quadrant | BADHDUFLAG | Total packets | Discarded packets |
| A | 0 | 21697 | 206 |
| B | 0 | 13517 | 183 |
| C | 0 | 21337 | 578 |
| D | 0 | 20102 | 599 |
| Quadrant | Total seconds | Saturated seconds | Saturation percentage |
|---|---|---|---|
| A | 5822 | 674 | 11.576778% |
| B | 5809 | 152 | 2.616629% |
| C | 5765 | 741 | 12.853426% |
| D | 5759 | 426 | 7.397118% |
Noise dominated data is calculated using 1-second bins in cleaned event files. If a bin has >2000 counts, and if more than 50% of those come from <1% of pixels, then it is considered to be noise-dominated and hence unusable.
| Quadrant | # 1 sec bins | Bins with >0 counts | Bins with >2000 counts | High rate bins dominated by noise | Noise dominated (total time) | Noise dominated (detector-on time) | Marked lightcurve |
|---|---|---|---|---|---|---|---|
| A | 7059 | 5880 | 513 | 513 | 7.27% | 8.72% | 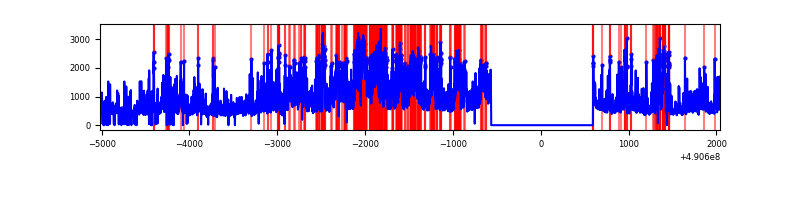 |
| B | 7059 | 5873 | 79 | 79 | 1.12% | 1.35% | 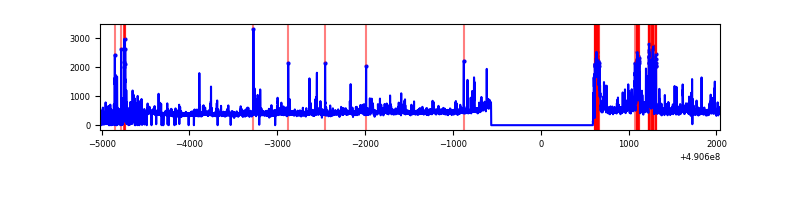 |
| C | 7059 | 5858 | 683 | 683 | 9.68% | 11.66% | 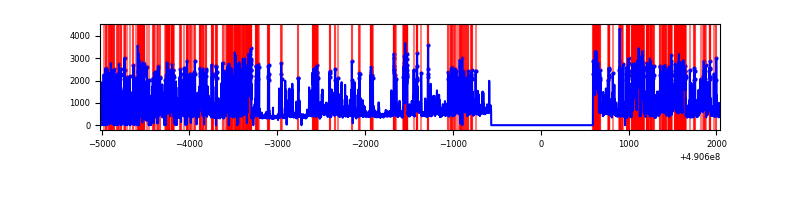 |
| D | 7060 | 5860 | 428 | 428 | 6.06% | 7.30% | 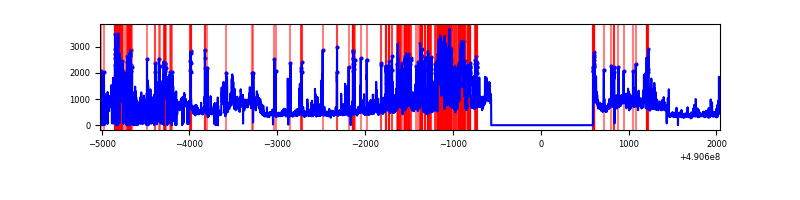 |
Top three noisy pixels from each quadrant. If the there are fewer than three noisy pixels in the level2.evt file, extra rows are filled as -1
| Pixel properties | Quadrant properties | ||||||
|---|---|---|---|---|---|---|---|
| Quadrant | DetID | PixID | Counts | Sigma | Mean | Median | Sigma |
| A | 9 | 191 | 2415705 | 16583.7 | 583 | 567 | 145.6 |
| A | 7 | 206 | 794295 | 5450.18 | 583 | 567 | 145.6 |
| A | 0 | 8 | 208928 | 1430.72 | 583 | 567 | 145.6 |
| B | 1 | 255 | 366353 | 2901.83 | 589 | 568 | 126.1 |
| B | 0 | 213 | 111888 | 883.12 | 589 | 568 | 126.1 |
| B | 10 | 247 | 66085 | 519.76 | 589 | 568 | 126.1 |
| C | 15 | 224 | 1566726 | 10402.69 | 541 | 536 | 150.6 |
| C | 13 | 3 | 1141752 | 7579.99 | 541 | 536 | 150.6 |
| C | 15 | 244 | 215362 | 1426.88 | 541 | 536 | 150.6 |
| D | 12 | 17 | 881090 | 5560.0 | 555 | 529 | 158.4 |
| D | 8 | 176 | 802153 | 5061.58 | 555 | 529 | 158.4 |
| D | 15 | 78 | 672223 | 4241.18 | 555 | 529 | 158.4 |
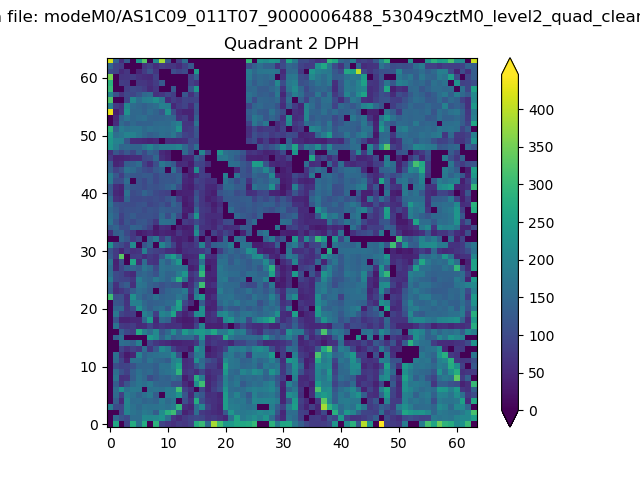
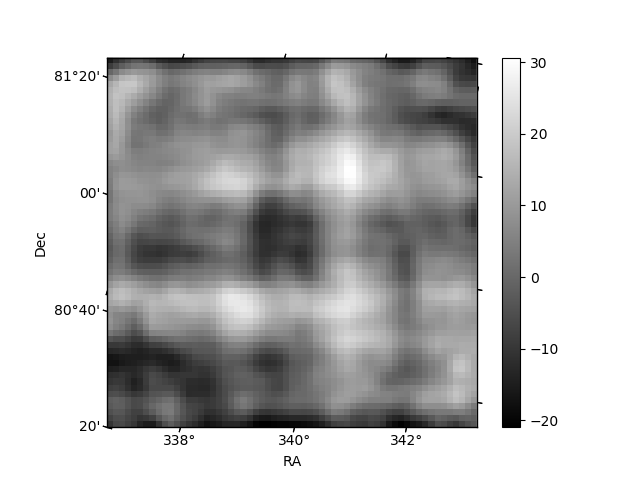
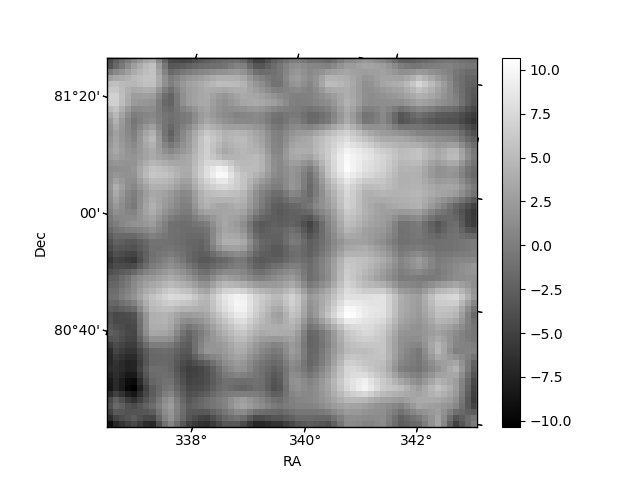
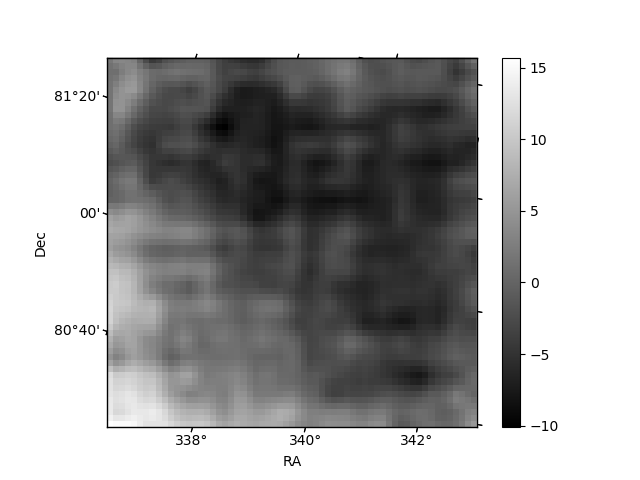
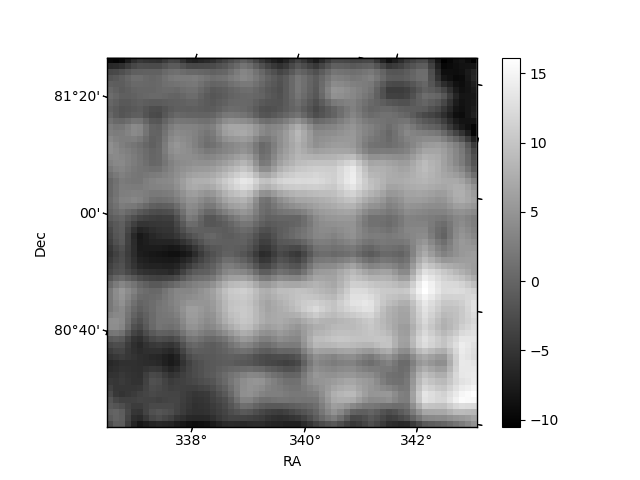
Histogram calculated using DETX and DETY for each event in the final _common_clean file
| Quadrant A | 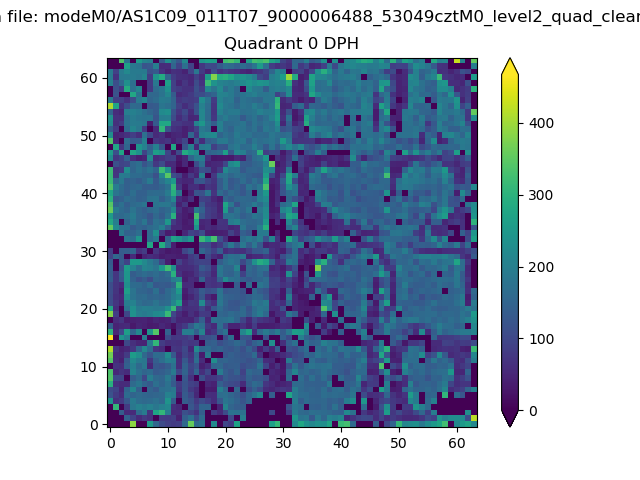 |
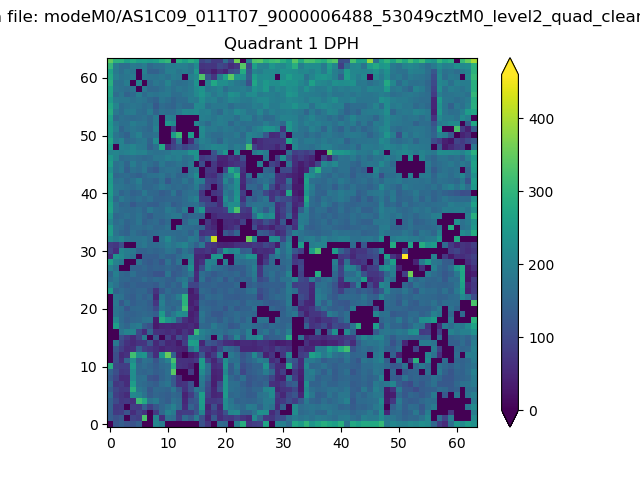 |
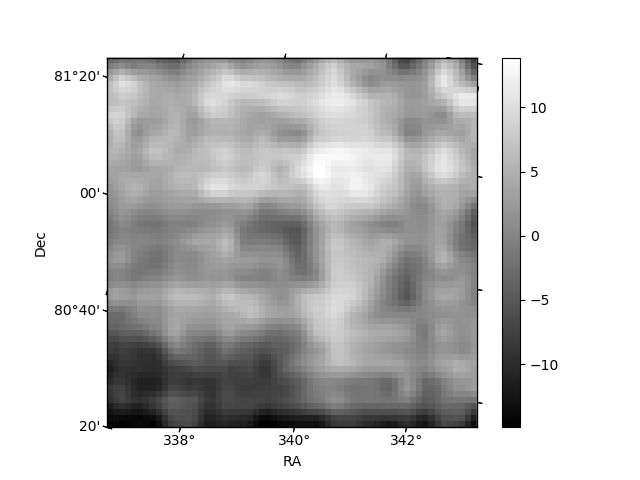
Quadrant B |
|---|---|---|---|
| Quadrant D | 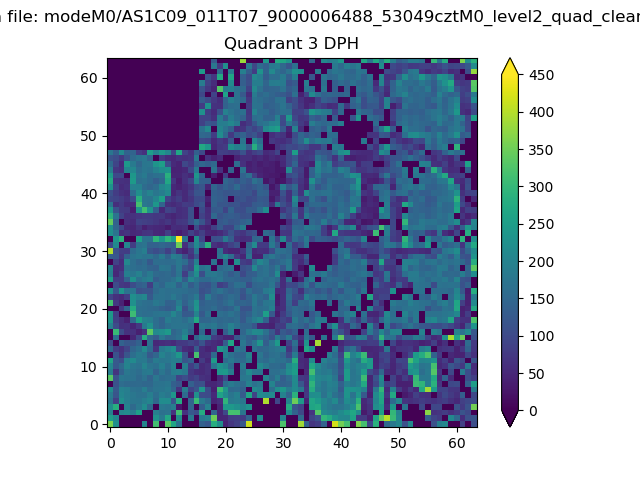 |
 |
Quadrant C |
| Plot type | Count rate plots | Images |
|---|---|---|
| Comparison with Poisson distribution Blue bars denote a histogram of data divided into 1 sec bins. Red curve is a Poisson curve with rate = median count rate of data. |
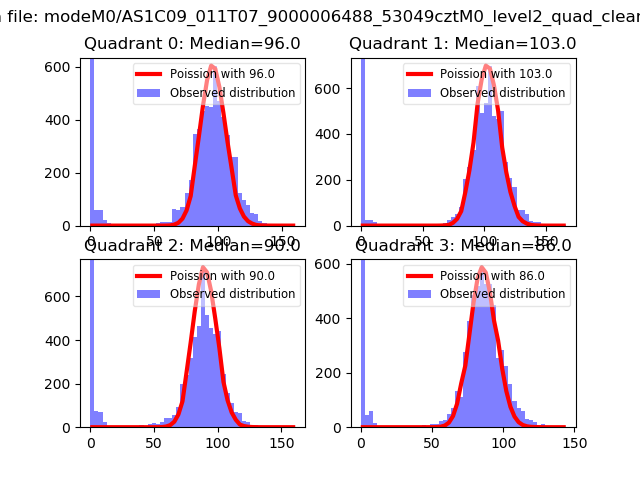 |
 |
| Quadrant-wise count rates Data is divided into 100 sec bins |
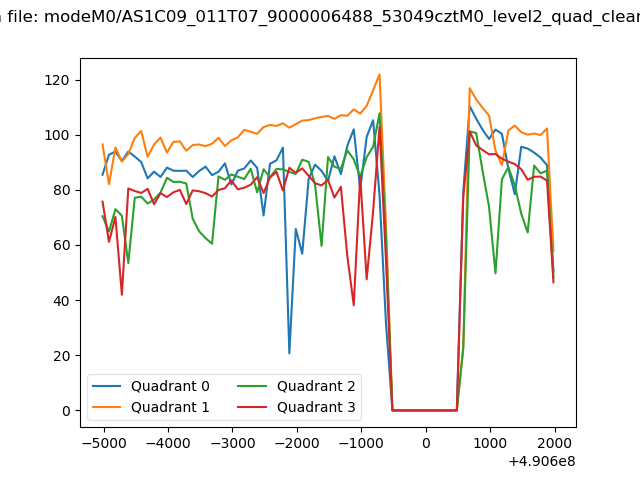 |
|
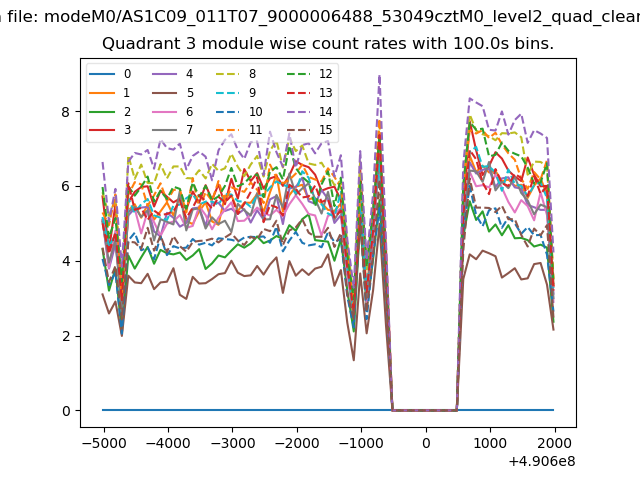
| Module-wise count rates for Quadrant A Data is divided into 100 sec bins |
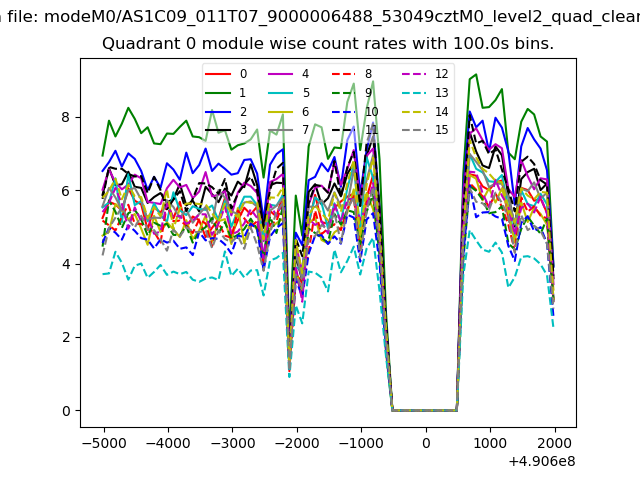 |
 |
| Module-wise count rates for Quadrant B Data is divided into 100 sec bins |
 |
 |
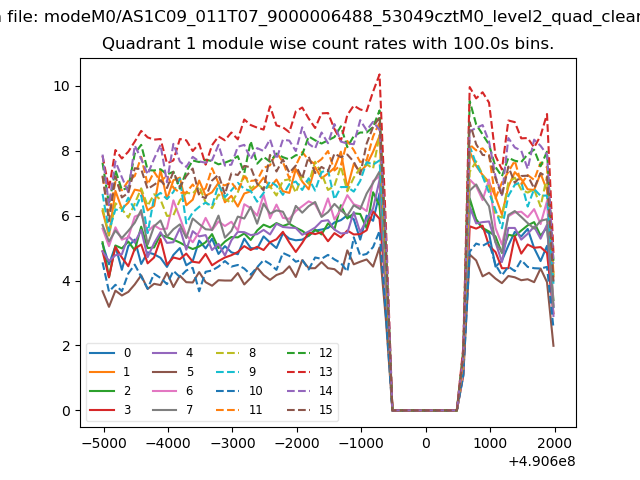
| Module-wise count rates for Quadrant C Data is divided into 100 sec bins |
 |
 |
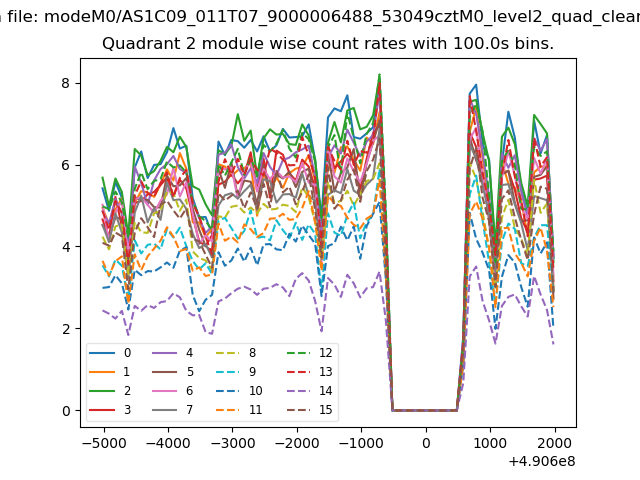
| Module-wise count rates for Quadrant D Data is divided into 100 sec bins |
 |
 |
| Parameter | Plot |
|---|---|
| CZT HV Monitor | 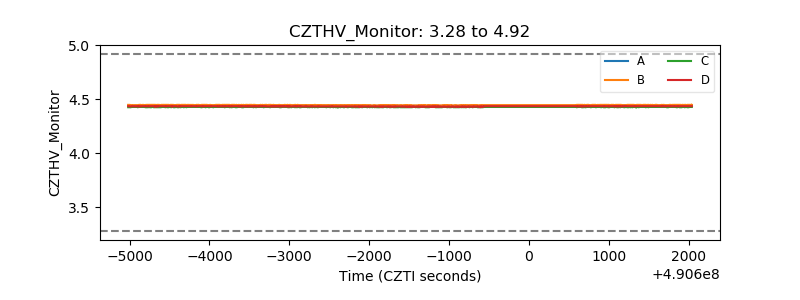 |
| D_VDD | 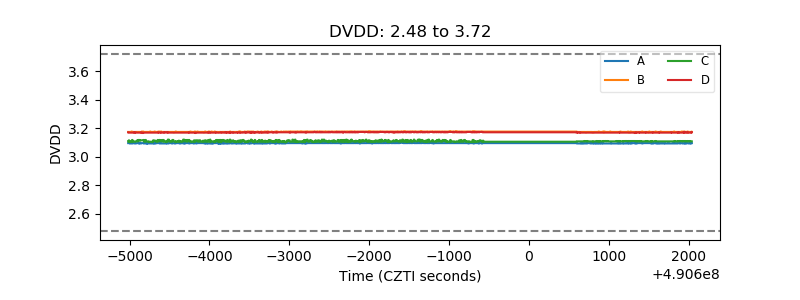 |
| Temperature 1 | 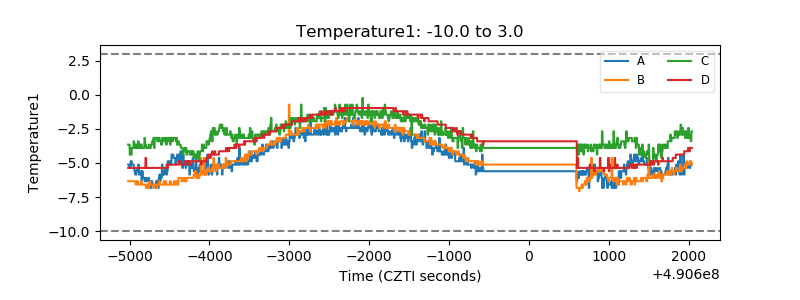 |
| Veto HV Monitor | 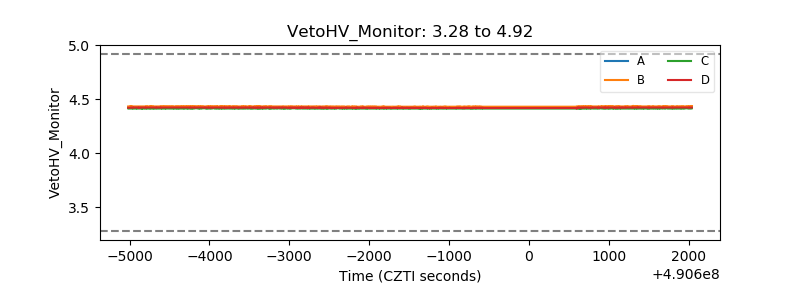 |
| Veto LLD | 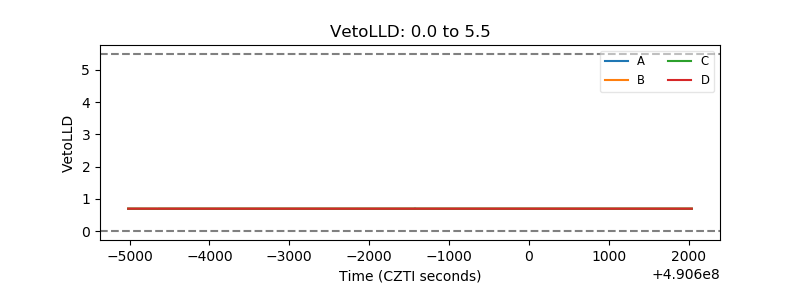 |
| Alpha Counter | 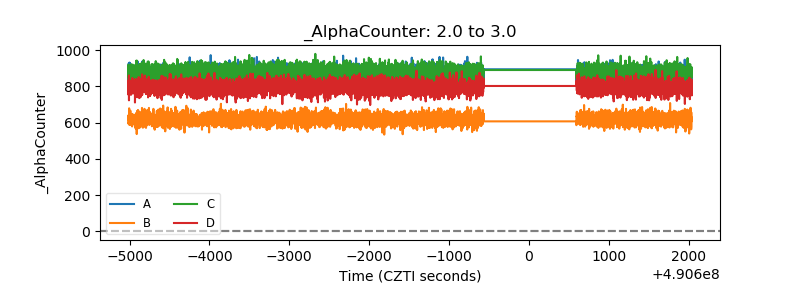 |
| _CPM_Rate | 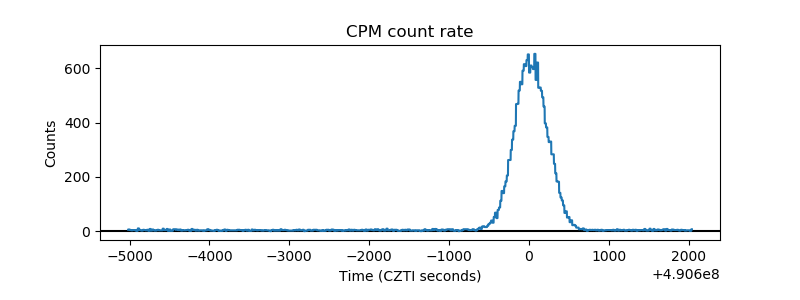 |
| CZT Counter | 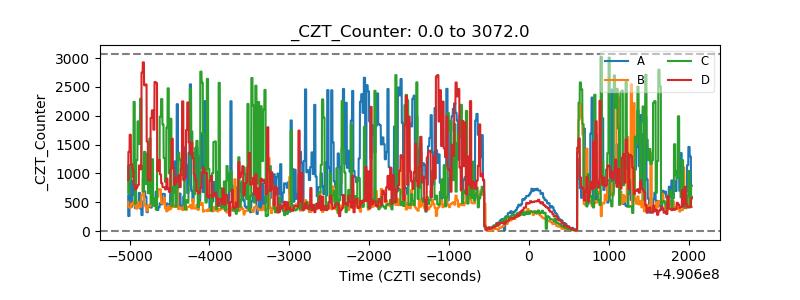 |
| +2.5 Volts monitor |  |
| +5 Volts monitor | 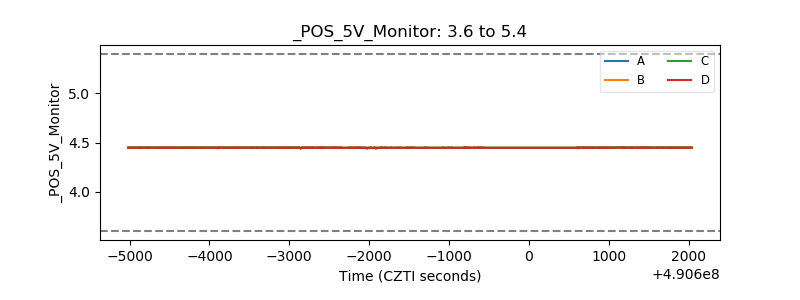 |
| _ROLL_ROT | 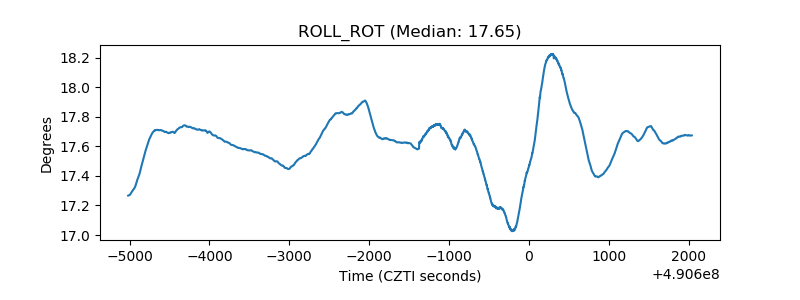 |
| _Roll_DEC | 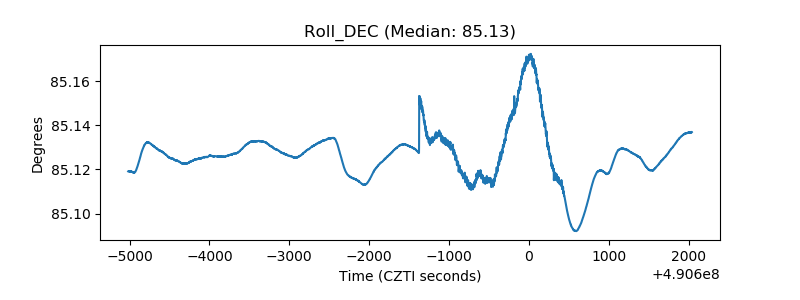 |
| _Roll_RA | 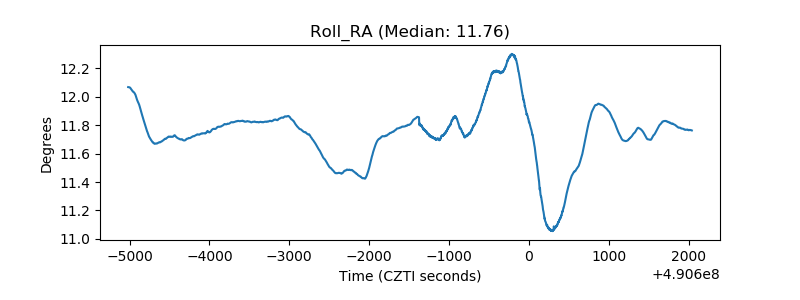 |
| Veto Counter | 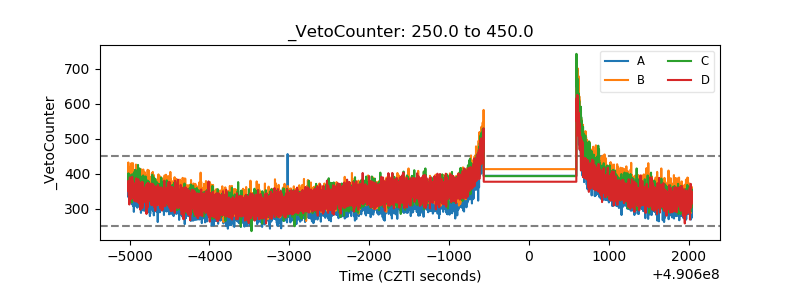 |