| Param | Original file | Final file |
|---|---|---|
| Filename | modeM0/AS1C09_011T07_9000006488_53050cztM0_level2.fits | modeM0/AS1C09_011T07_9000006488_53050cztM0_level2_quad_clean.evt |
| Size (bytes) | 749,580,480 | 86,601,600 |
| Size | 714.9 MB | 82.6 MB |
| Events in quadrant A | 7,144,741 | 575,833 |
| Events in quadrant B | 4,290,415 | 654,169 |
| Events in quadrant C | 9,508,184 | 411,099 |
| Events in quadrant D | 6,293,101 | 520,319 |
| Mode SS | |||
|---|---|---|---|
| Quadrant | BADHDUFLAG | Total packets | Discarded packets |
| A | 0 | 134 | 0 |
| B | 0 | 134 | 0 |
| C | 0 | 134 | 0 |
| D | 0 | 134 | 0 |
| Mode M9 | |||
|---|---|---|---|
| Quadrant | BADHDUFLAG | Total packets | Discarded packets |
| A | 0 | 11 | 0 |
| B | 0 | 11 | 0 |
| C | 0 | 11 | 0 |
| D | 0 | 11 | 0 |
| Mode M0 | |||
|---|---|---|---|
| Quadrant | BADHDUFLAG | Total packets | Discarded packets |
| A | 0 | 25834 | 1 |
| B | 0 | 17357 | 1 |
| C | 0 | 32842 | 1 |
| D | 0 | 23378 | 3 |
| Quadrant | Total seconds | Saturated seconds | Saturation percentage |
|---|---|---|---|
| A | 6602 | 902 | 13.662527% |
| B | 6603 | 355 | 5.376344% |
| C | 6603 | 2401 | 36.362260% |
| D | 6602 | 818 | 12.390185% |
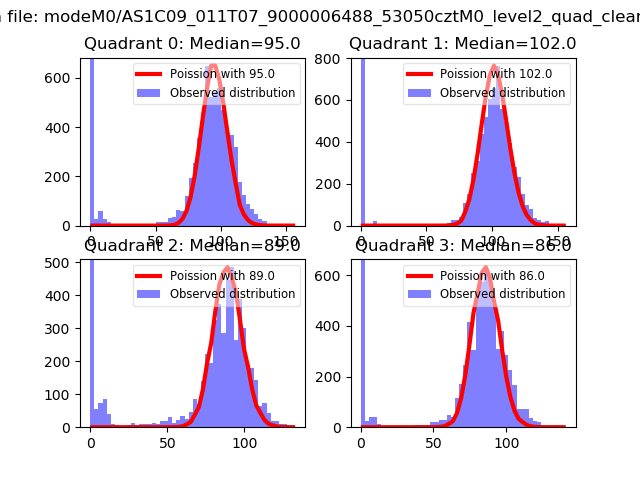
Noise dominated data is calculated using 1-second bins in cleaned event files. If a bin has >2000 counts, and if more than 50% of those come from <1% of pixels, then it is considered to be noise-dominated and hence unusable.
| Quadrant | # 1 sec bins | Bins with >0 counts | Bins with >2000 counts | High rate bins dominated by noise | Noise dominated (total time) | Noise dominated (detector-on time) | Marked lightcurve |
|---|---|---|---|---|---|---|---|
| A | 7692 | 6603 | 771 | 771 | 10.02% | 11.68% | 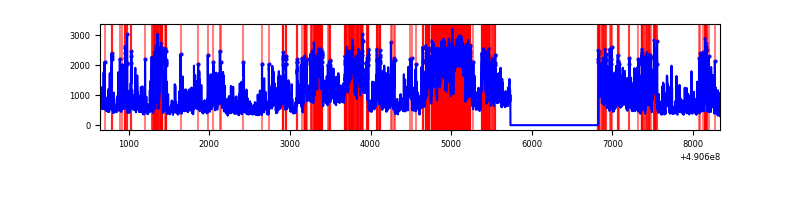 |
| B | 7693 | 6604 | 197 | 197 | 2.56% | 2.98% | 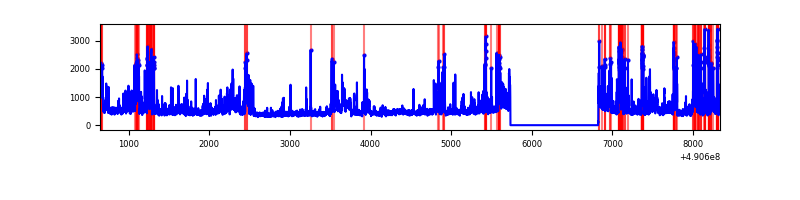 |
| C | 7693 | 6604 | 2233 | 2233 | 29.03% | 33.81% | 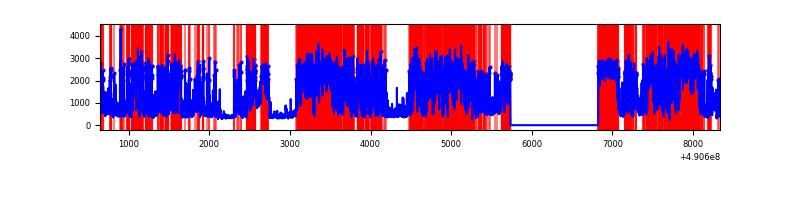 |
| D | 7692 | 6603 | 839 | 839 | 10.91% | 12.71% | 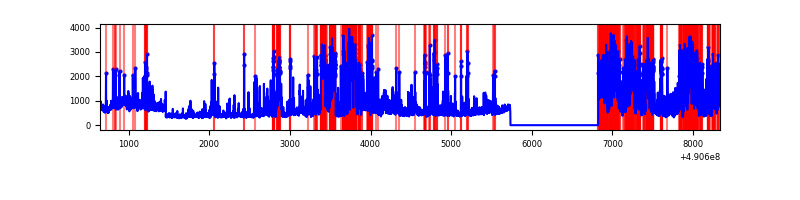 |
Top three noisy pixels from each quadrant. If the there are fewer than three noisy pixels in the level2.evt file, extra rows are filled as -1
| Pixel properties | Quadrant properties | ||||||
|---|---|---|---|---|---|---|---|
| Quadrant | DetID | PixID | Counts | Sigma | Mean | Median | Sigma |
| A | 9 | 191 | 3048496 | 18495.23 | 660 | 643 | 164.8 |
| A | 7 | 206 | 557169 | 3377.16 | 660 | 643 | 164.8 |
| A | 15 | 190 | 359666 | 2178.65 | 660 | 643 | 164.8 |
| B | 1 | 255 | 764534 | 5384.98 | 669 | 645 | 141.9 |
| B | 10 | 247 | 382976 | 2695.21 | 669 | 645 | 141.9 |
| B | 0 | 213 | 105300 | 737.76 | 669 | 645 | 141.9 |
| C | 12 | 254 | 2721538 | 18261.04 | 541 | 537 | 149.0 |
| C | 1 | 241 | 2049927 | 13753.76 | 541 | 537 | 149.0 |
| C | 15 | 224 | 1253989 | 8412.1 | 541 | 537 | 149.0 |
| D | 8 | 176 | 2029332 | 11320.34 | 627 | 597 | 179.2 |
| D | 12 | 17 | 565693 | 3153.24 | 627 | 597 | 179.2 |
| D | 15 | 78 | 314254 | 1750.21 | 627 | 597 | 179.2 |
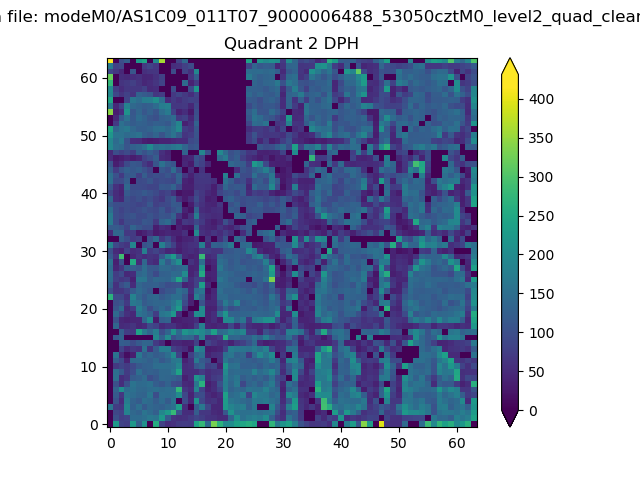
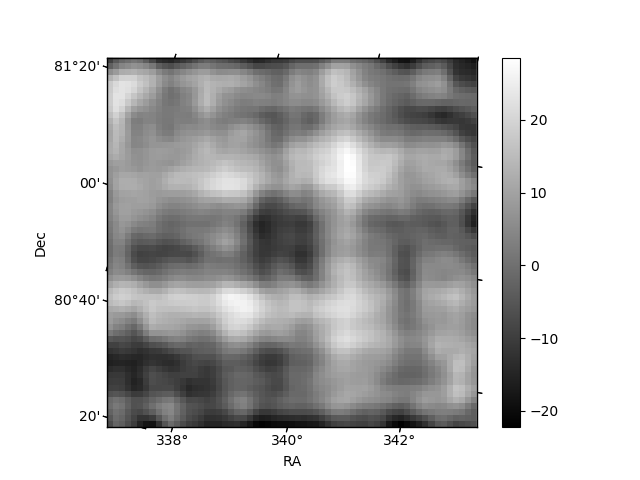
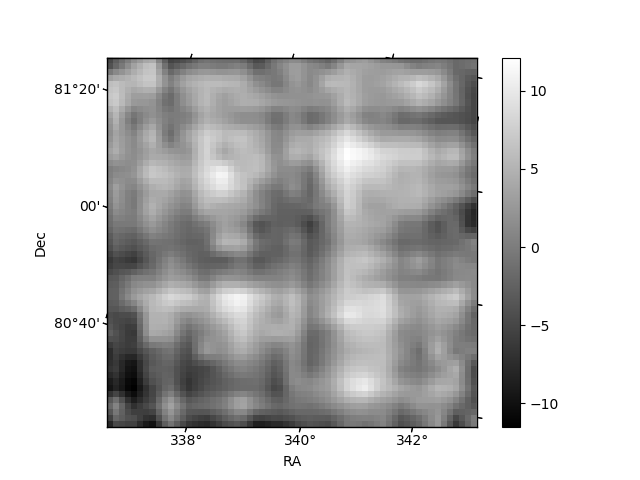
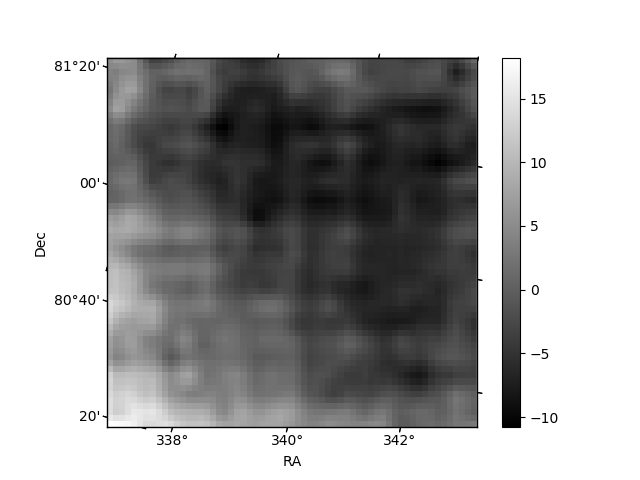
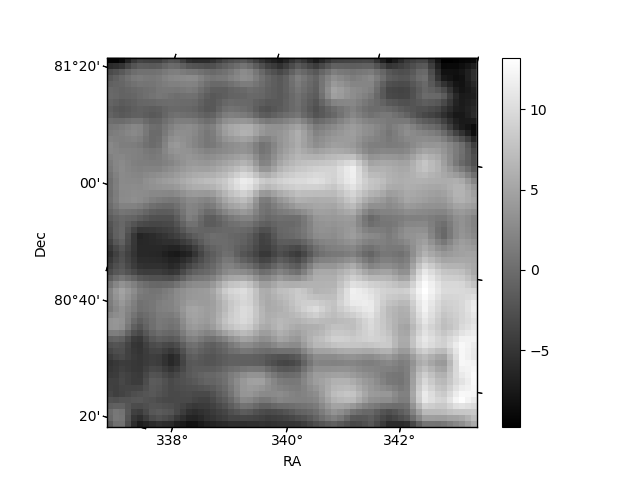
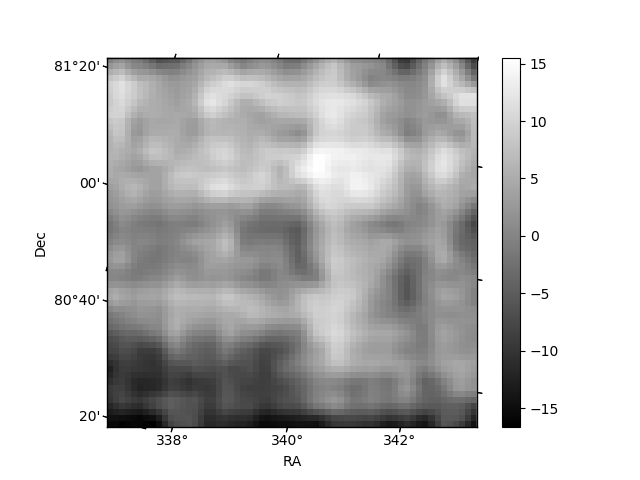
Histogram calculated using DETX and DETY for each event in the final _common_clean file
| Quadrant A | 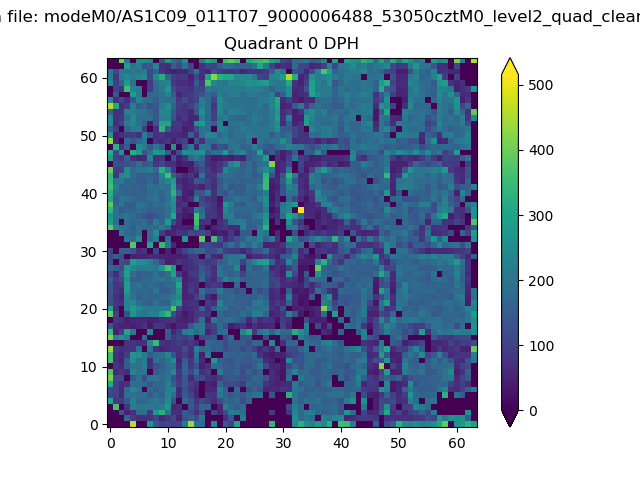 |
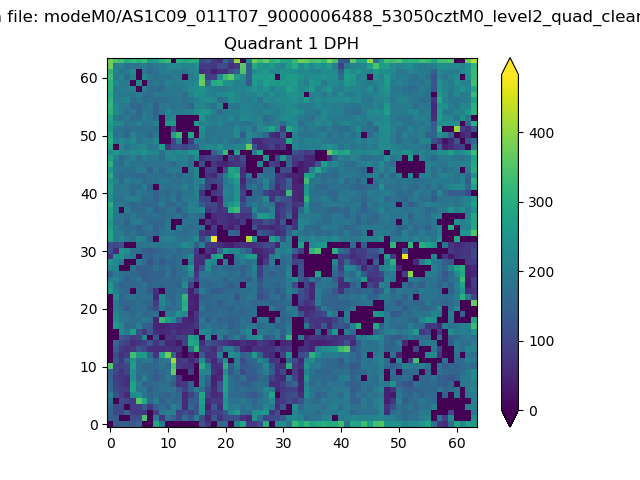 |
Quadrant B |
|---|---|---|---|
| Quadrant D | 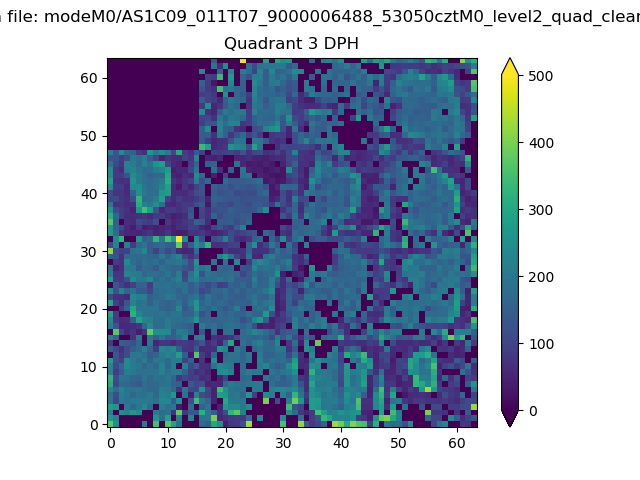 |
 |
Quadrant C |
| Plot type | Count rate plots | Images |
|---|---|---|
| Comparison with Poisson distribution Blue bars denote a histogram of data divided into 1 sec bins. Red curve is a Poisson curve with rate = median count rate of data. |
 |
 |
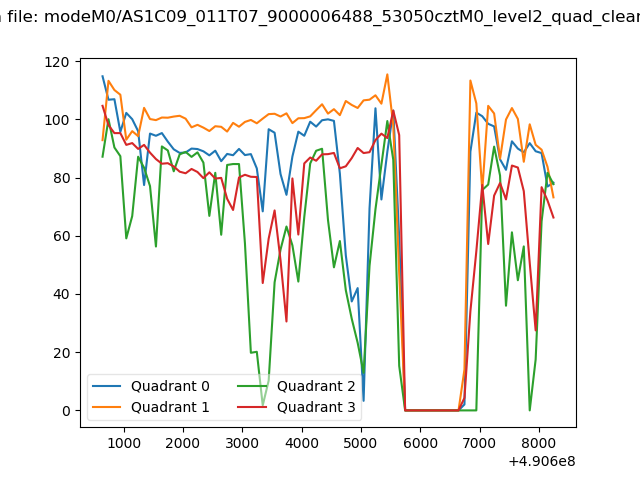
| Quadrant-wise count rates Data is divided into 100 sec bins |
 |
|
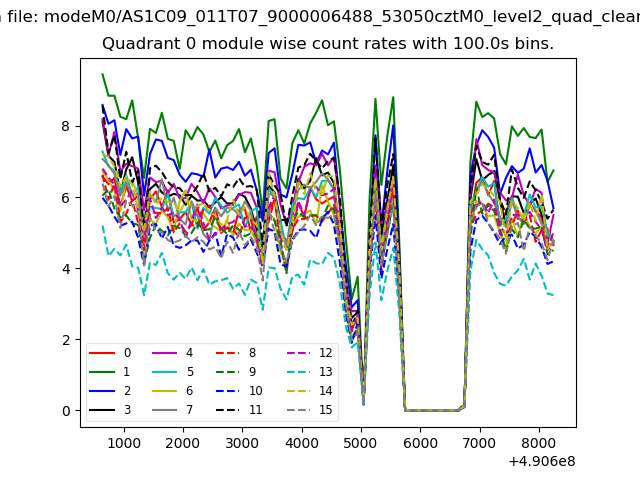
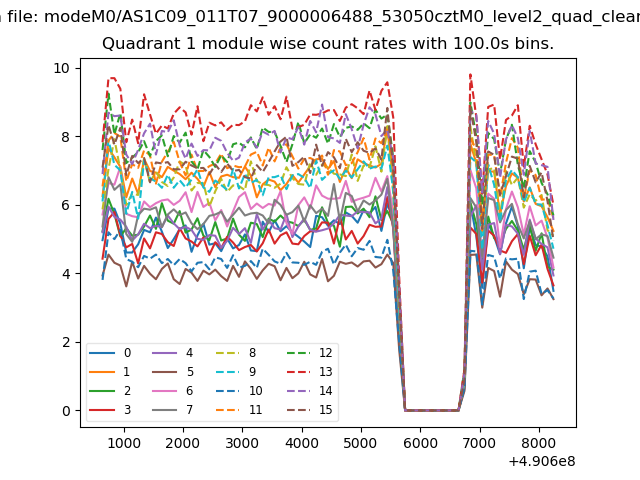
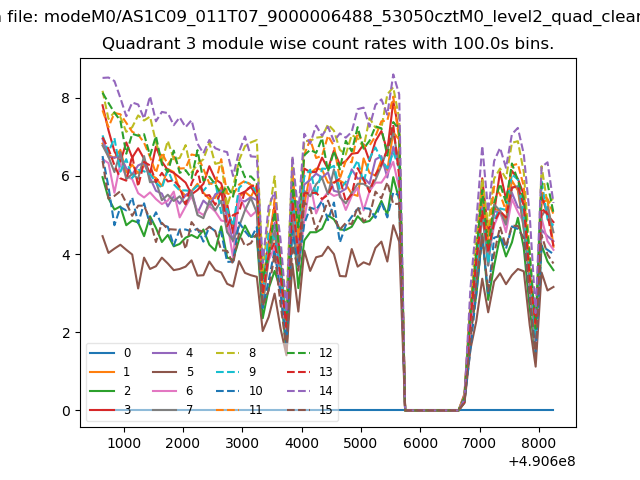
| Module-wise count rates for Quadrant A Data is divided into 100 sec bins |
 |
 |
| Module-wise count rates for Quadrant B Data is divided into 100 sec bins |
 |
 |
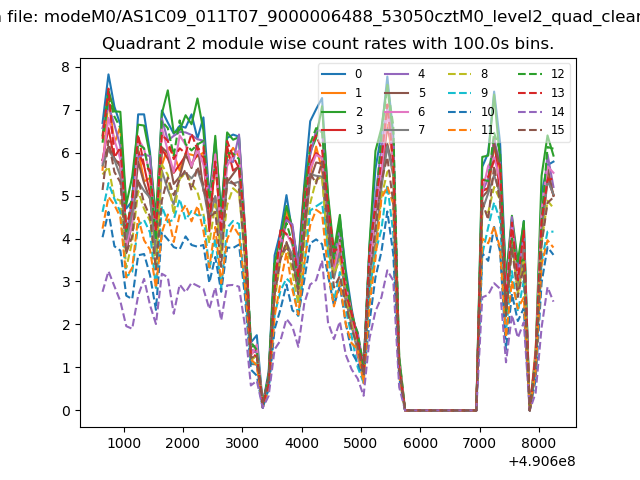
| Module-wise count rates for Quadrant C Data is divided into 100 sec bins |
 |
 |
| Module-wise count rates for Quadrant D Data is divided into 100 sec bins |
 |
 |
| Parameter | Plot |
|---|---|
| CZT HV Monitor | 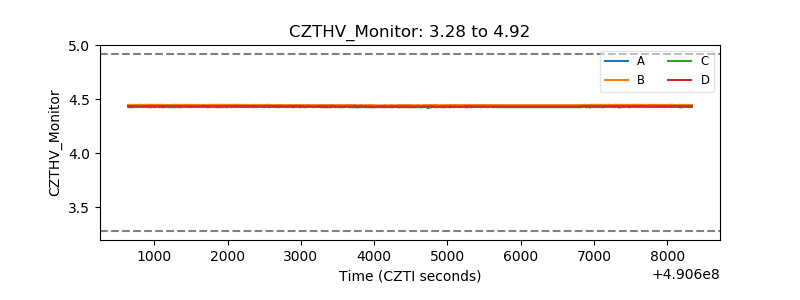 |
| D_VDD | 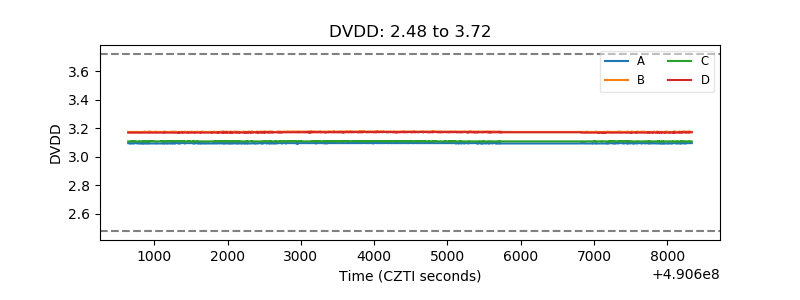 |
| Temperature 1 | 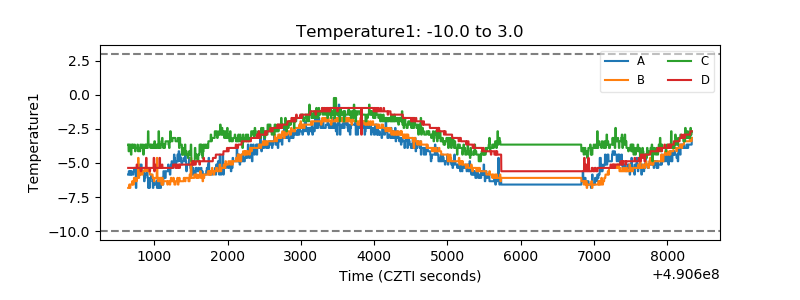 |
| Veto HV Monitor | 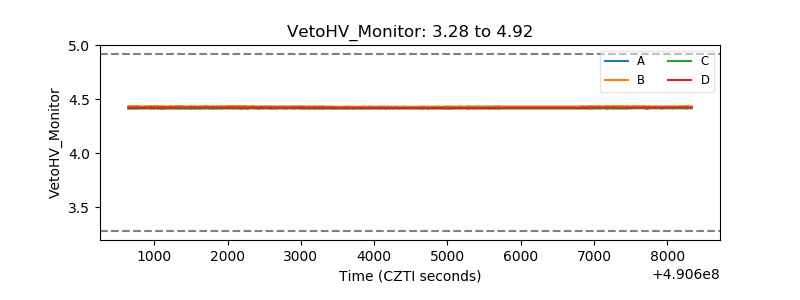 |
| Veto LLD | 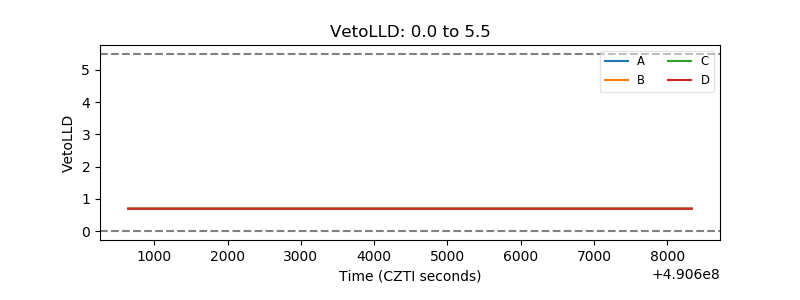 |
| Alpha Counter | 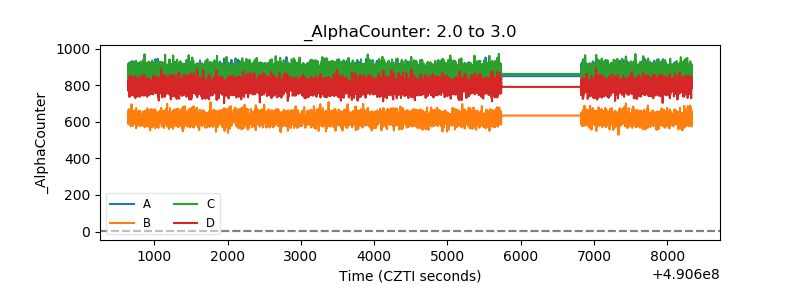 |
| _CPM_Rate | 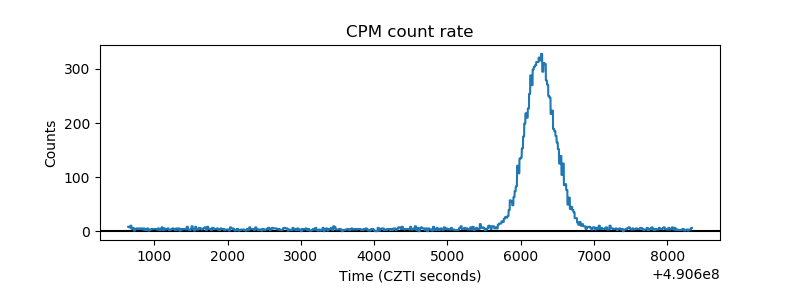 |
| CZT Counter | 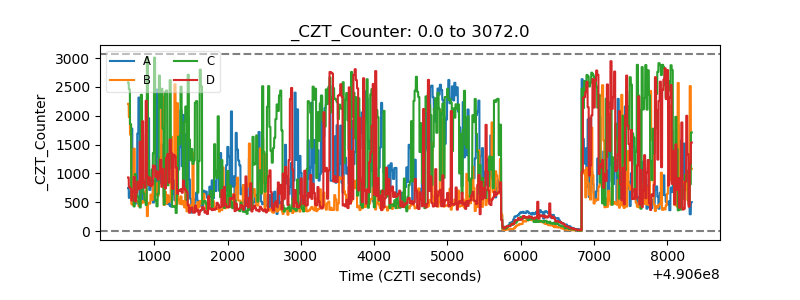 |
| +2.5 Volts monitor |  |
| +5 Volts monitor |  |
| _ROLL_ROT | 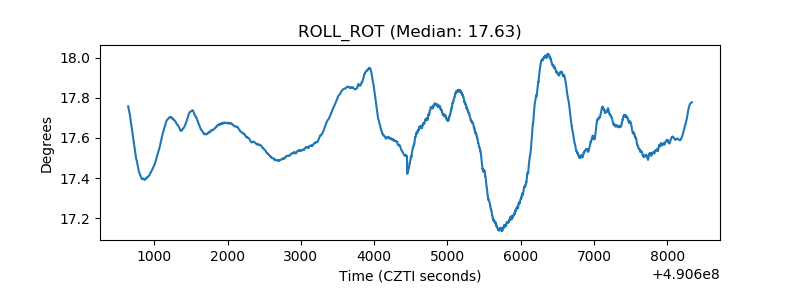 |
| _Roll_DEC | 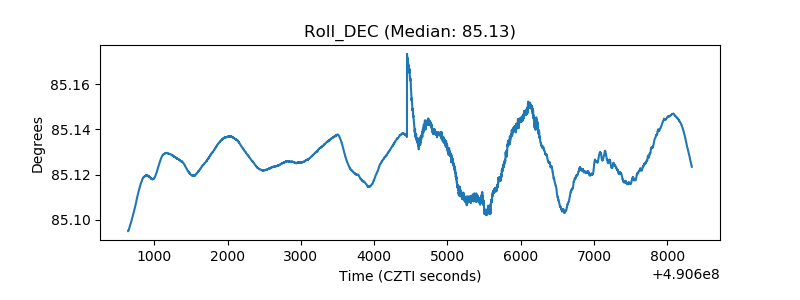 |
| _Roll_RA | 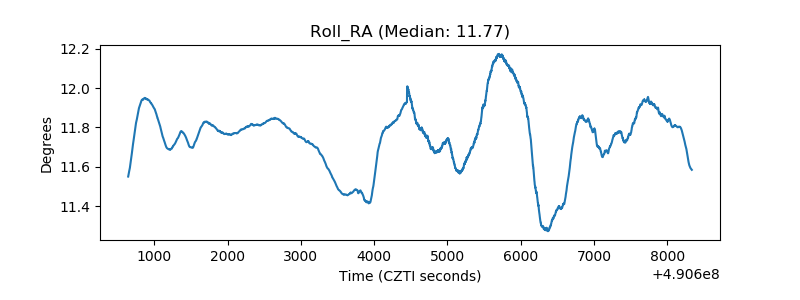 |
| Veto Counter | 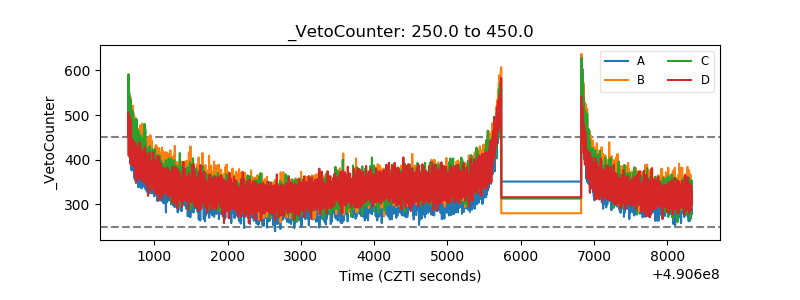 |