| Param | Original file | Final file |
|---|---|---|
| Filename | modeM0/AS1C09_011T07_9000006488_53051cztM0_level2.fits | modeM0/AS1C09_011T07_9000006488_53051cztM0_level2_quad_clean.evt |
| Size (bytes) | 859,273,920 | 68,754,240 |
| Size | 819.5 MB | 65.6 MB |
| Events in quadrant A | 5,791,093 | 523,726 |
| Events in quadrant B | 5,387,177 | 528,961 |
| Events in quadrant C | 12,157,785 | 196,599 |
| Events in quadrant D | 8,002,090 | 407,393 |
| Mode SS | |||
|---|---|---|---|
| Quadrant | BADHDUFLAG | Total packets | Discarded packets |
| A | 0 | 126 | 0 |
| B | 0 | 126 | 0 |
| C | 0 | 126 | 0 |
| D | 0 | 126 | 0 |
| Mode M9 | |||
|---|---|---|---|
| Quadrant | BADHDUFLAG | Total packets | Discarded packets |
| A | 0 | 8 | 0 |
| B | 0 | 8 | 0 |
| C | 0 | 8 | 0 |
| D | 0 | 8 | 0 |
| Mode M0 | |||
|---|---|---|---|
| Quadrant | BADHDUFLAG | Total packets | Discarded packets |
| A | 0 | 21441 | 1 |
| B | 0 | 20236 | 1 |
| C | 0 | 40250 | 1 |
| D | 0 | 27950 | 1 |
| Quadrant | Total seconds | Saturated seconds | Saturation percentage |
|---|---|---|---|
| A | 6070 | 739 | 12.174629% |
| B | 6070 | 997 | 16.425041% |
| C | 6071 | 4001 | 65.903476% |
| D | 6071 | 1563 | 25.745347% |
Noise dominated data is calculated using 1-second bins in cleaned event files. If a bin has >2000 counts, and if more than 50% of those come from <1% of pixels, then it is considered to be noise-dominated and hence unusable.
| Quadrant | # 1 sec bins | Bins with >0 counts | Bins with >2000 counts | High rate bins dominated by noise | Noise dominated (total time) | Noise dominated (detector-on time) | Marked lightcurve |
|---|---|---|---|---|---|---|---|
| A | 6955 | 6071 | 577 | 577 | 8.30% | 9.50% | 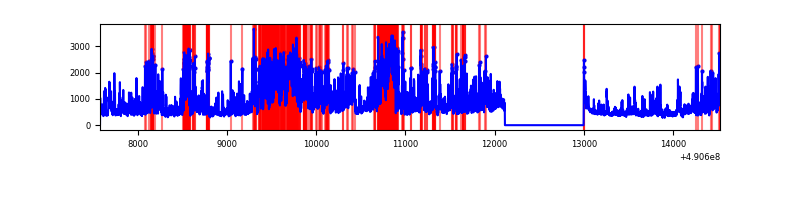 |
| B | 6955 | 6071 | 721 | 721 | 10.37% | 11.88% | 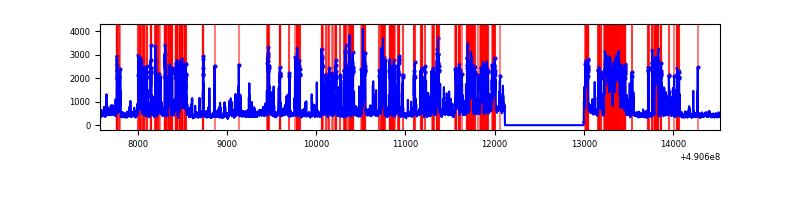 |
| C | 6956 | 6072 | 3785 | 3785 | 54.41% | 62.34% | 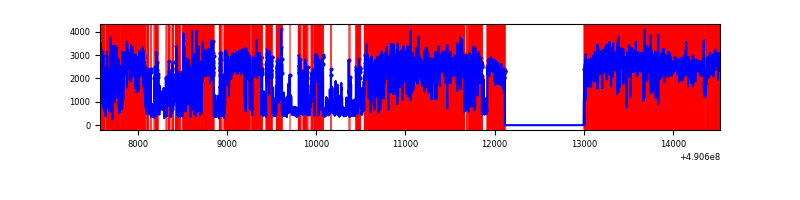 |
| D | 6956 | 6072 | 1508 | 1508 | 21.68% | 24.84% | 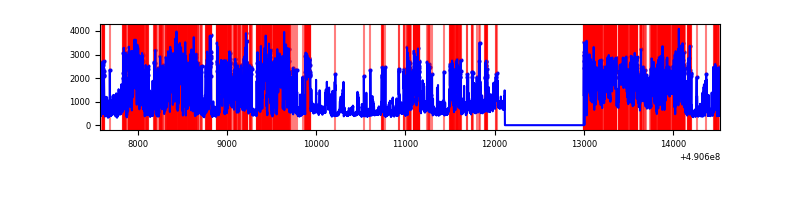 |
Top three noisy pixels from each quadrant. If the there are fewer than three noisy pixels in the level2.evt file, extra rows are filled as -1
| Pixel properties | Quadrant properties | ||||||
|---|---|---|---|---|---|---|---|
| Quadrant | DetID | PixID | Counts | Sigma | Mean | Median | Sigma |
| A | 9 | 191 | 2215661 | 14783.13 | 606 | 592 | 149.8 |
| A | 3 | 114 | 513857 | 3425.47 | 606 | 592 | 149.8 |
| A | 7 | 206 | 259518 | 1728.04 | 606 | 592 | 149.8 |
| B | 1 | 255 | 1969446 | 15901.83 | 576 | 555 | 123.8 |
| B | 10 | 63 | 582005 | 4696.1 | 576 | 555 | 123.8 |
| B | 10 | 247 | 174512 | 1404.97 | 576 | 555 | 123.8 |
| C | 1 | 241 | 7521308 | 71852.67 | 378 | 374 | 104.7 |
| C | 15 | 158 | 879048 | 8394.58 | 378 | 374 | 104.7 |
| C | 15 | 224 | 776840 | 7418.12 | 378 | 374 | 104.7 |
| D | 12 | 17 | 2100446 | 13474.1 | 546 | 522 | 155.8 |
| D | 8 | 176 | 2090934 | 13413.06 | 546 | 522 | 155.8 |
| D | 2 | 172 | 1011752 | 6488.53 | 546 | 522 | 155.8 |
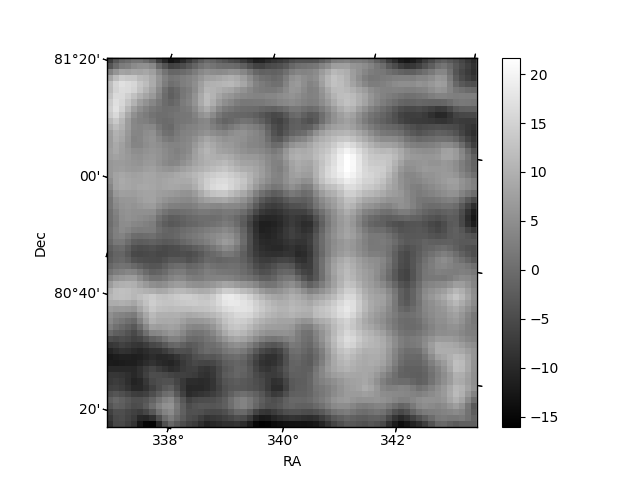
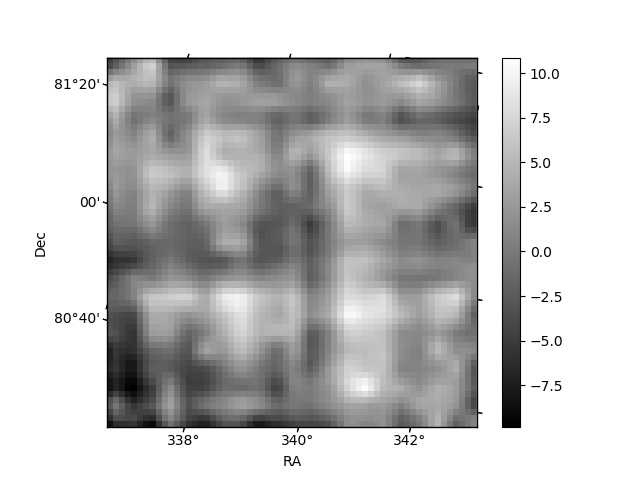
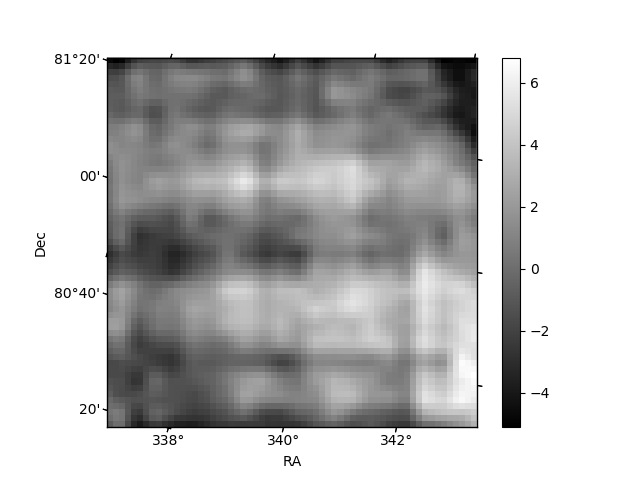
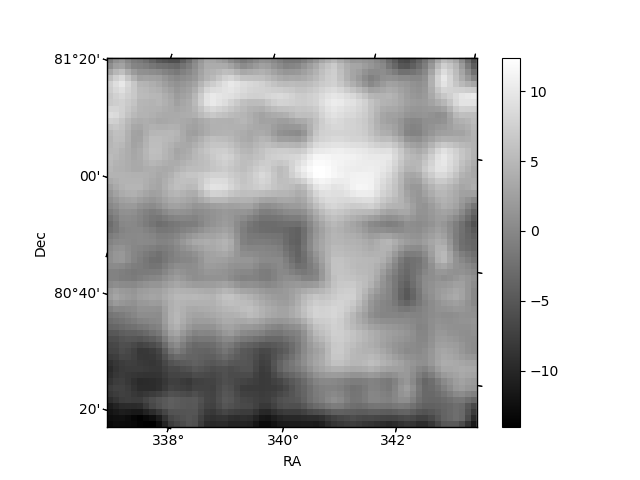
Histogram calculated using DETX and DETY for each event in the final _common_clean file
| Quadrant A | 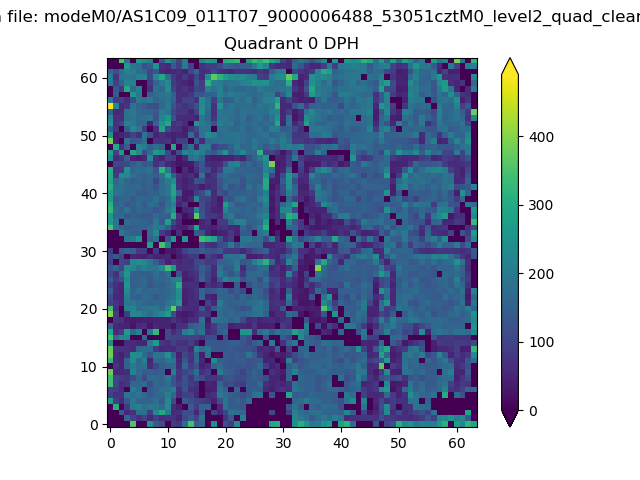 |
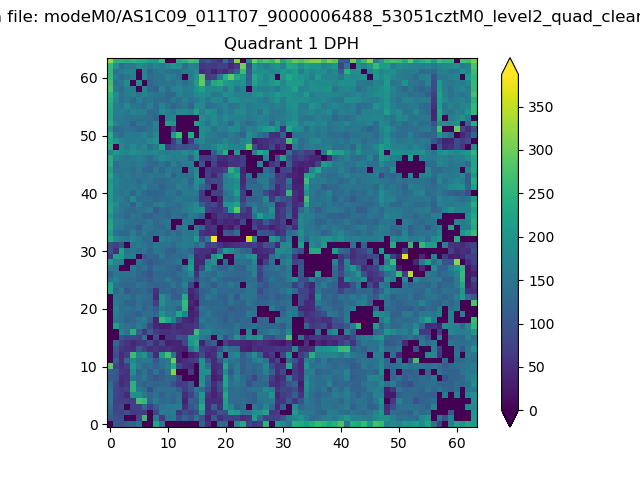 |
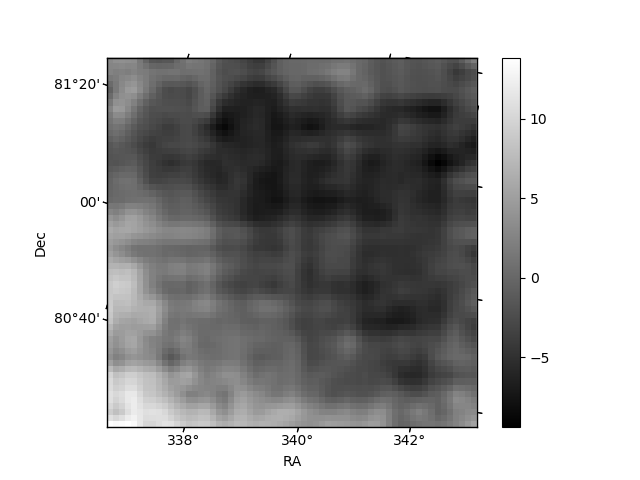
Quadrant B |
|---|---|---|---|
| Quadrant D | 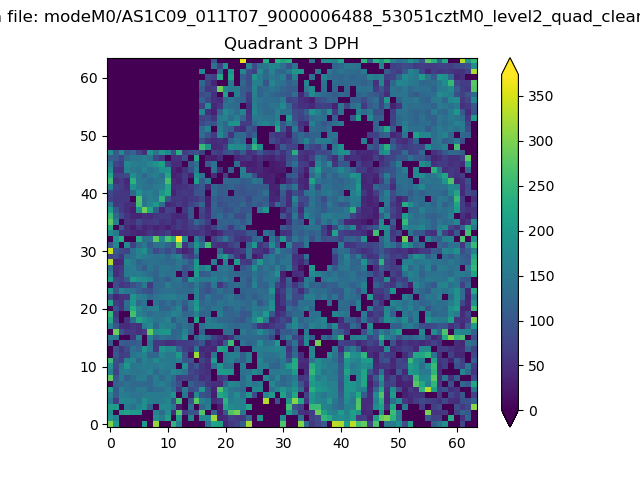 |
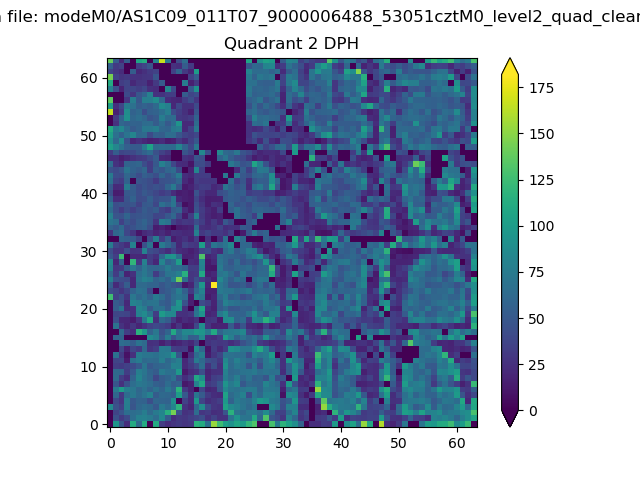 |
Quadrant C |
| Plot type | Count rate plots | Images |
|---|---|---|
| Comparison with Poisson distribution Blue bars denote a histogram of data divided into 1 sec bins. Red curve is a Poisson curve with rate = median count rate of data. |
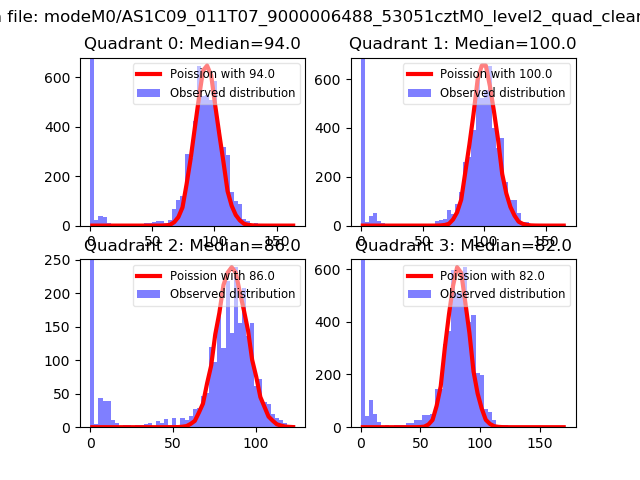 |
 |
| Quadrant-wise count rates Data is divided into 100 sec bins |
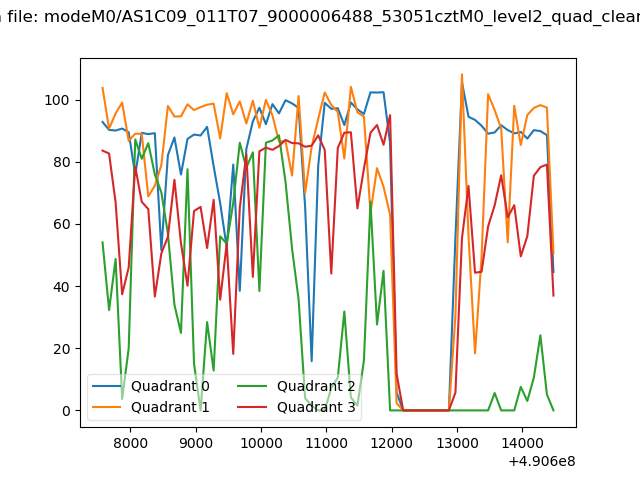 |
|
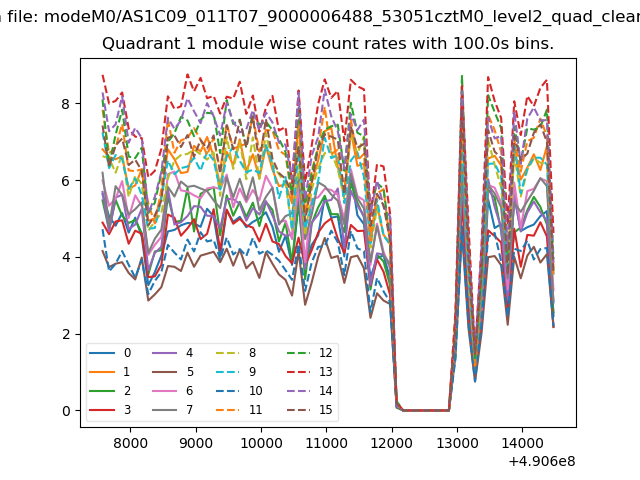
| Module-wise count rates for Quadrant A Data is divided into 100 sec bins |
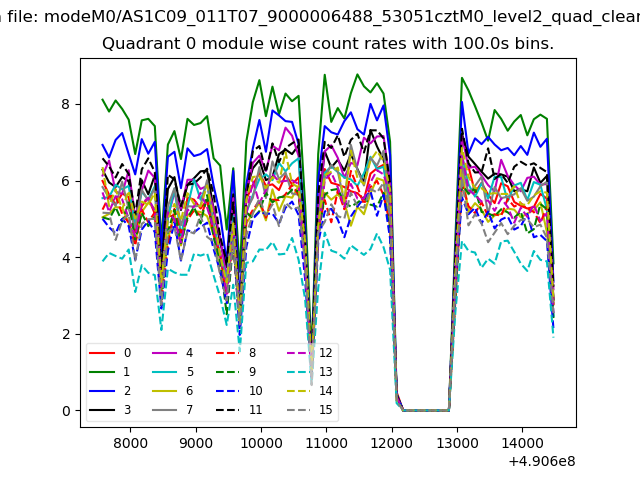 |
 |
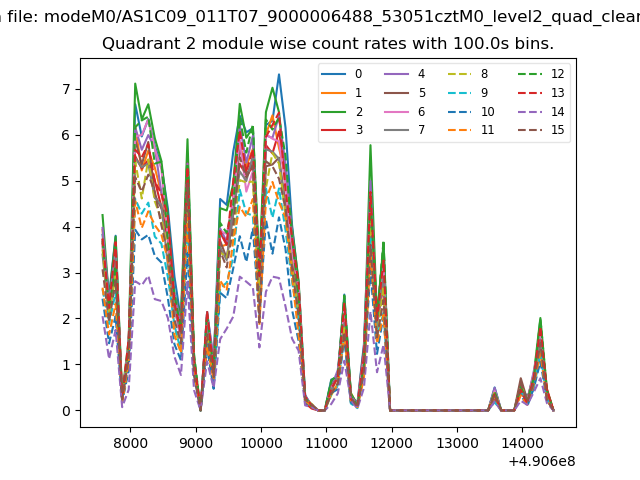
| Module-wise count rates for Quadrant B Data is divided into 100 sec bins |
 |
 |
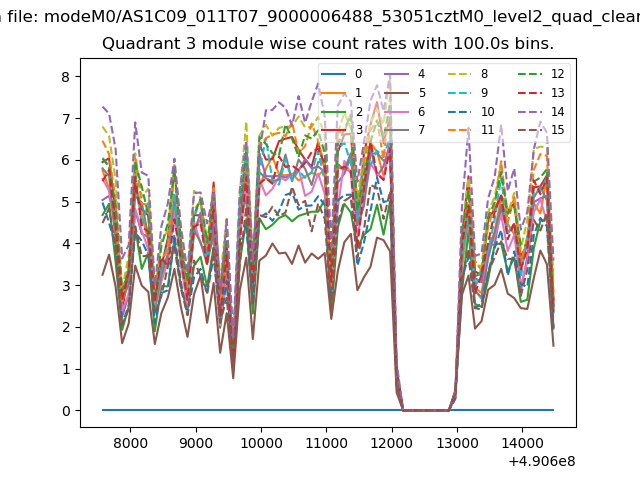
| Module-wise count rates for Quadrant C Data is divided into 100 sec bins |
 |
 |
| Module-wise count rates for Quadrant D Data is divided into 100 sec bins |
 |
 |
| Parameter | Plot |
|---|---|
| CZT HV Monitor | 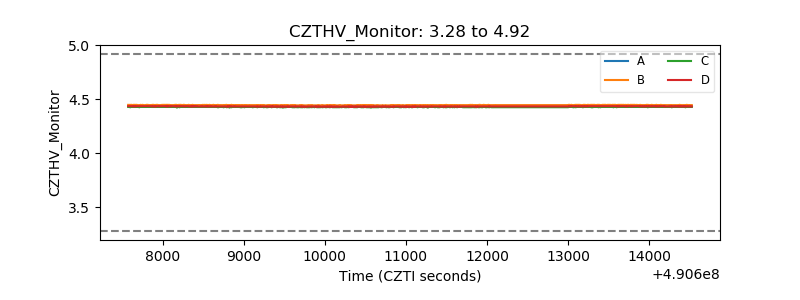 |
| D_VDD | 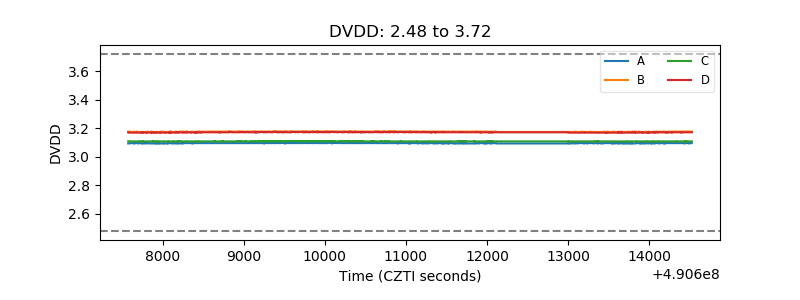 |
| Temperature 1 | 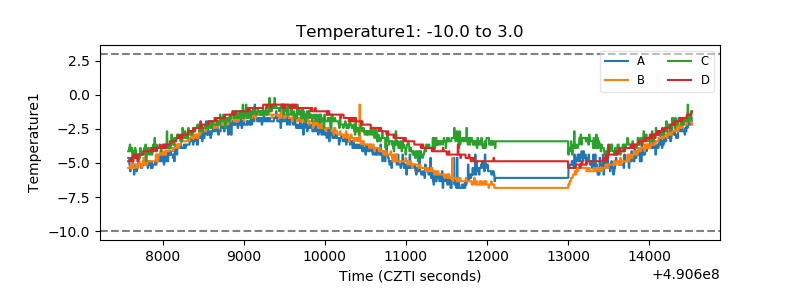 |
| Veto HV Monitor | 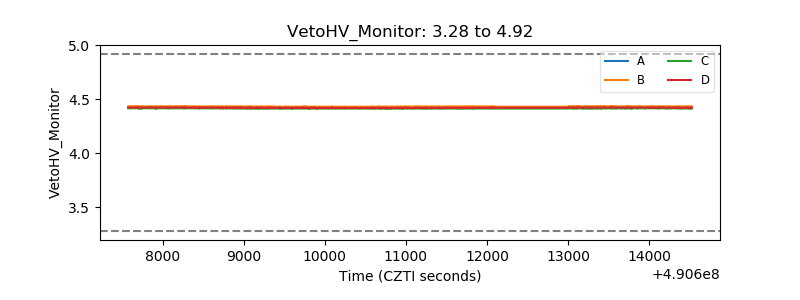 |
| Veto LLD | 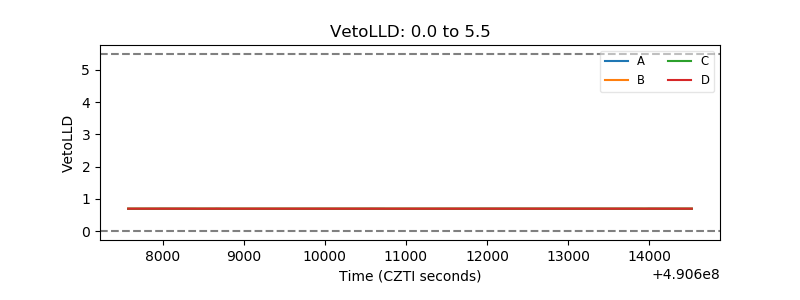 |
| Alpha Counter | 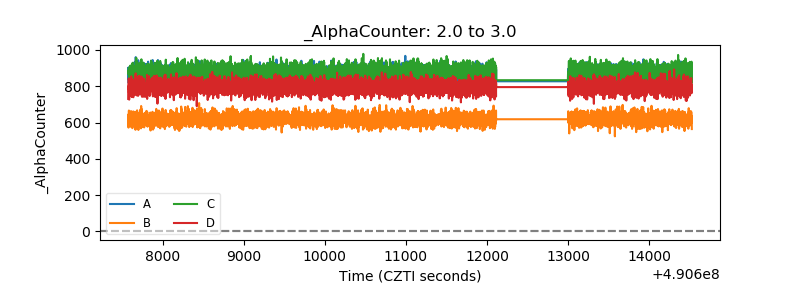 |
| _CPM_Rate | 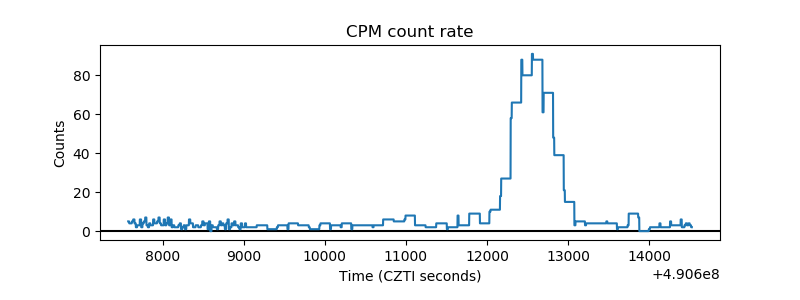 |
| CZT Counter | 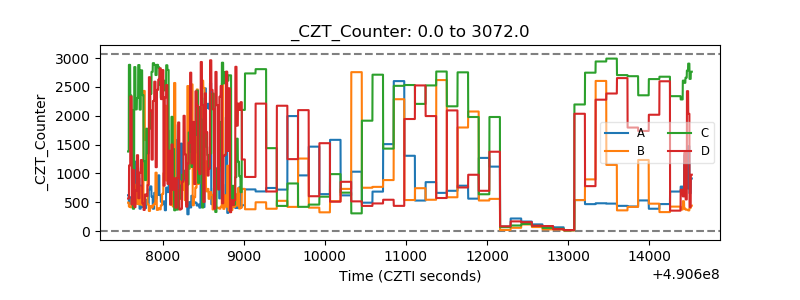 |
| +2.5 Volts monitor | 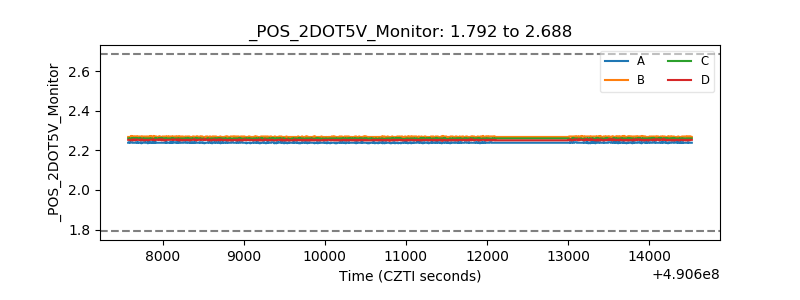 |
| +5 Volts monitor |  |
| _ROLL_ROT | 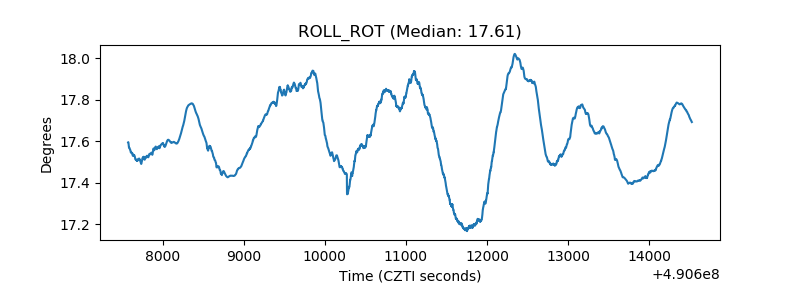 |
| _Roll_DEC | 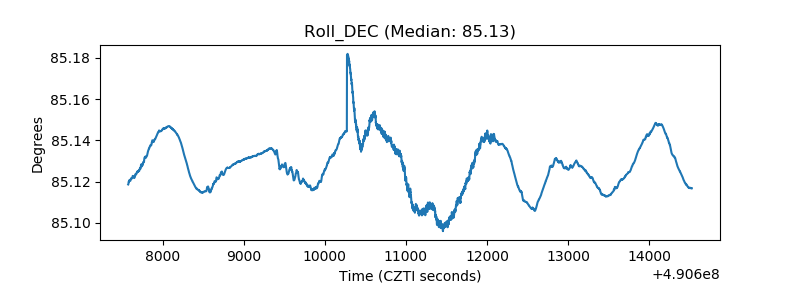 |
| _Roll_RA | 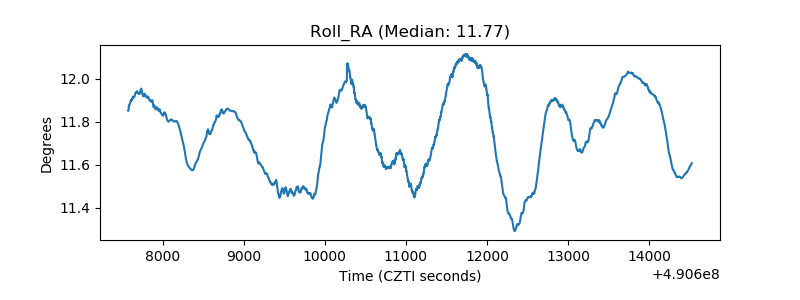 |
| Veto Counter | 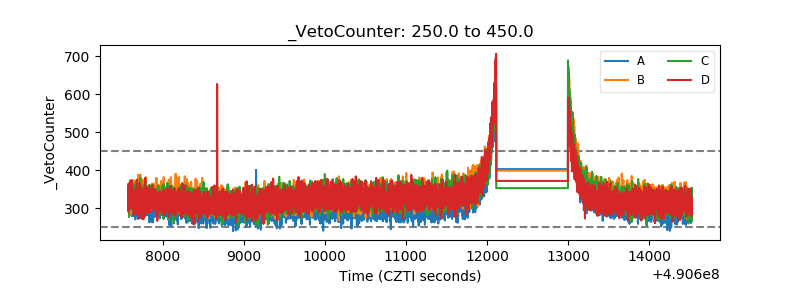 |