| Param | Original file | Final file |
|---|---|---|
| Filename | modeM0/AS1C09_011T07_9000006488_53053cztM0_level2.fits | modeM0/AS1C09_011T07_9000006488_53053cztM0_level2_quad_clean.evt |
| Size (bytes) | 1,015,300,800 | 88,787,520 |
| Size | 968.3 MB | 84.7 MB |
| Events in quadrant A | 7,707,324 | 645,588 |
| Events in quadrant B | 7,256,503 | 617,529 |
| Events in quadrant C | 13,915,735 | 327,667 |
| Events in quadrant D | 8,118,123 | 569,313 |
| Mode SS | |||
|---|---|---|---|
| Quadrant | BADHDUFLAG | Total packets | Discarded packets |
| A | 0 | 152 | 0 |
| B | 0 | 152 | 0 |
| C | 0 | 152 | 0 |
| D | 0 | 152 | 0 |
| Mode M0 | |||
|---|---|---|---|
| Quadrant | BADHDUFLAG | Total packets | Discarded packets |
| A | 0 | 28155 | 0 |
| B | 0 | 26924 | 0 |
| C | 0 | 46547 | 3 |
| D | 0 | 29466 | 0 |
| Quadrant | Total seconds | Saturated seconds | Saturation percentage |
|---|---|---|---|
| A | 7584 | 947 | 12.486814% |
| B | 7584 | 1512 | 19.936709% |
| C | 7583 | 4143 | 54.635369% |
| D | 7584 | 1092 | 14.398734% |
Noise dominated data is calculated using 1-second bins in cleaned event files. If a bin has >2000 counts, and if more than 50% of those come from <1% of pixels, then it is considered to be noise-dominated and hence unusable.
| Quadrant | # 1 sec bins | Bins with >0 counts | Bins with >2000 counts | High rate bins dominated by noise | Noise dominated (total time) | Noise dominated (detector-on time) | Marked lightcurve |
|---|---|---|---|---|---|---|---|
| A | 7584 | 7584 | 737 | 737 | 9.72% | 9.72% | 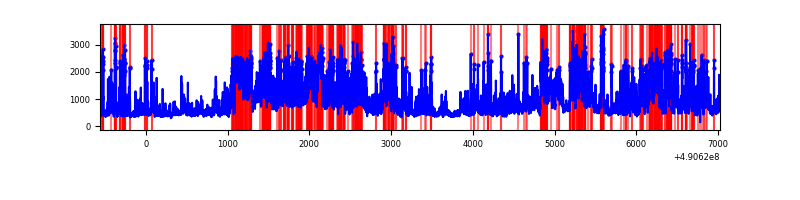 |
| B | 7584 | 7584 | 1097 | 1097 | 14.46% | 14.46% | 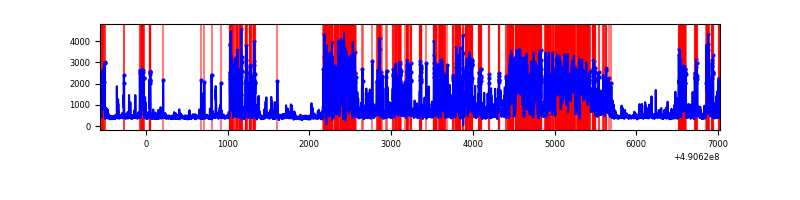 |
| C | 7583 | 7583 | 3925 | 3925 | 51.76% | 51.76% | 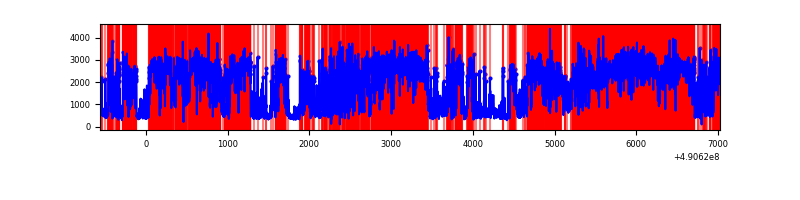 |
| D | 7584 | 7584 | 1072 | 1072 | 14.14% | 14.14% | 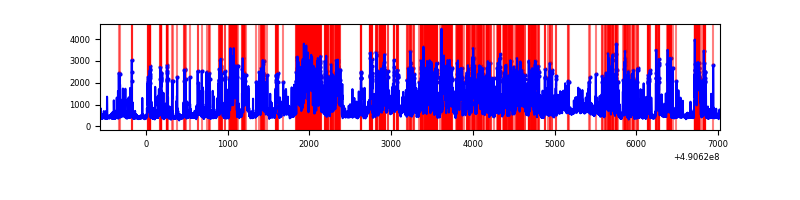 |
Top three noisy pixels from each quadrant. If the there are fewer than three noisy pixels in the level2.evt file, extra rows are filled as -1
| Pixel properties | Quadrant properties | ||||||
|---|---|---|---|---|---|---|---|
| Quadrant | DetID | PixID | Counts | Sigma | Mean | Median | Sigma |
| A | 9 | 191 | 2094543 | 11150.68 | 760 | 743 | 187.8 |
| A | 7 | 206 | 1322678 | 7040.06 | 760 | 743 | 187.8 |
| A | 0 | 8 | 551962 | 2935.56 | 760 | 743 | 187.8 |
| B | 1 | 255 | 2723825 | 18530.5 | 690 | 666 | 147.0 |
| B | 10 | 63 | 1294456 | 8803.96 | 690 | 666 | 147.0 |
| B | 4 | 81 | 131413 | 889.7 | 690 | 666 | 147.0 |
| C | 1 | 241 | 9027817 | 60895.29 | 540 | 535 | 148.2 |
| C | 15 | 224 | 1007807 | 6794.75 | 540 | 535 | 148.2 |
| C | 15 | 244 | 650902 | 4387.18 | 540 | 535 | 148.2 |
| D | 12 | 17 | 2157027 | 10281.15 | 729 | 692 | 209.7 |
| D | 0 | 5 | 1579374 | 7526.97 | 729 | 692 | 209.7 |
| D | 3 | 224 | 321062 | 1527.49 | 729 | 692 | 209.7 |
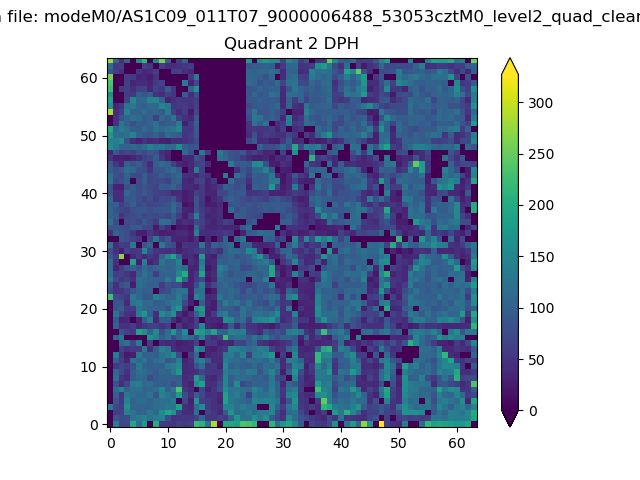
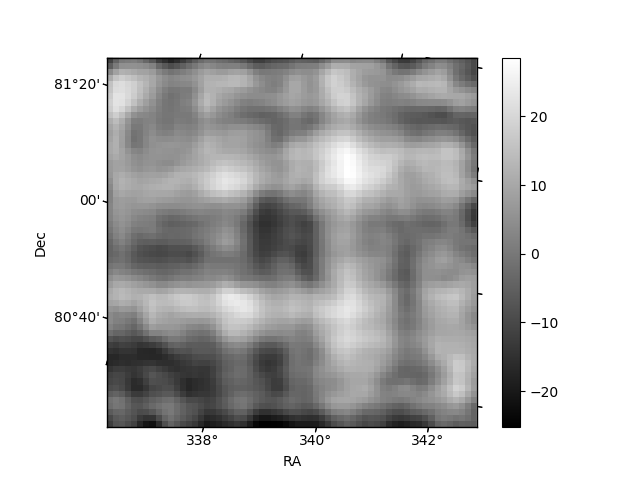
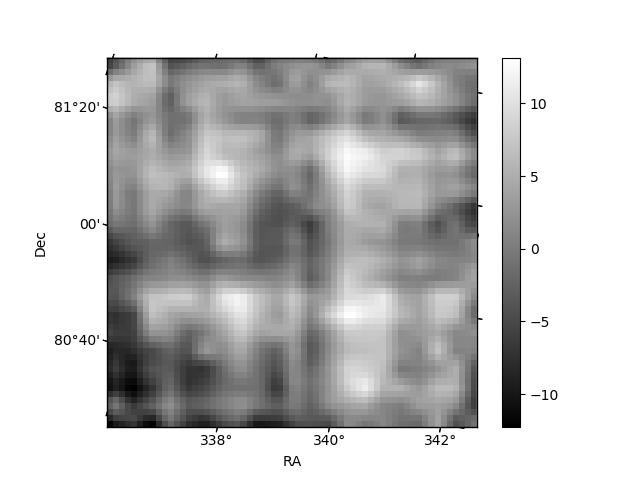
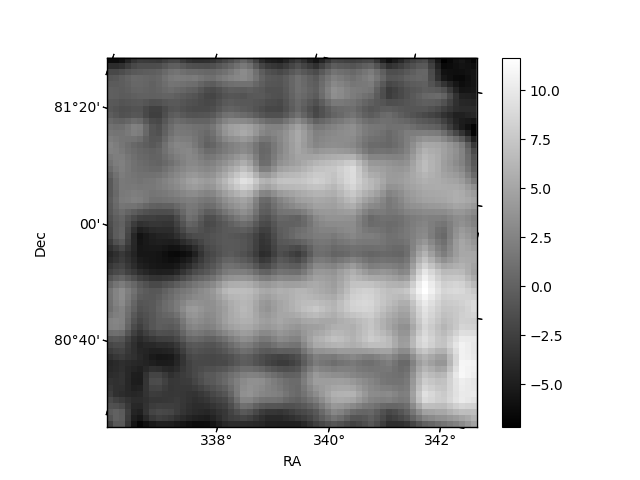
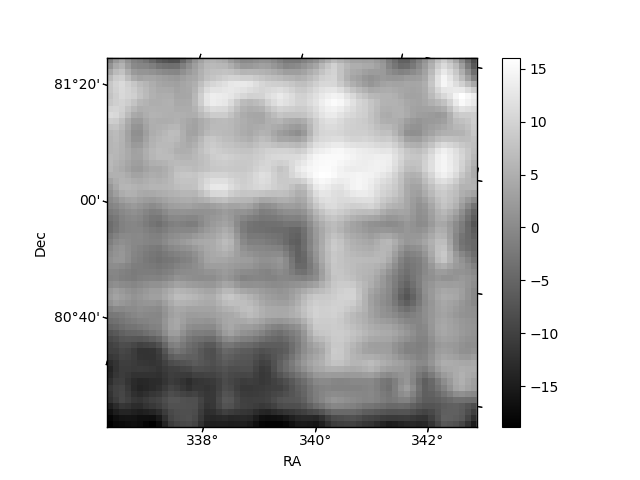
Histogram calculated using DETX and DETY for each event in the final _common_clean file
| Quadrant A | 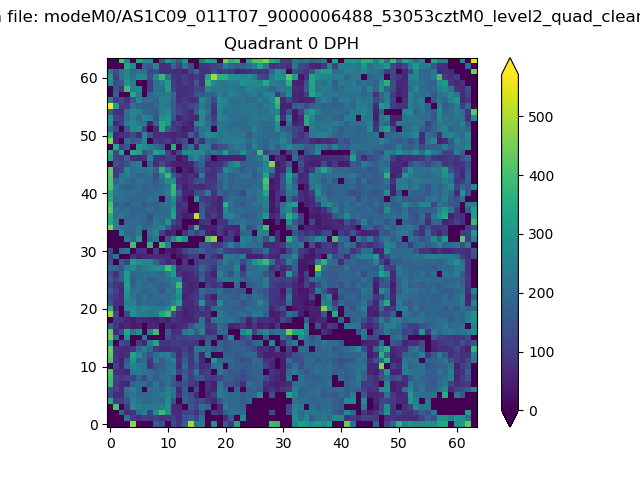 |
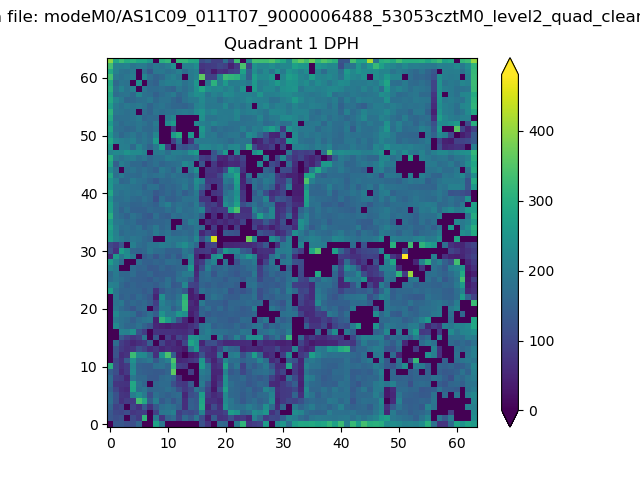 |
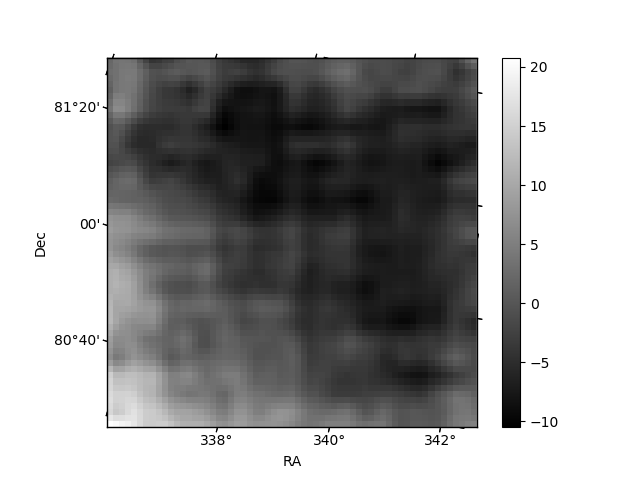
Quadrant B |
|---|---|---|---|
| Quadrant D | 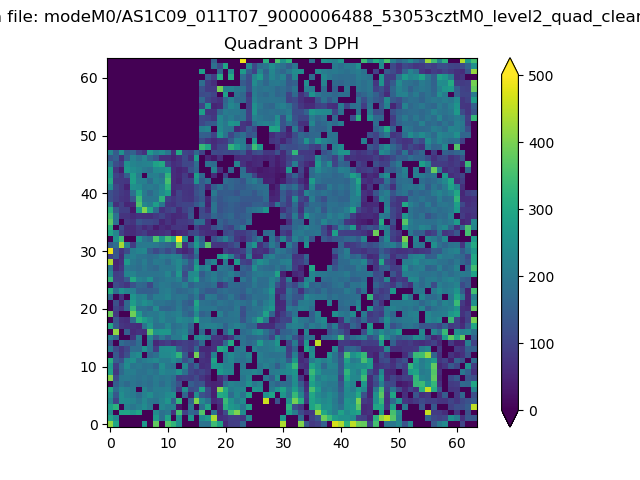 |
 |
Quadrant C |
| Plot type | Count rate plots | Images |
|---|---|---|
| Comparison with Poisson distribution Blue bars denote a histogram of data divided into 1 sec bins. Red curve is a Poisson curve with rate = median count rate of data. |
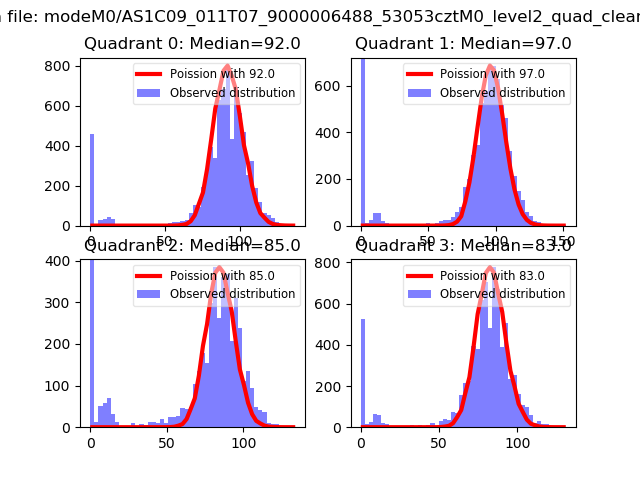 |
 |
| Quadrant-wise count rates Data is divided into 100 sec bins |
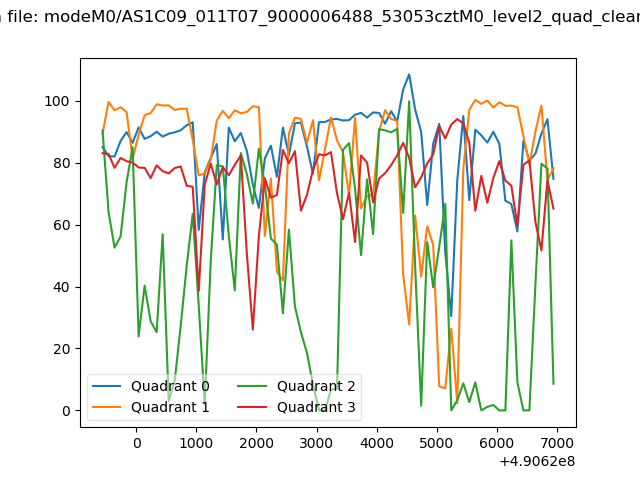 |
|
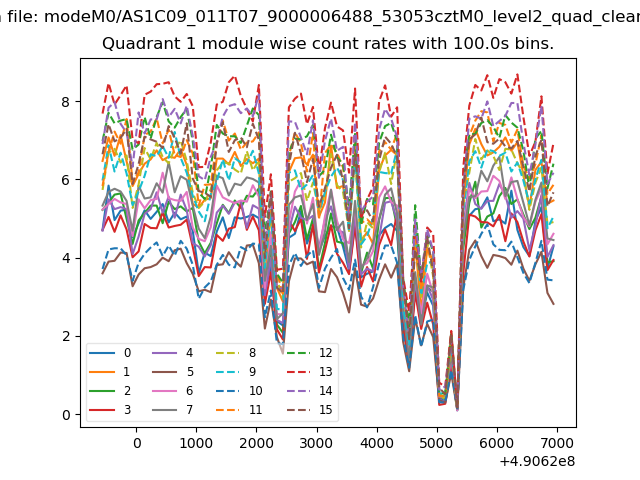
| Module-wise count rates for Quadrant A Data is divided into 100 sec bins |
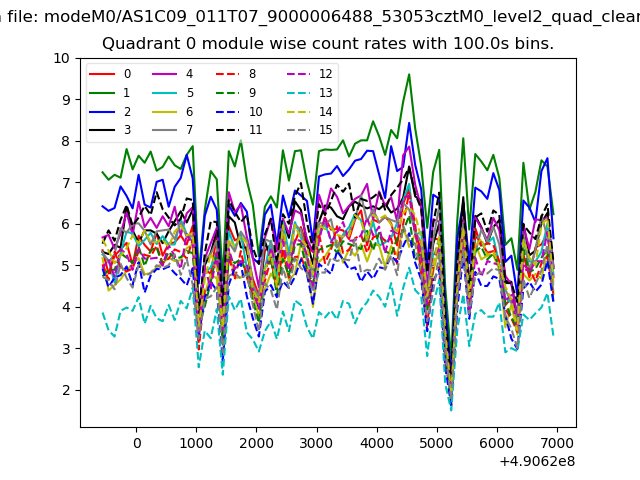 |
 |
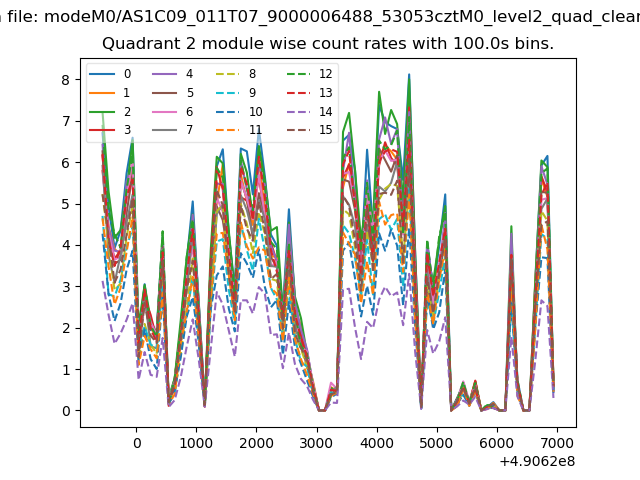
| Module-wise count rates for Quadrant B Data is divided into 100 sec bins |
 |
 |
| Module-wise count rates for Quadrant C Data is divided into 100 sec bins |
 |
 |
| Module-wise count rates for Quadrant D Data is divided into 100 sec bins |
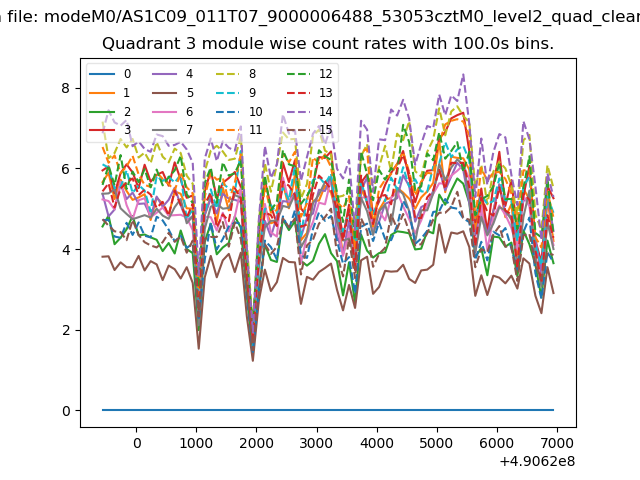 |
 |
| Parameter | Plot |
|---|---|
| CZT HV Monitor | 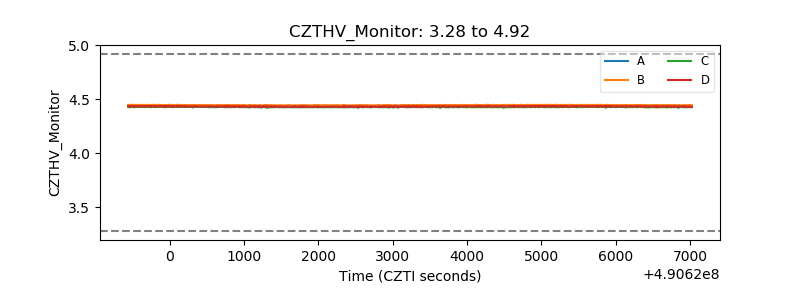 |
| D_VDD | 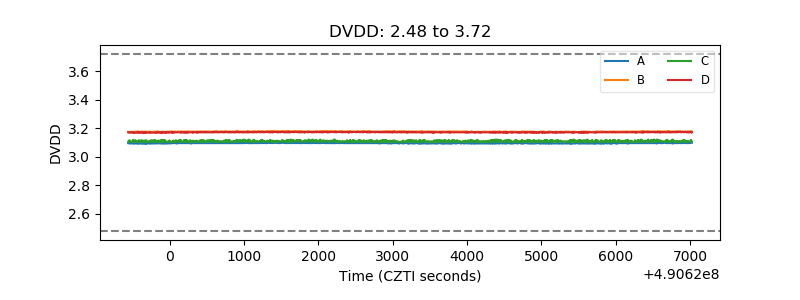 |
| Temperature 1 | 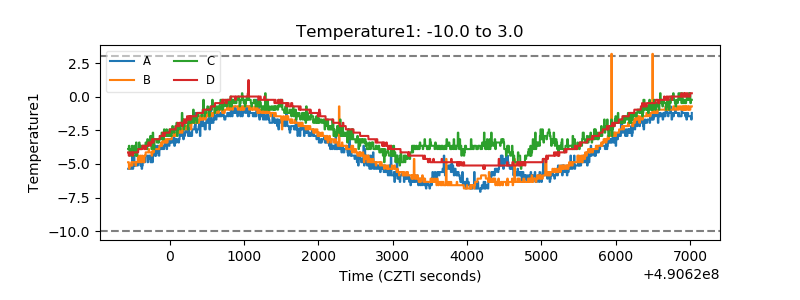 |
| Veto HV Monitor | 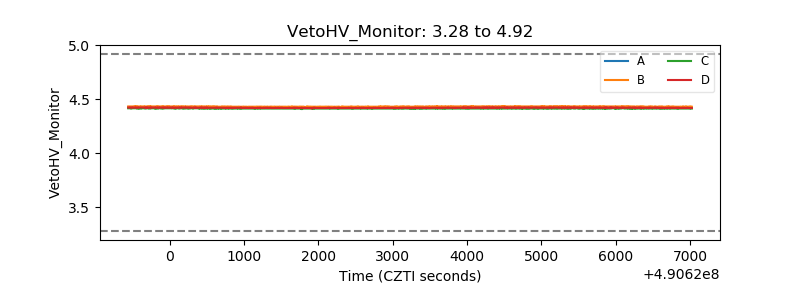 |
| Veto LLD | 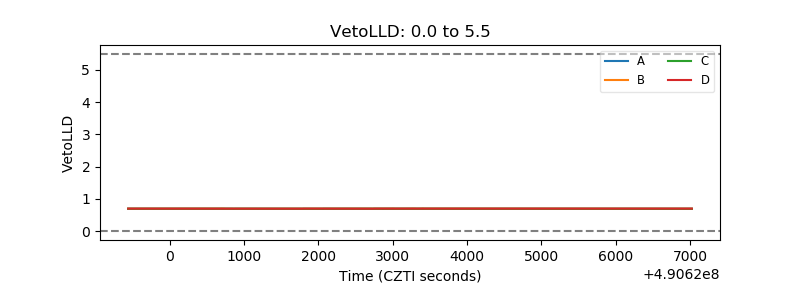 |
| Alpha Counter | 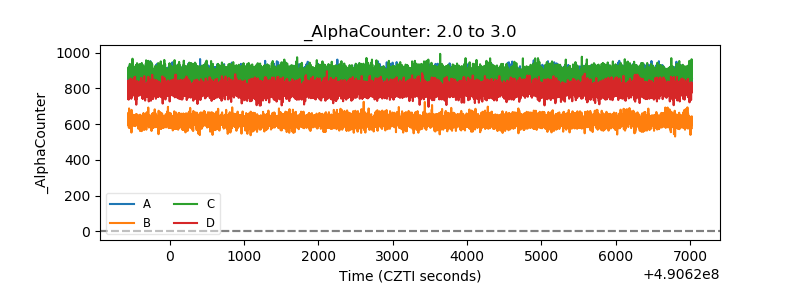 |
| _CPM_Rate | 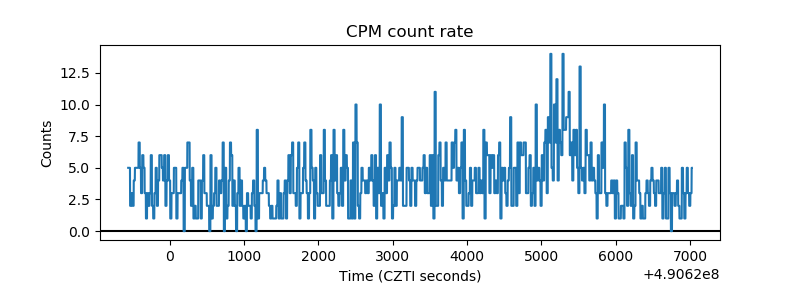 |
| CZT Counter | 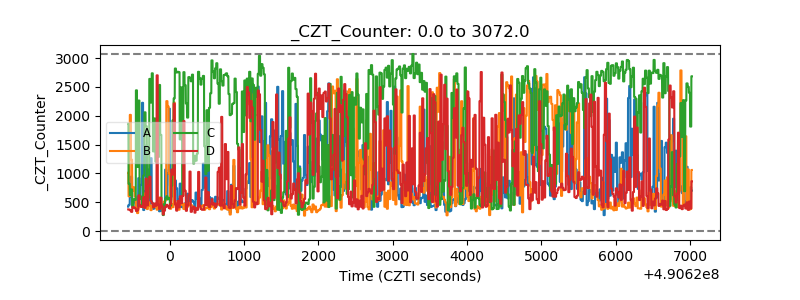 |
| +2.5 Volts monitor |  |
| +5 Volts monitor | 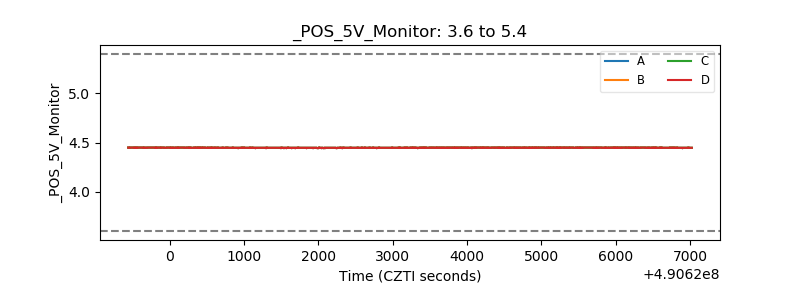 |
| _ROLL_ROT | 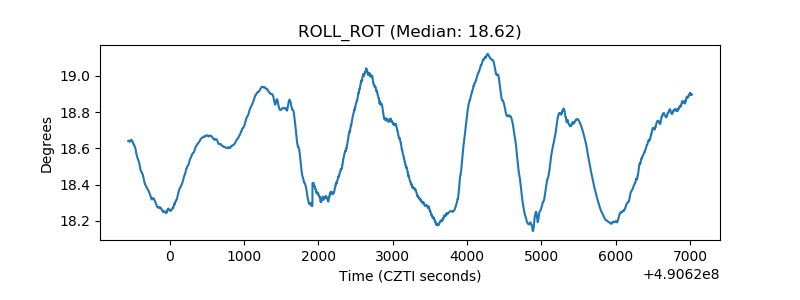 |
| _Roll_DEC | 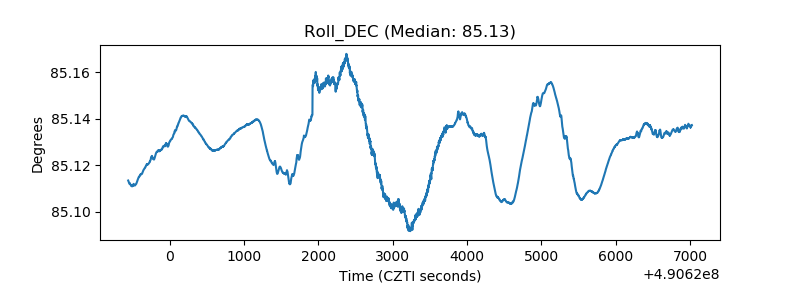 |
| _Roll_RA | 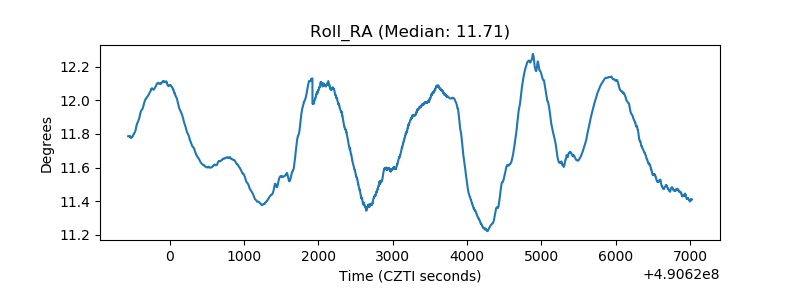 |
| Veto Counter | 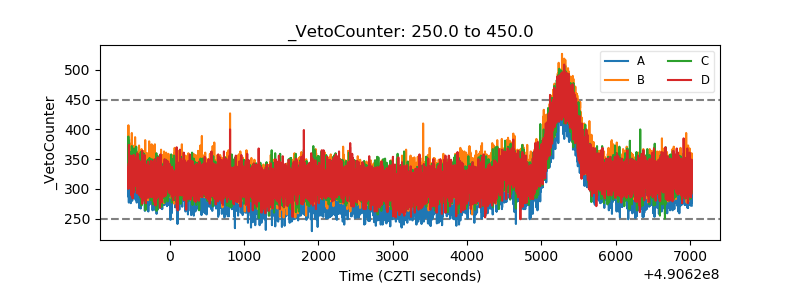 |