| Param | Original file | Final file |
|---|---|---|
| Filename | modeM0/AS1C09_011T07_9000006488_53054cztM0_level2.fits | modeM0/AS1C09_011T07_9000006488_53054cztM0_level2_quad_clean.evt |
| Size (bytes) | 1,117,002,240 | 87,102,720 |
| Size | 1.0 GB | 83.1 MB |
| Events in quadrant A | 8,282,160 | 639,911 |
| Events in quadrant B | 7,485,147 | 662,603 |
| Events in quadrant C | 12,971,453 | 384,341 |
| Events in quadrant D | 12,014,230 | 413,396 |
| Mode SS | |||
|---|---|---|---|
| Quadrant | BADHDUFLAG | Total packets | Discarded packets |
| A | 0 | 154 | 0 |
| B | 0 | 154 | 0 |
| C | 0 | 154 | 0 |
| D | 0 | 154 | 0 |
| Mode M0 | |||
|---|---|---|---|
| Quadrant | BADHDUFLAG | Total packets | Discarded packets |
| A | 0 | 29902 | 0 |
| B | 0 | 27565 | 0 |
| C | 0 | 43799 | 0 |
| D | 0 | 40992 | 5 |
| Quadrant | Total seconds | Saturated seconds | Saturation percentage |
|---|---|---|---|
| A | 7713 | 1138 | 14.754311% |
| B | 7713 | 1331 | 17.256580% |
| C | 7713 | 3638 | 47.167120% |
| D | 7712 | 3041 | 39.432054% |
Noise dominated data is calculated using 1-second bins in cleaned event files. If a bin has >2000 counts, and if more than 50% of those come from <1% of pixels, then it is considered to be noise-dominated and hence unusable.
| Quadrant | # 1 sec bins | Bins with >0 counts | Bins with >2000 counts | High rate bins dominated by noise | Noise dominated (total time) | Noise dominated (detector-on time) | Marked lightcurve |
|---|---|---|---|---|---|---|---|
| A | 7713 | 7713 | 1028 | 1028 | 13.33% | 13.33% | 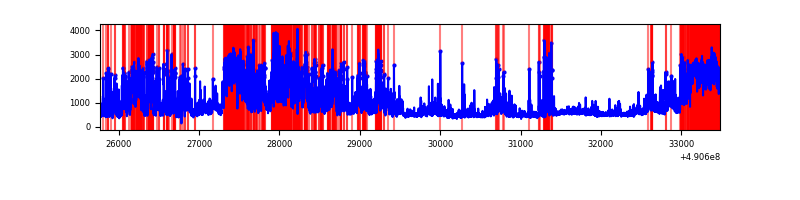 |
| B | 7713 | 7713 | 1049 | 1049 | 13.60% | 13.60% | 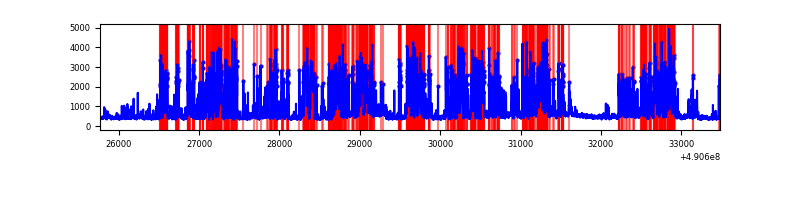 |
| C | 7713 | 7713 | 3480 | 3480 | 45.12% | 45.12% | 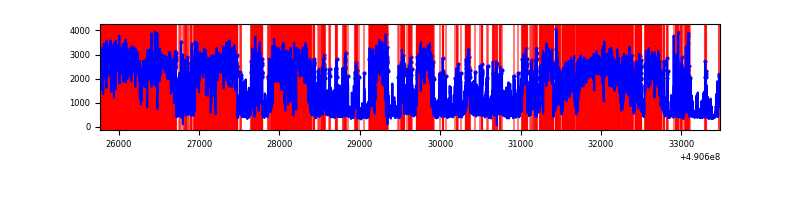 |
| D | 7712 | 7712 | 2771 | 2771 | 35.93% | 35.93% | 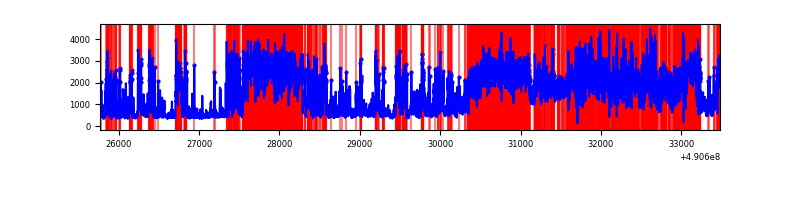 |
Top three noisy pixels from each quadrant. If the there are fewer than three noisy pixels in the level2.evt file, extra rows are filled as -1
| Pixel properties | Quadrant properties | ||||||
|---|---|---|---|---|---|---|---|
| Quadrant | DetID | PixID | Counts | Sigma | Mean | Median | Sigma |
| A | 9 | 191 | 2390173 | 12499.04 | 767 | 749 | 191.2 |
| A | 7 | 206 | 1524698 | 7971.75 | 767 | 749 | 191.2 |
| A | 15 | 190 | 409845 | 2139.97 | 767 | 749 | 191.2 |
| B | 1 | 255 | 2170216 | 13974.13 | 733 | 707 | 155.3 |
| B | 10 | 63 | 1669883 | 10751.41 | 733 | 707 | 155.3 |
| B | 5 | 172 | 206542 | 1325.81 | 733 | 707 | 155.3 |
| C | 1 | 241 | 7258171 | 44595.64 | 588 | 582 | 162.7 |
| C | 15 | 224 | 1320559 | 8110.85 | 588 | 582 | 162.7 |
| C | 15 | 147 | 665960 | 4088.54 | 588 | 582 | 162.7 |
| D | 12 | 17 | 3231553 | 17897.69 | 627 | 598 | 180.5 |
| D | 8 | 176 | 3098579 | 17161.09 | 627 | 598 | 180.5 |
| D | 2 | 172 | 1897464 | 10507.58 | 627 | 598 | 180.5 |
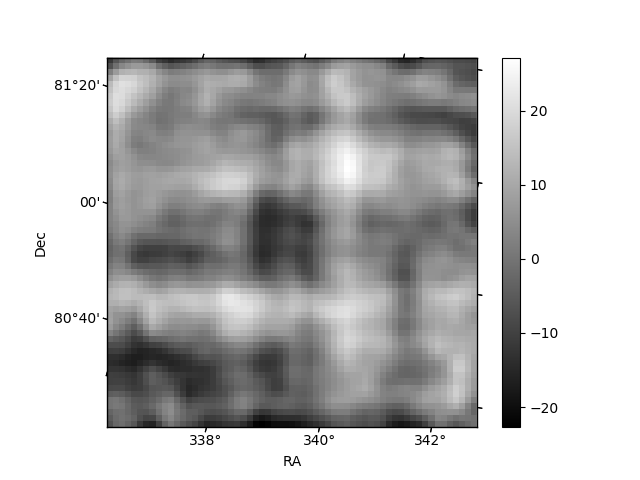
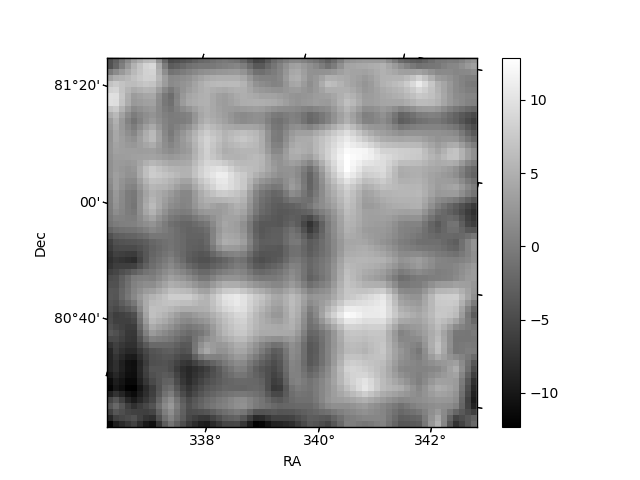
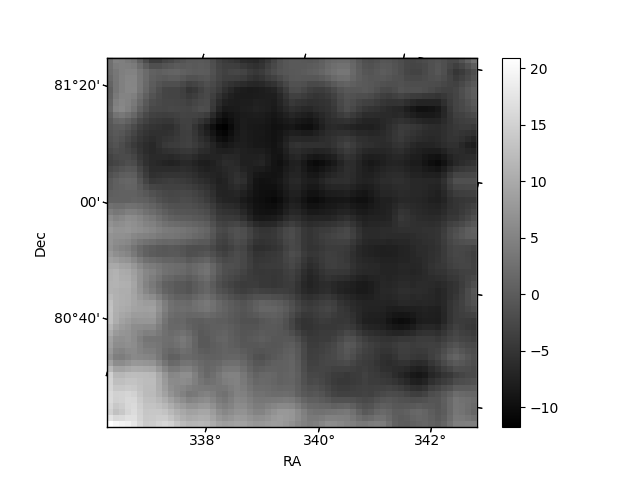
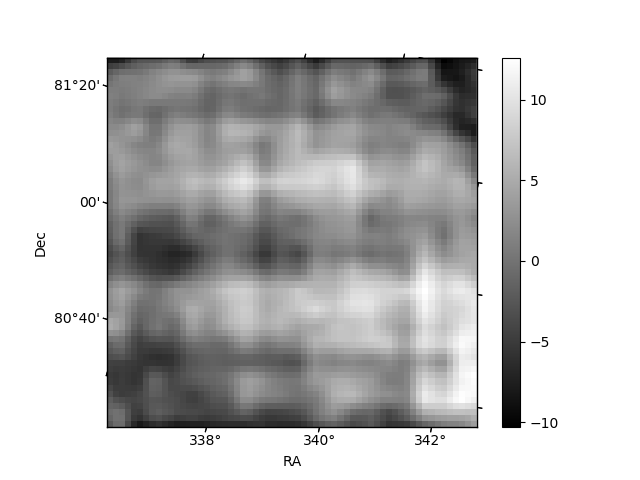
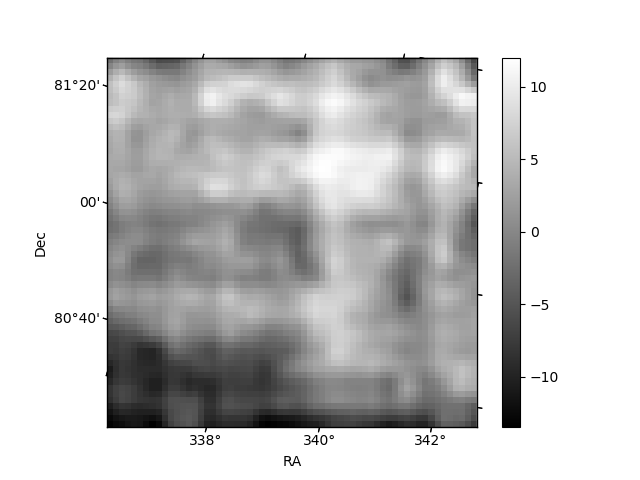
Histogram calculated using DETX and DETY for each event in the final _common_clean file
| Quadrant A | 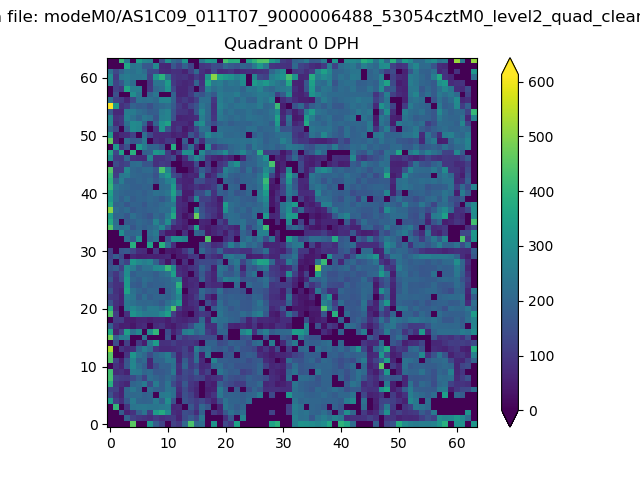 |
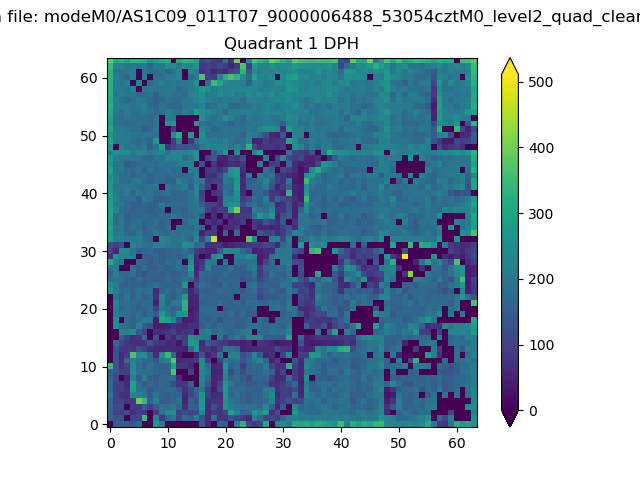 |
Quadrant B |
|---|---|---|---|
| Quadrant D | 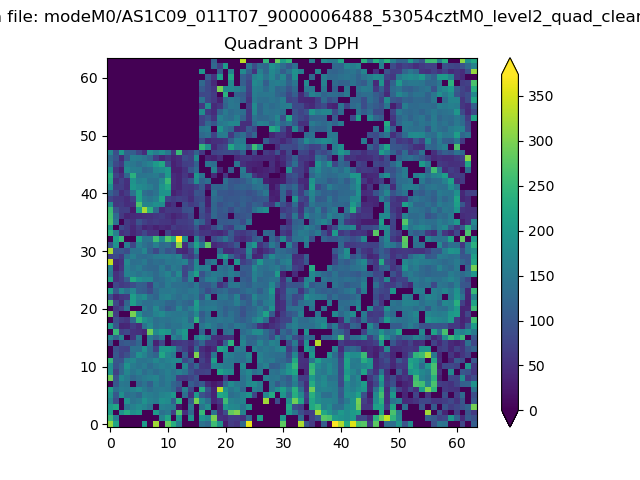 |
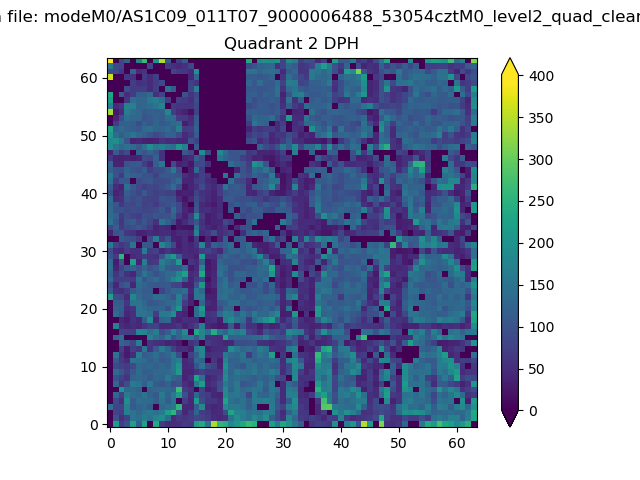 |
Quadrant C |
| Plot type | Count rate plots | Images |
|---|---|---|
| Comparison with Poisson distribution Blue bars denote a histogram of data divided into 1 sec bins. Red curve is a Poisson curve with rate = median count rate of data. |
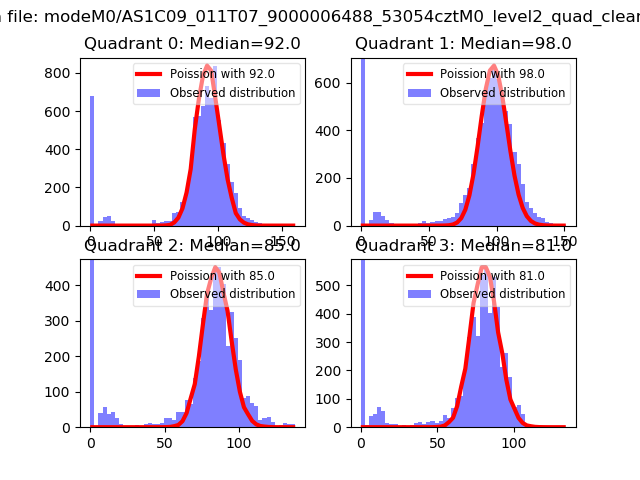 |
 |
| Quadrant-wise count rates Data is divided into 100 sec bins |
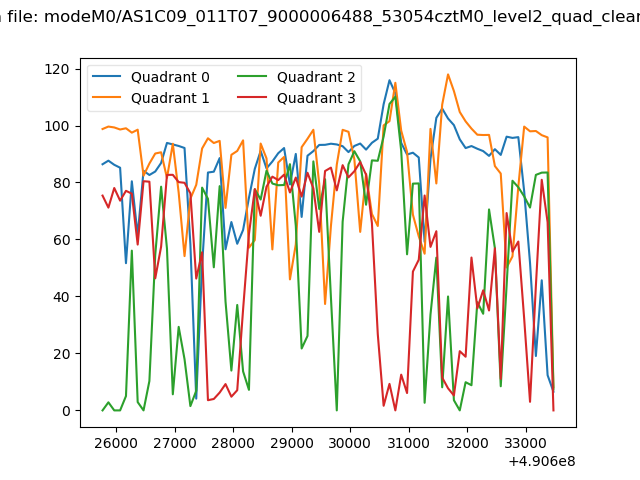 |
|
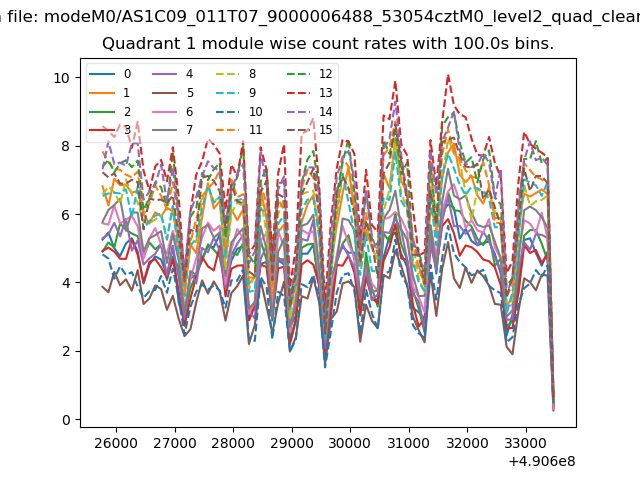
| Module-wise count rates for Quadrant A Data is divided into 100 sec bins |
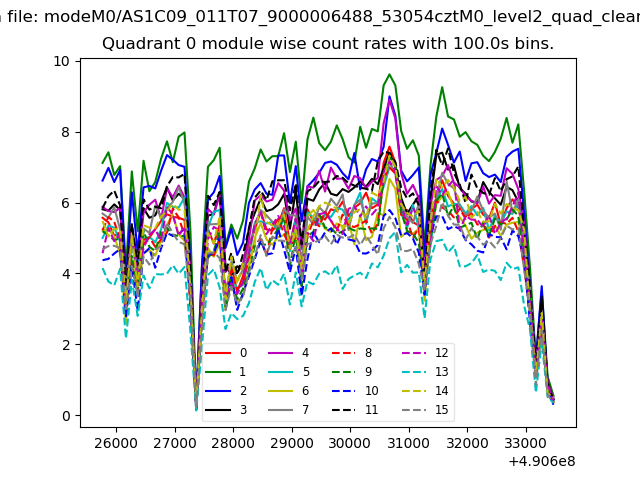 |
 |
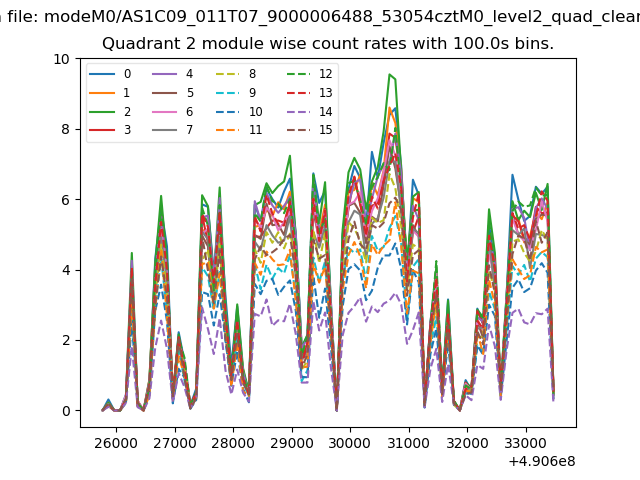
| Module-wise count rates for Quadrant B Data is divided into 100 sec bins |
 |
 |
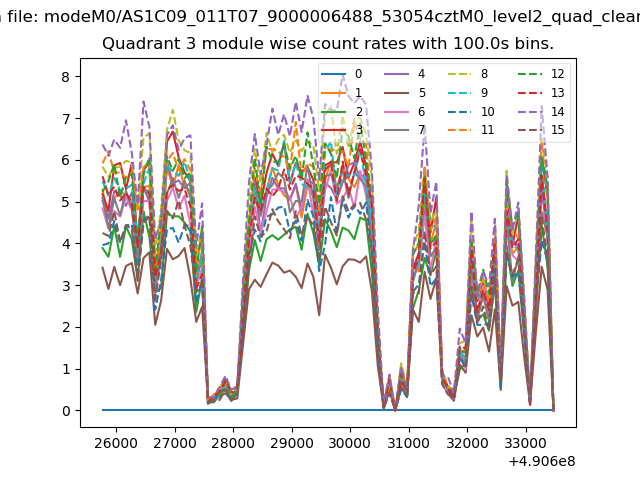
| Module-wise count rates for Quadrant C Data is divided into 100 sec bins |
 |
 |
| Module-wise count rates for Quadrant D Data is divided into 100 sec bins |
 |
 |
| Parameter | Plot |
|---|---|
| CZT HV Monitor | 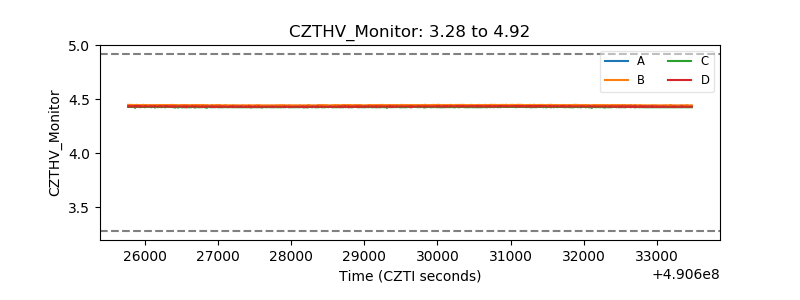 |
| D_VDD | 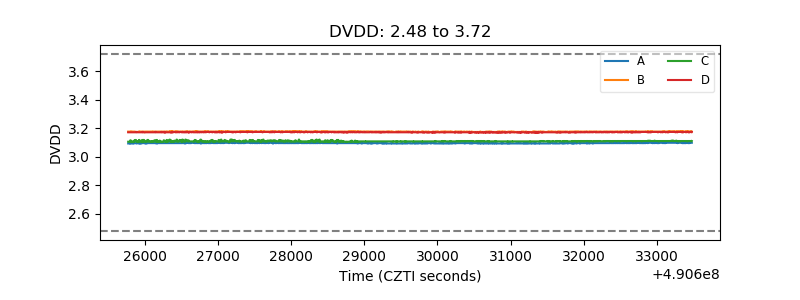 |
| Temperature 1 | 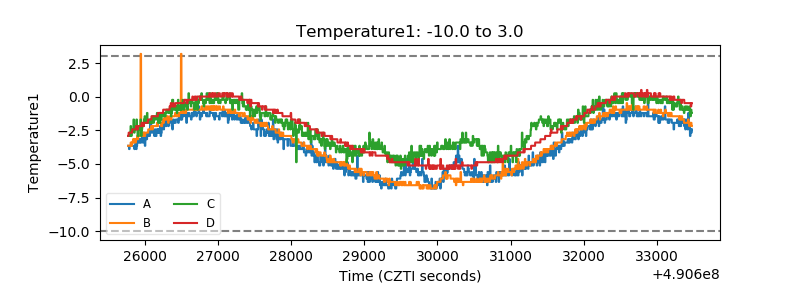 |
| Veto HV Monitor | 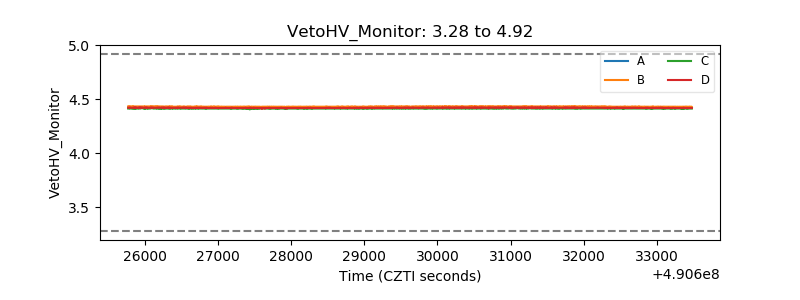 |
| Veto LLD | 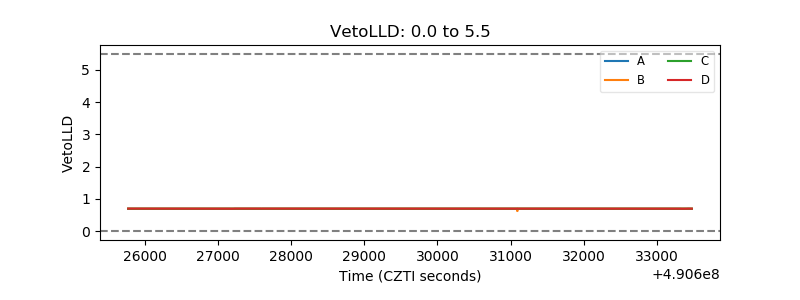 |
| Alpha Counter | 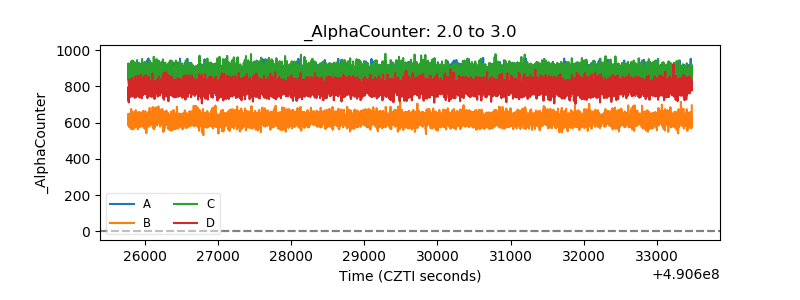 |
| _CPM_Rate | 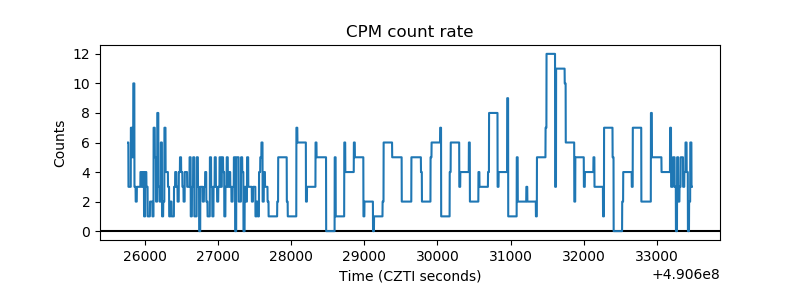 |
| CZT Counter | 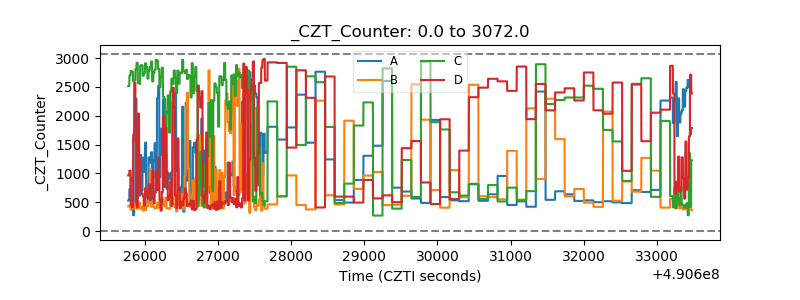 |
| +2.5 Volts monitor |  |
| +5 Volts monitor | 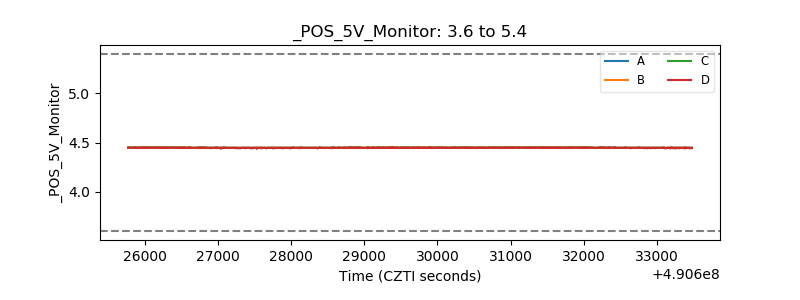 |
| _ROLL_ROT | 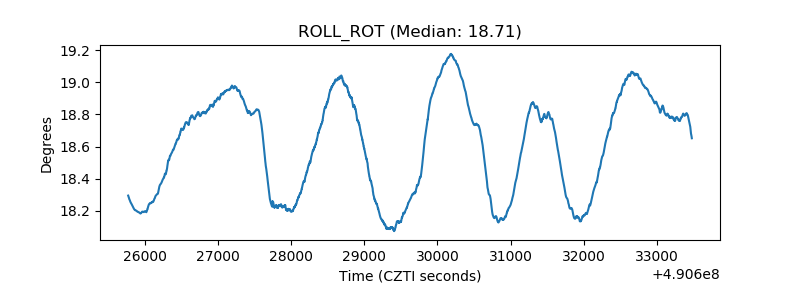 |
| _Roll_DEC | 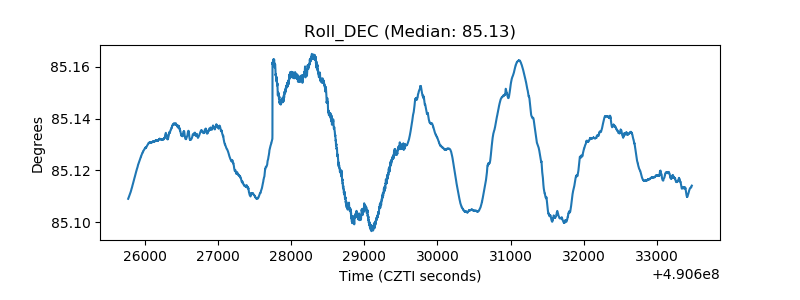 |
| _Roll_RA | 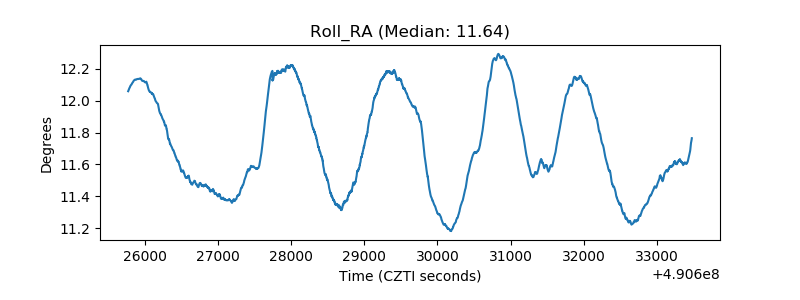 |
| Veto Counter | 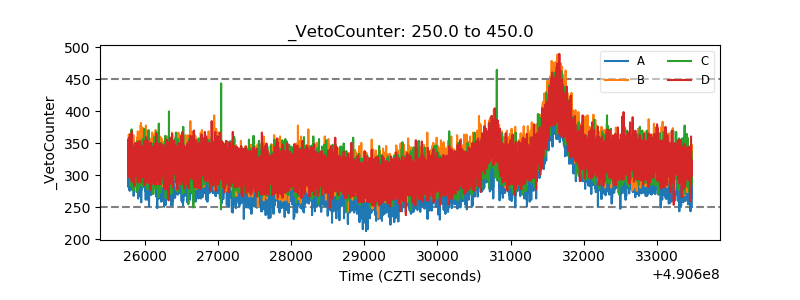 |