| Param | Original file | Final file |
|---|---|---|
| Filename | modeM0/AS1C09_011T07_9000006488_53055cztM0_level2.fits | modeM0/AS1C09_011T07_9000006488_53055cztM0_level2_quad_clean.evt |
| Size (bytes) | 1,001,465,280 | 82,172,160 |
| Size | 955.1 MB | 78.4 MB |
| Events in quadrant A | 8,398,781 | 531,699 |
| Events in quadrant B | 5,828,582 | 642,009 |
| Events in quadrant C | 12,177,635 | 370,930 |
| Events in quadrant D | 10,116,812 | 447,116 |
| Mode SS | |||
|---|---|---|---|
| Quadrant | BADHDUFLAG | Total packets | Discarded packets |
| A | 0 | 144 | 0 |
| B | 0 | 144 | 0 |
| C | 0 | 144 | 0 |
| D | 0 | 144 | 0 |
| Mode M9 | |||
|---|---|---|---|
| Quadrant | BADHDUFLAG | Total packets | Discarded packets |
| A | 0 | 1 | 0 |
| B | 0 | 1 | 0 |
| C | 0 | 1 | 0 |
| D | 0 | 1 | 0 |
| Mode M0 | |||
|---|---|---|---|
| Quadrant | BADHDUFLAG | Total packets | Discarded packets |
| A | 0 | 29783 | 6 |
| B | 0 | 22363 | 1 |
| C | 0 | 41113 | 7 |
| D | 0 | 35044 | 1 |
| Quadrant | Total seconds | Saturated seconds | Saturation percentage |
|---|---|---|---|
| A | 7118 | 1717 | 24.121944% |
| B | 7118 | 907 | 12.742343% |
| C | 7117 | 3322 | 46.676971% |
| D | 7119 | 2206 | 30.987498% |
Noise dominated data is calculated using 1-second bins in cleaned event files. If a bin has >2000 counts, and if more than 50% of those come from <1% of pixels, then it is considered to be noise-dominated and hence unusable.
| Quadrant | # 1 sec bins | Bins with >0 counts | Bins with >2000 counts | High rate bins dominated by noise | Noise dominated (total time) | Noise dominated (detector-on time) | Marked lightcurve |
|---|---|---|---|---|---|---|---|
| A | 7163 | 7119 | 1518 | 1518 | 21.19% | 21.32% | 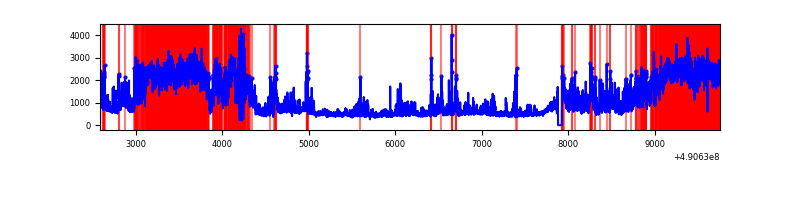 |
| B | 7163 | 7119 | 635 | 635 | 8.87% | 8.92% | 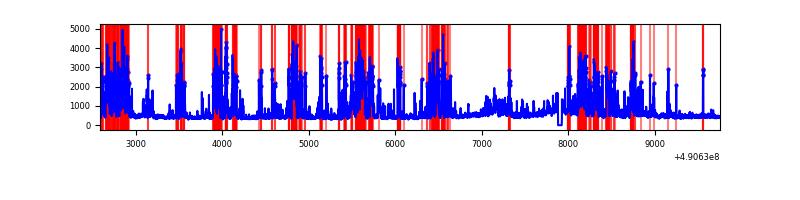 |
| C | 7163 | 7119 | 2982 | 2982 | 41.63% | 41.89% | 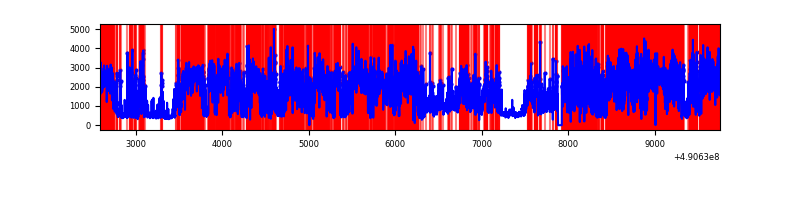 |
| D | 7164 | 7120 | 1963 | 1963 | 27.40% | 27.57% | 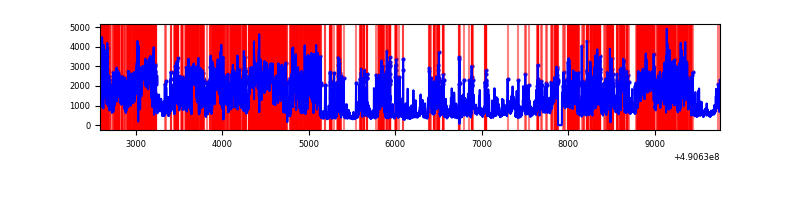 |
Top three noisy pixels from each quadrant. If the there are fewer than three noisy pixels in the level2.evt file, extra rows are filled as -1
| Pixel properties | Quadrant properties | ||||||
|---|---|---|---|---|---|---|---|
| Quadrant | DetID | PixID | Counts | Sigma | Mean | Median | Sigma |
| A | 7 | 206 | 2482731 | 14533.9 | 692 | 677 | 170.8 |
| A | 9 | 191 | 1785728 | 10452.53 | 692 | 677 | 170.8 |
| A | 15 | 190 | 664359 | 3886.25 | 692 | 677 | 170.8 |
| B | 10 | 63 | 1317478 | 8854.77 | 700 | 677 | 148.7 |
| B | 1 | 255 | 1100063 | 7392.77 | 700 | 677 | 148.7 |
| B | 4 | 81 | 194922 | 1306.19 | 700 | 677 | 148.7 |
| C | 1 | 241 | 4324916 | 27152.1 | 568 | 562 | 159.3 |
| C | 15 | 224 | 2815345 | 17673.68 | 568 | 562 | 159.3 |
| C | 15 | 244 | 1288715 | 8088.16 | 568 | 562 | 159.3 |
| D | 8 | 176 | 3095363 | 16504.57 | 647 | 614 | 187.5 |
| D | 12 | 17 | 2067214 | 11021.36 | 647 | 614 | 187.5 |
| D | 2 | 172 | 720277 | 3838.03 | 647 | 614 | 187.5 |
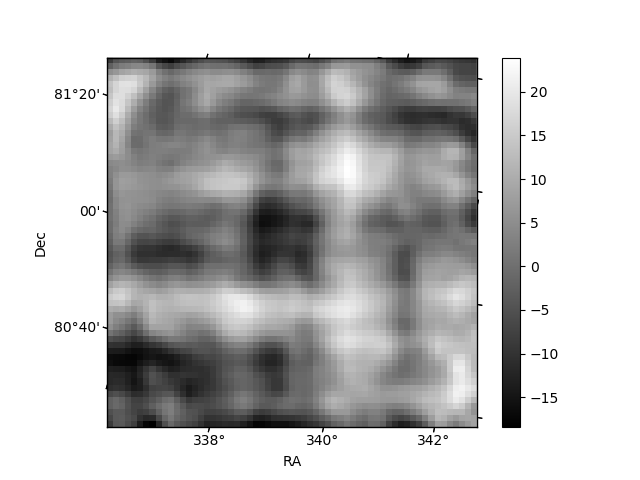
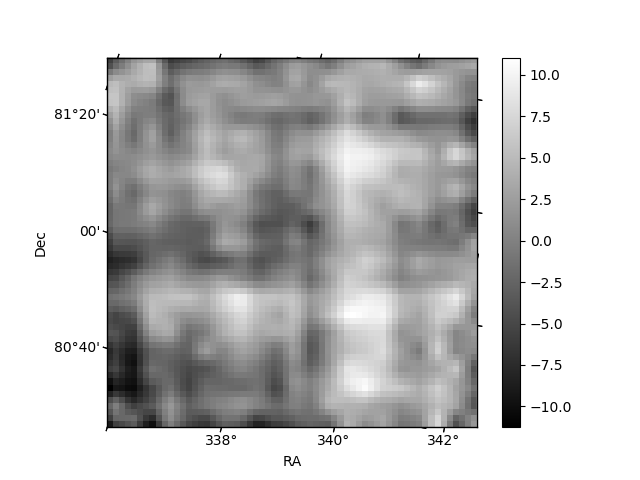
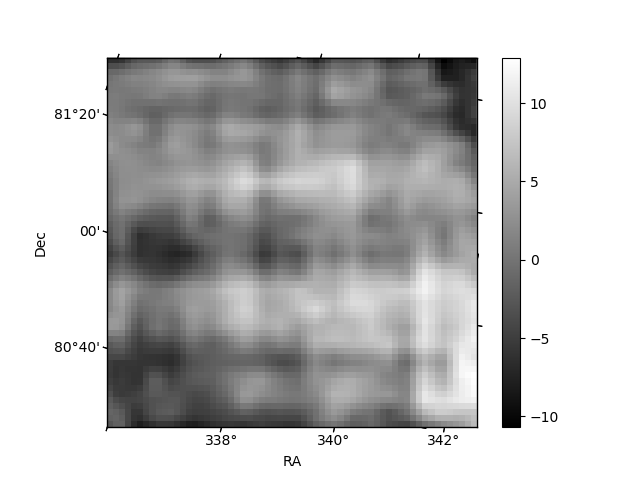
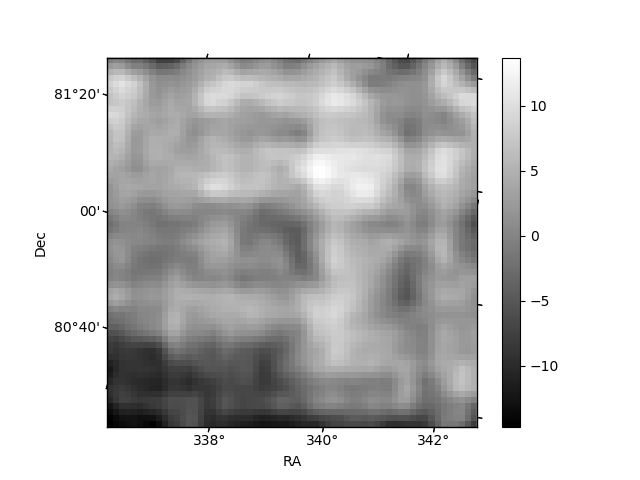
Histogram calculated using DETX and DETY for each event in the final _common_clean file
| Quadrant A | 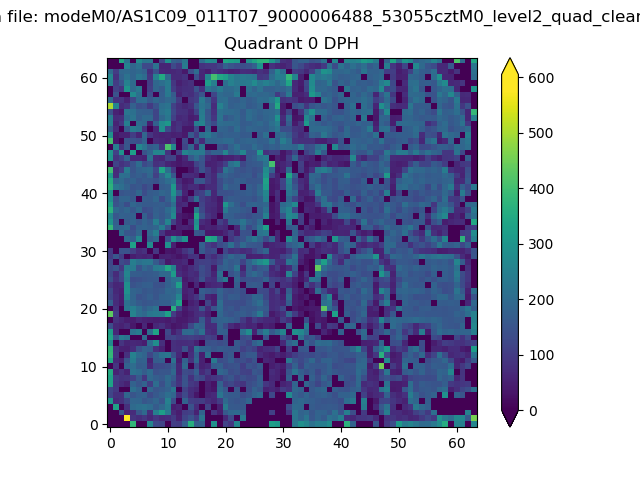 |
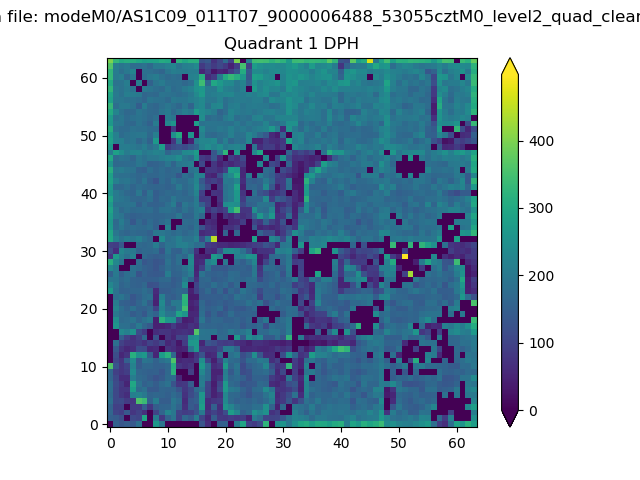 |
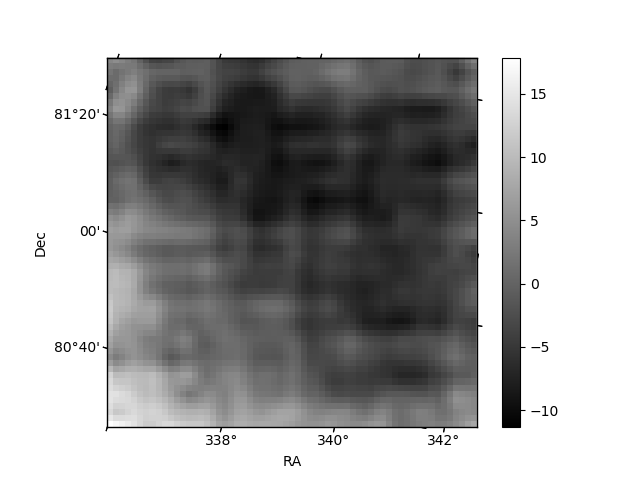
Quadrant B |
|---|---|---|---|
| Quadrant D | 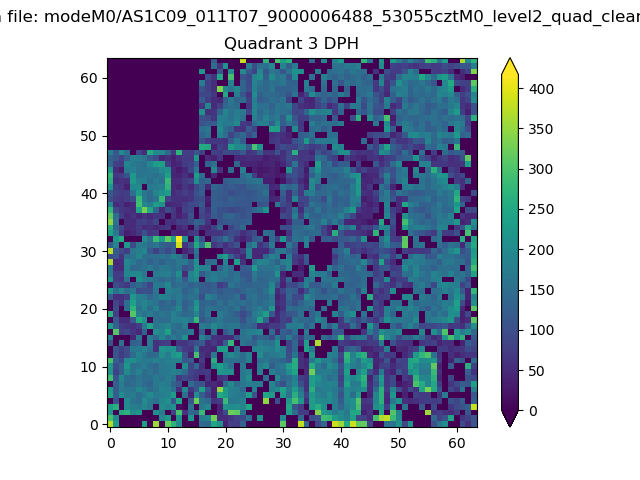 |
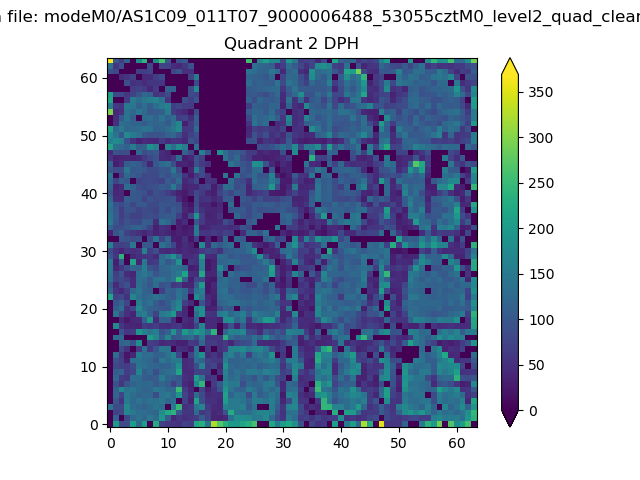 |
Quadrant C |
| Plot type | Count rate plots | Images |
|---|---|---|
| Comparison with Poisson distribution Blue bars denote a histogram of data divided into 1 sec bins. Red curve is a Poisson curve with rate = median count rate of data. |
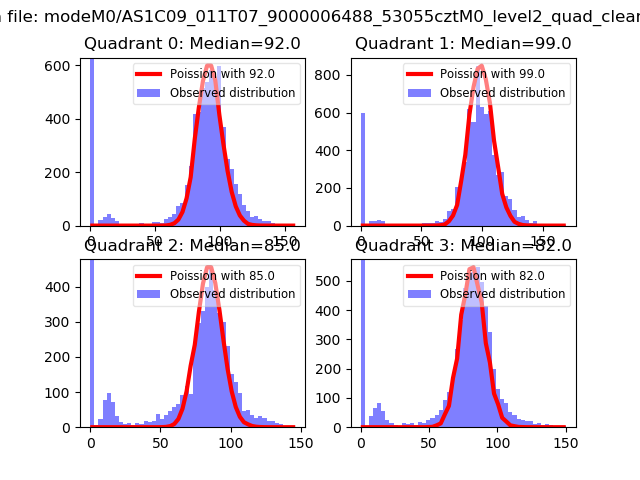 |
 |
| Quadrant-wise count rates Data is divided into 100 sec bins |
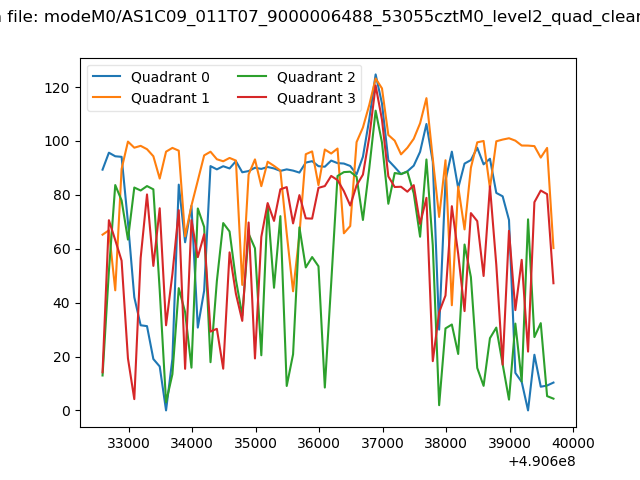 |
|
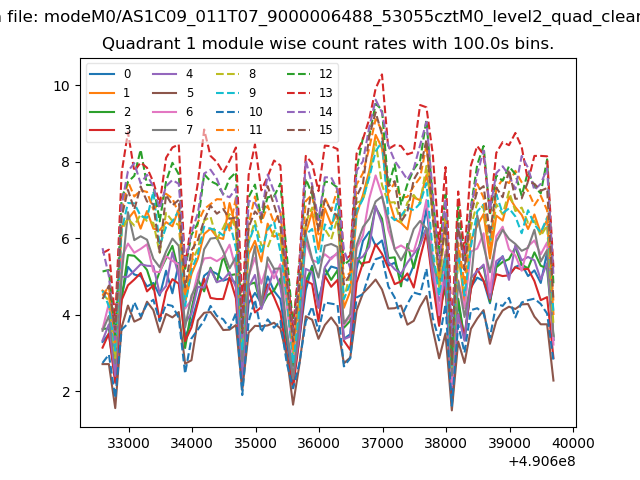
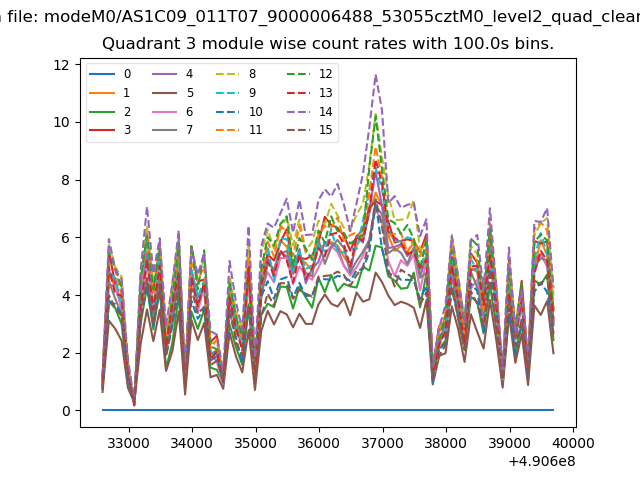
| Module-wise count rates for Quadrant A Data is divided into 100 sec bins |
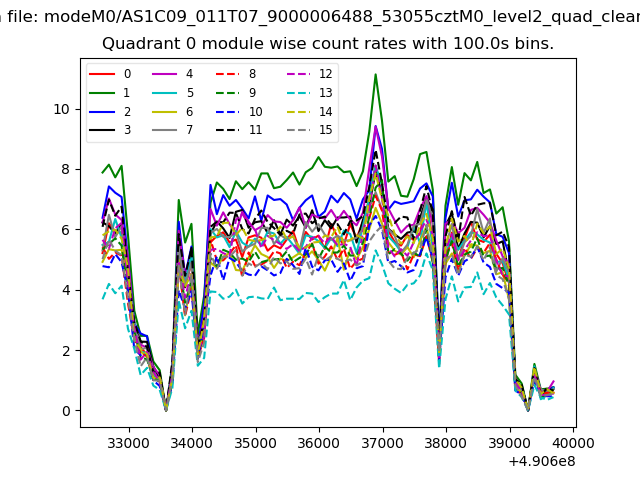 |
 |
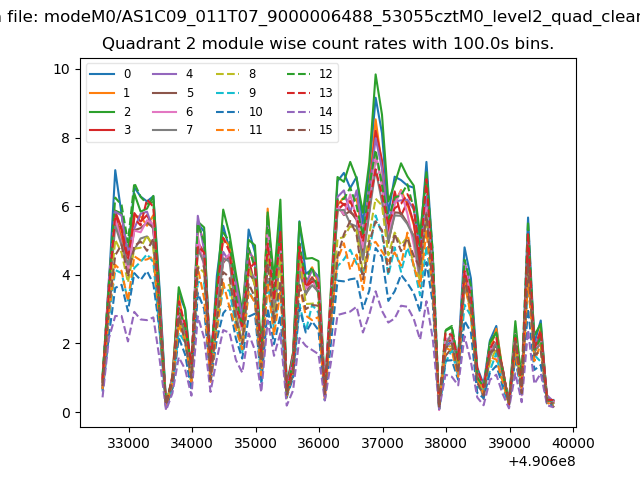
| Module-wise count rates for Quadrant B Data is divided into 100 sec bins |
 |
 |
| Module-wise count rates for Quadrant C Data is divided into 100 sec bins |
 |
 |
| Module-wise count rates for Quadrant D Data is divided into 100 sec bins |
 |
 |
| Parameter | Plot |
|---|---|
| CZT HV Monitor | 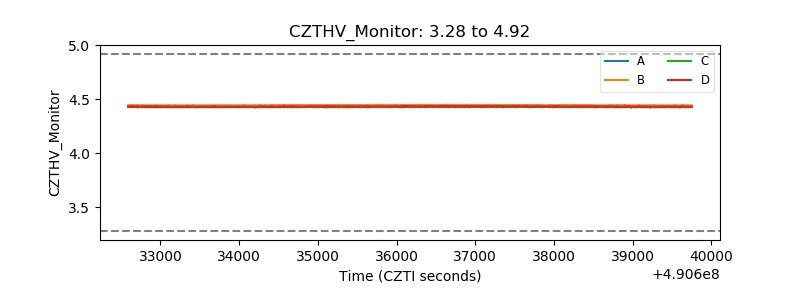 |
| D_VDD | 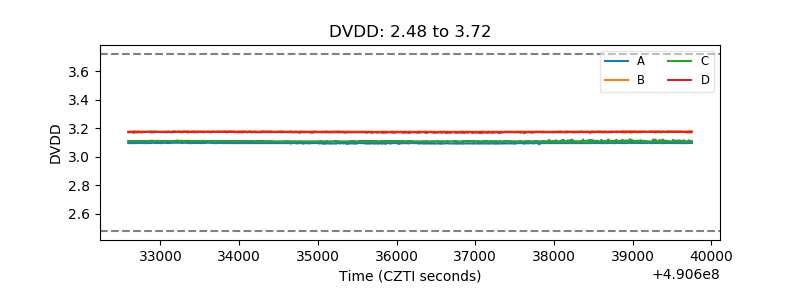 |
| Temperature 1 | 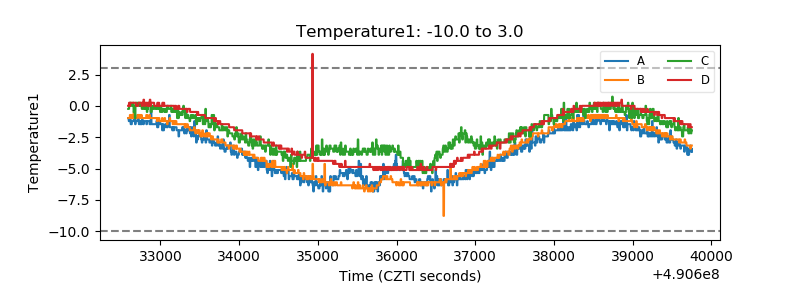 |
| Veto HV Monitor | 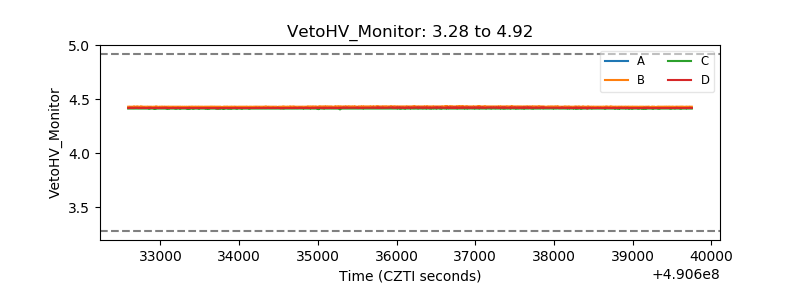 |
| Veto LLD | 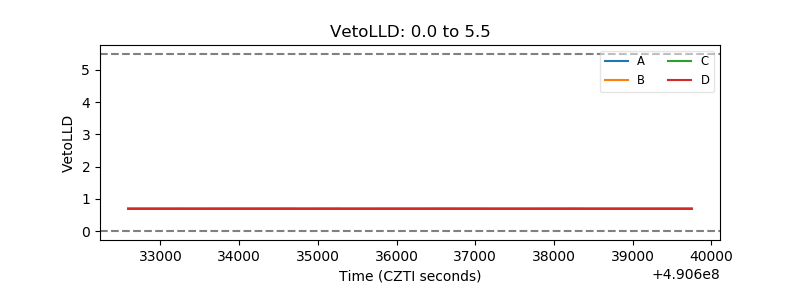 |
| Alpha Counter | 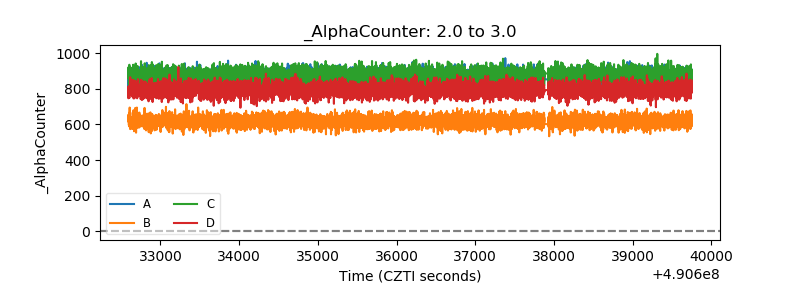 |
| _CPM_Rate | 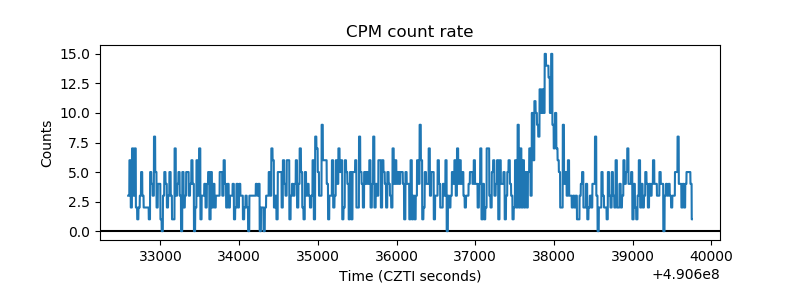 |
| CZT Counter | 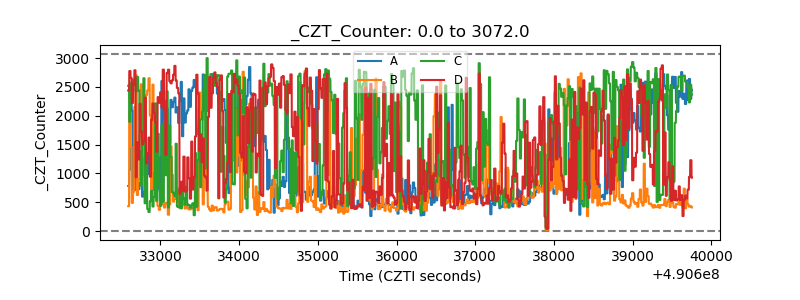 |
| +2.5 Volts monitor |  |
| +5 Volts monitor |  |
| _ROLL_ROT | 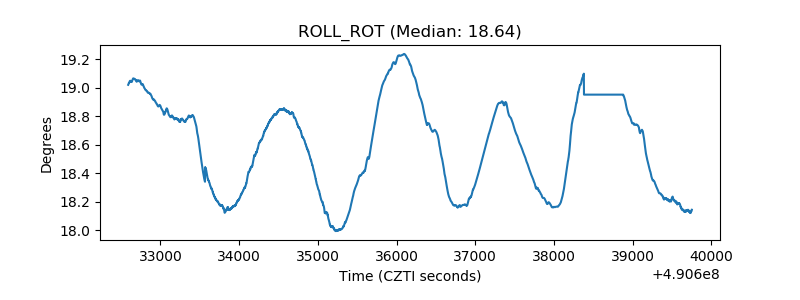 |
| _Roll_DEC | 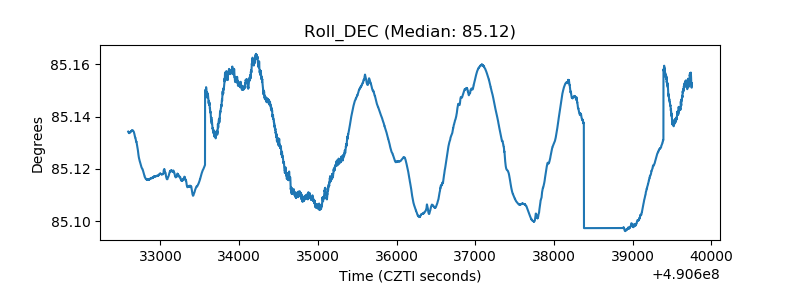 |
| _Roll_RA | 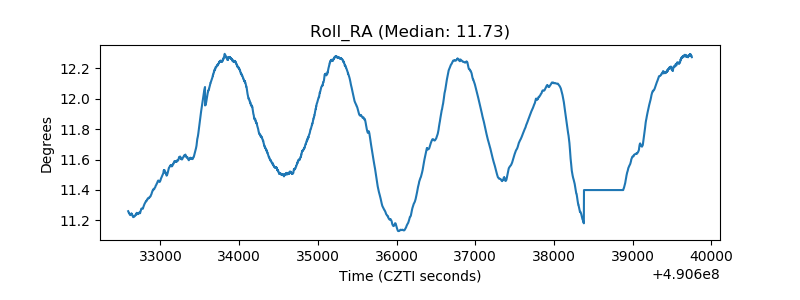 |
| Veto Counter | 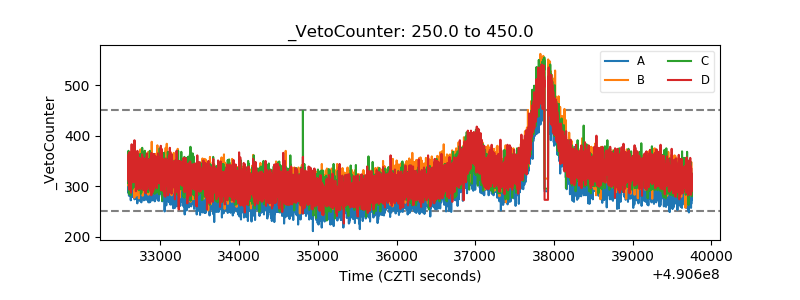 |