| Param | Original file | Final file |
|---|---|---|
| Filename | modeM0/AS1C09_011T07_9000006488_53058cztM0_level2.fits | modeM0/AS1C09_011T07_9000006488_53058cztM0_level2_quad_clean.evt |
| Size (bytes) | 2,731,731,840 | 189,089,280 |
| Size | 2.5 GB | 180.3 MB |
| Events in quadrant A | 18,165,453 | 1,430,448 |
| Events in quadrant B | 16,017,766 | 1,540,649 |
| Events in quadrant C | 30,827,332 | 884,997 |
| Events in quadrant D | 34,752,846 | 650,135 |
| Mode SS | |||
|---|---|---|---|
| Quadrant | BADHDUFLAG | Total packets | Discarded packets |
| A | 0 | 356 | 0 |
| B | 0 | 356 | 0 |
| C | 0 | 356 | 0 |
| D | 0 | 356 | 0 |
| Mode M9 | |||
|---|---|---|---|
| Quadrant | BADHDUFLAG | Total packets | Discarded packets |
| A | 0 | 20 | 0 |
| B | 0 | 20 | 0 |
| C | 0 | 20 | 0 |
| D | 0 | 20 | 0 |
| Mode M0 | |||
|---|---|---|---|
| Quadrant | BADHDUFLAG | Total packets | Discarded packets |
| A | 0 | 66407 | 3 |
| B | 0 | 60037 | 3 |
| C | 0 | 103711 | 3 |
| D | 0 | 115341 | 3 |
| Quadrant | Total seconds | Saturated seconds | Saturation percentage |
|---|---|---|---|
| A | 17665 | 2493 | 14.112652% |
| B | 17666 | 2188 | 12.385373% |
| C | 17666 | 8431 | 47.724442% |
| D | 17666 | 10641 | 60.234348% |
Noise dominated data is calculated using 1-second bins in cleaned event files. If a bin has >2000 counts, and if more than 50% of those come from <1% of pixels, then it is considered to be noise-dominated and hence unusable.
| Quadrant | # 1 sec bins | Bins with >0 counts | Bins with >2000 counts | High rate bins dominated by noise | Noise dominated (total time) | Noise dominated (detector-on time) | Marked lightcurve |
|---|---|---|---|---|---|---|---|
| A | 19500 | 17668 | 2544 | 2544 | 13.05% | 14.40% | 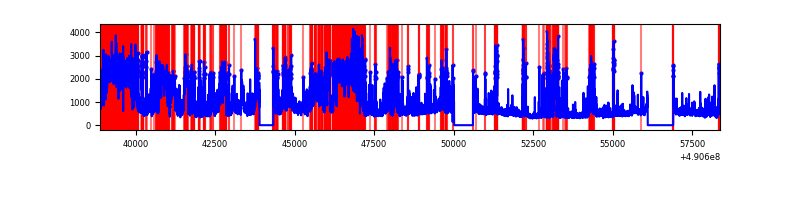 |
| B | 19501 | 17669 | 1656 | 1656 | 8.49% | 9.37% | 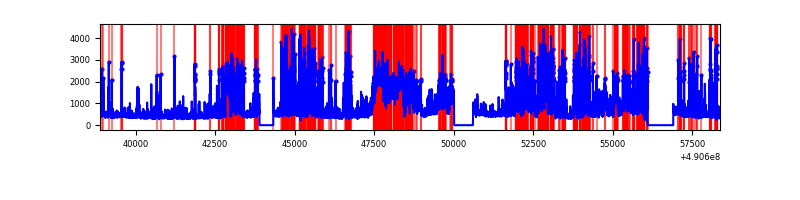 |
| C | 19501 | 17669 | 7650 | 7650 | 39.23% | 43.30% | 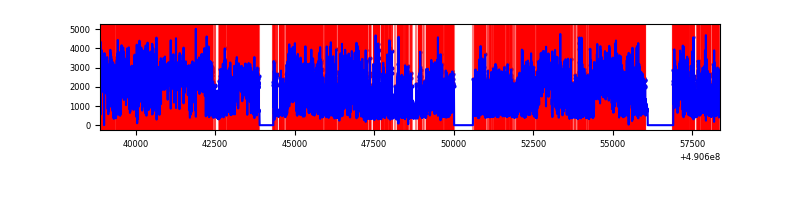 |
| D | 19501 | 17669 | 10093 | 10093 | 51.76% | 57.12% | 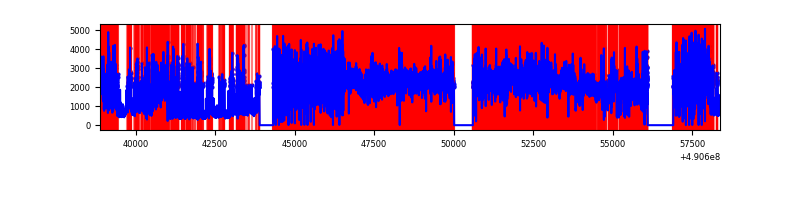 |
Top three noisy pixels from each quadrant. If the there are fewer than three noisy pixels in the level2.evt file, extra rows are filled as -1
| Pixel properties | Quadrant properties | ||||||
|---|---|---|---|---|---|---|---|
| Quadrant | DetID | PixID | Counts | Sigma | Mean | Median | Sigma |
| A | 12 | 80 | 3334241 | 7556.9 | 1761 | 1720 | 441.0 |
| A | 7 | 206 | 3222351 | 7303.17 | 1761 | 1720 | 441.0 |
| A | 15 | 190 | 1628788 | 3689.57 | 1761 | 1720 | 441.0 |
| B | 10 | 254 | 3870917 | 10576.38 | 1736 | 1675 | 365.8 |
| B | 1 | 255 | 2387513 | 6521.57 | 1736 | 1675 | 365.8 |
| B | 10 | 63 | 1604525 | 4381.31 | 1736 | 1675 | 365.8 |
| C | 1 | 241 | 13856956 | 36329.86 | 1372 | 1358 | 381.4 |
| C | 15 | 224 | 5810628 | 15232.11 | 1372 | 1358 | 381.4 |
| C | 13 | 3 | 1894996 | 4965.18 | 1372 | 1358 | 381.4 |
| D | 15 | 78 | 13595018 | 38095.99 | 1217 | 1161 | 356.8 |
| D | 8 | 176 | 7209771 | 20201.71 | 1217 | 1161 | 356.8 |
| D | 12 | 17 | 4881104 | 13675.75 | 1217 | 1161 | 356.8 |
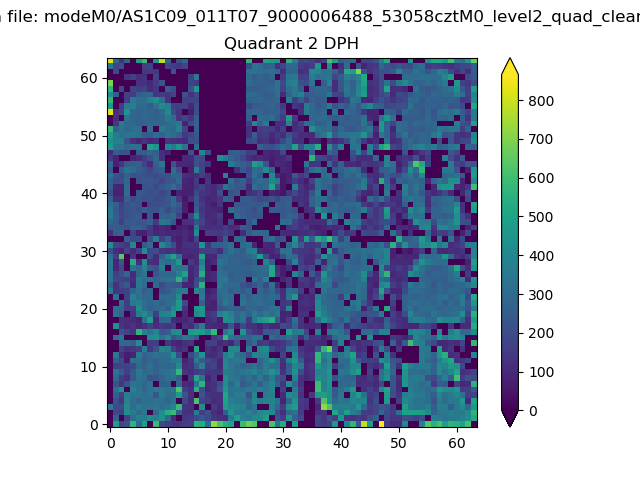
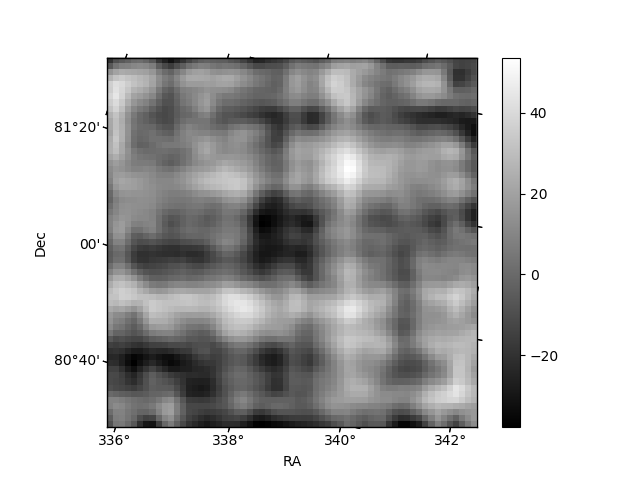
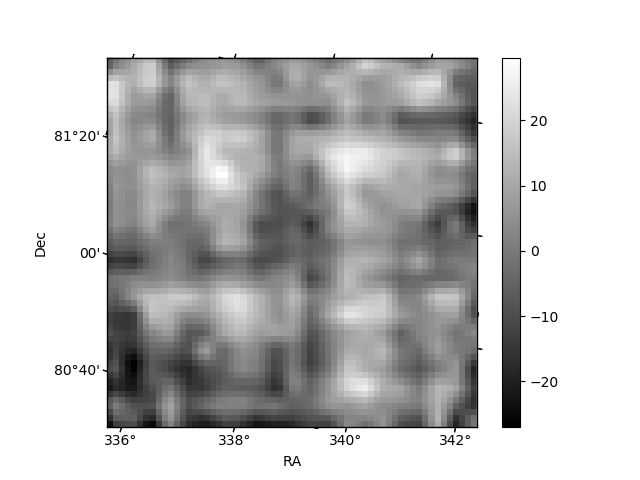
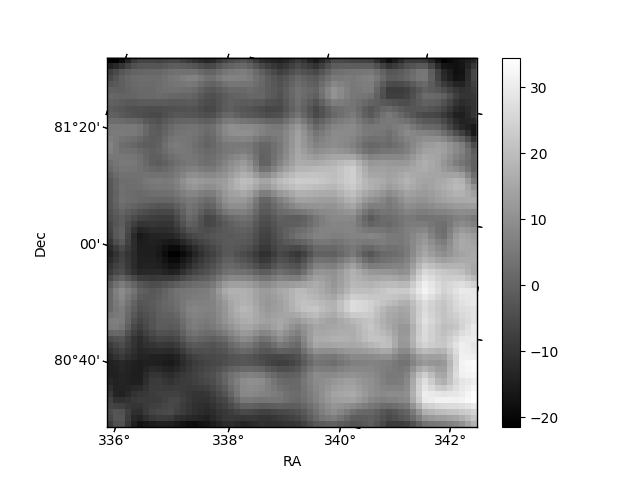
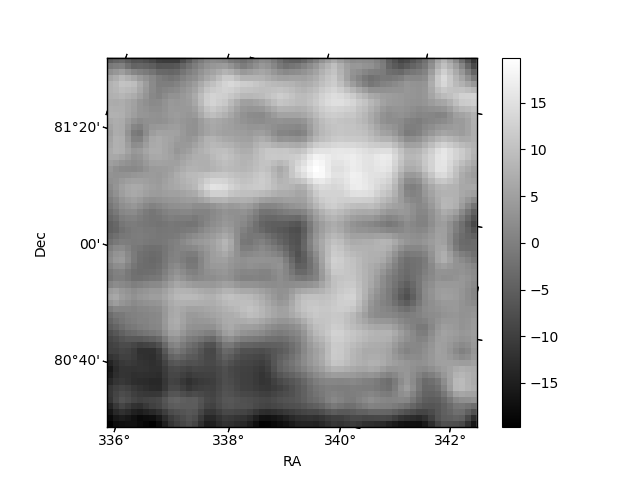
Histogram calculated using DETX and DETY for each event in the final _common_clean file
| Quadrant A | 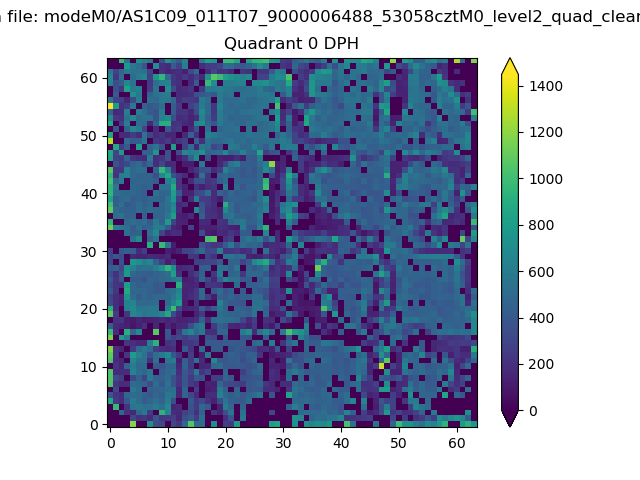 |
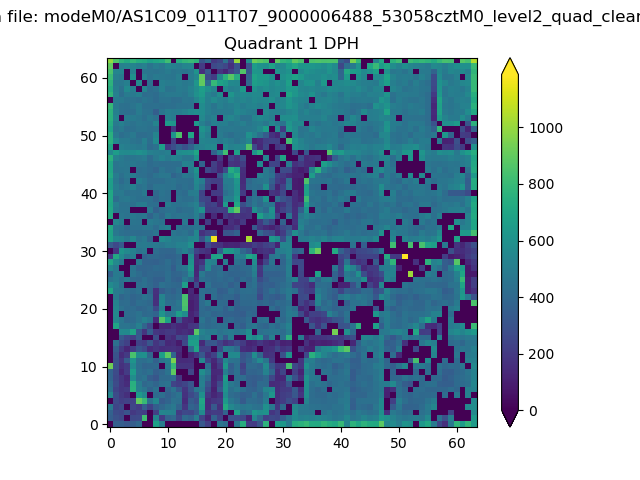 |
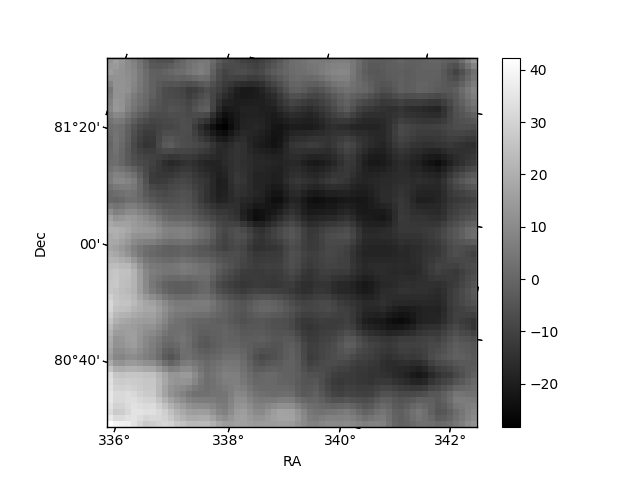
Quadrant B |
|---|---|---|---|
| Quadrant D | 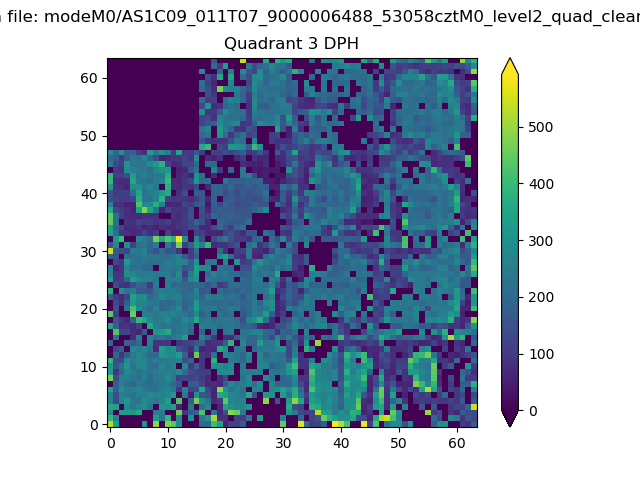 |
 |
Quadrant C |
| Plot type | Count rate plots | Images |
|---|---|---|
| Comparison with Poisson distribution Blue bars denote a histogram of data divided into 1 sec bins. Red curve is a Poisson curve with rate = median count rate of data. |
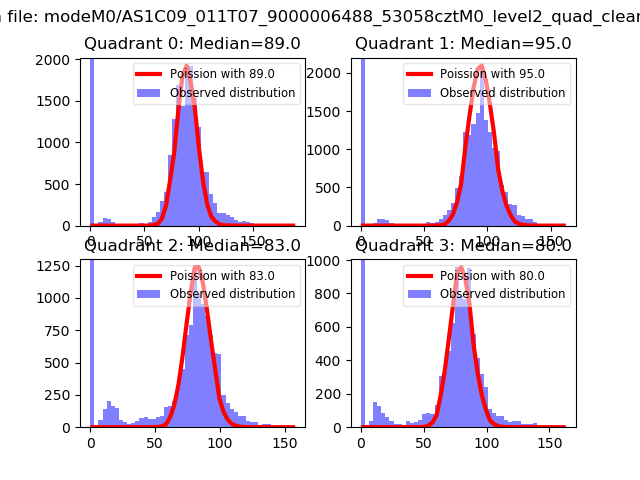 |
 |
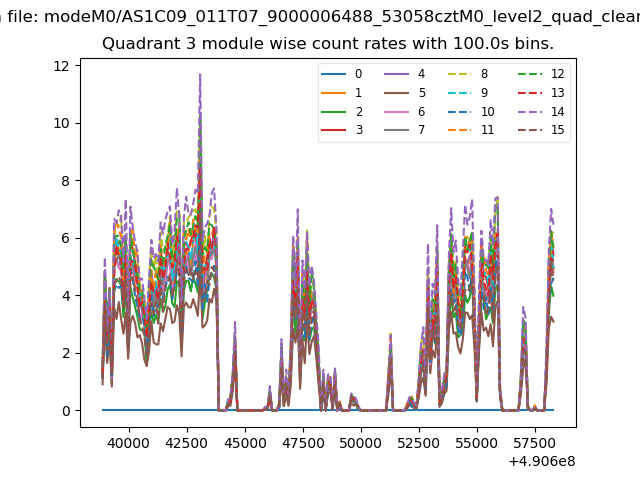
| Quadrant-wise count rates Data is divided into 100 sec bins |
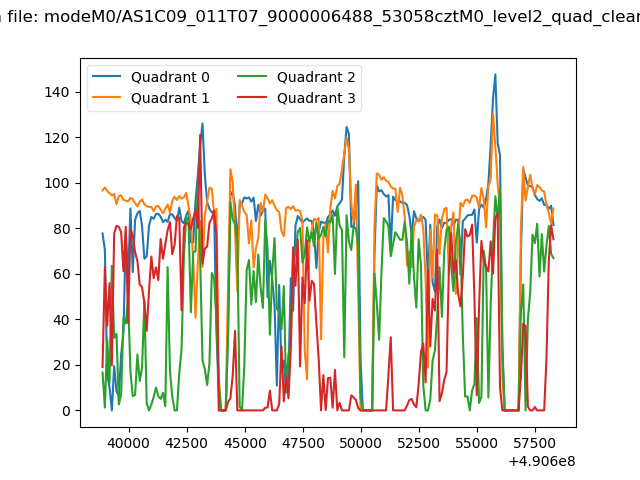 |
|
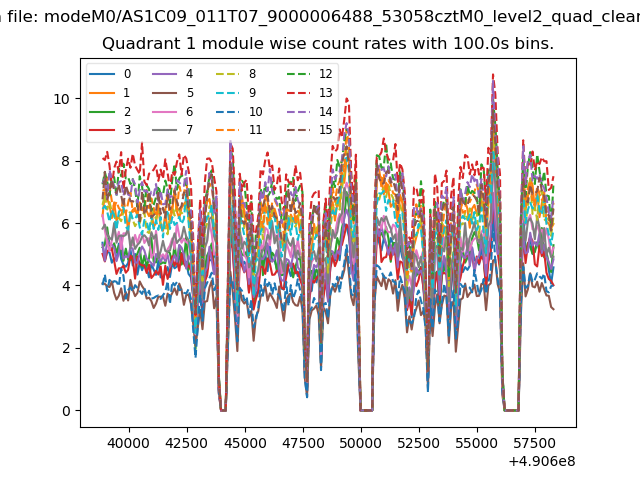
| Module-wise count rates for Quadrant A Data is divided into 100 sec bins |
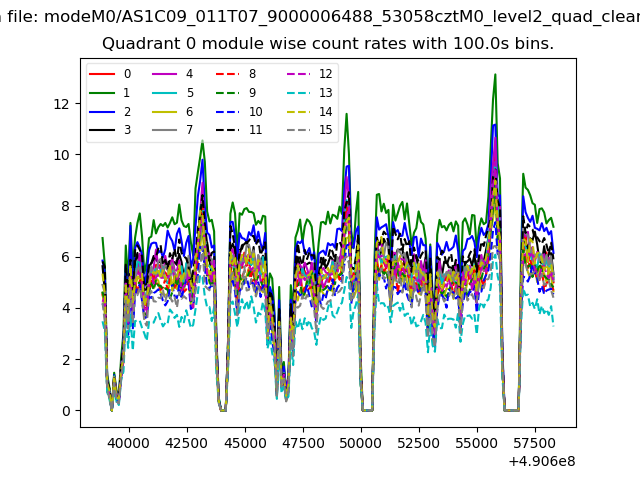 |
 |
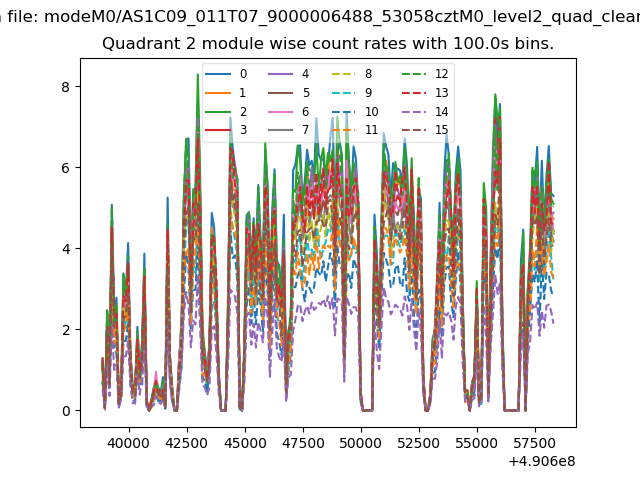
| Module-wise count rates for Quadrant B Data is divided into 100 sec bins |
 |
 |
| Module-wise count rates for Quadrant C Data is divided into 100 sec bins |
 |
 |
| Module-wise count rates for Quadrant D Data is divided into 100 sec bins |
 |
 |
| Parameter | Plot |
|---|---|
| CZT HV Monitor | 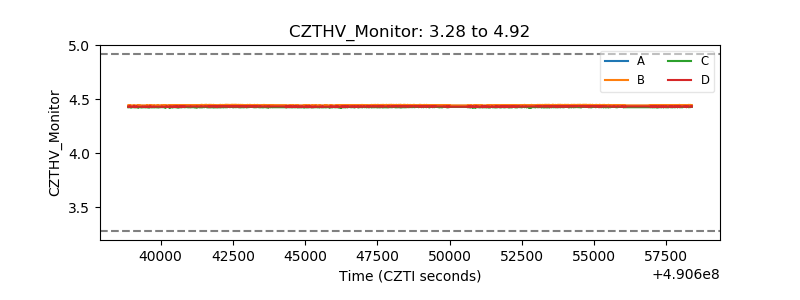 |
| D_VDD | 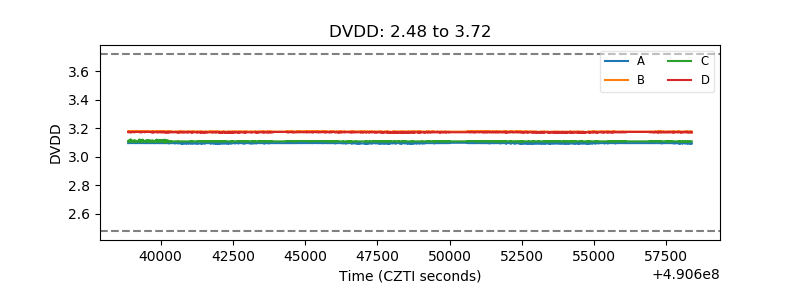 |
| Temperature 1 | 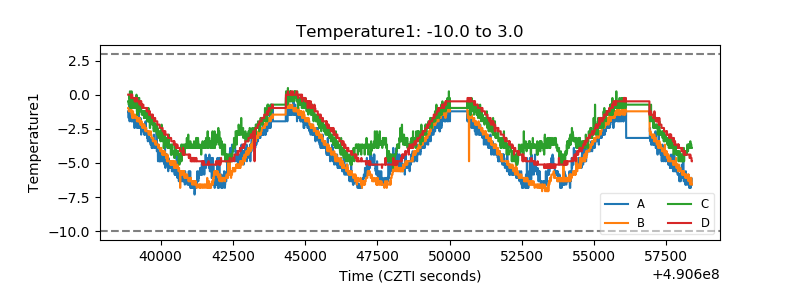 |
| Veto HV Monitor | 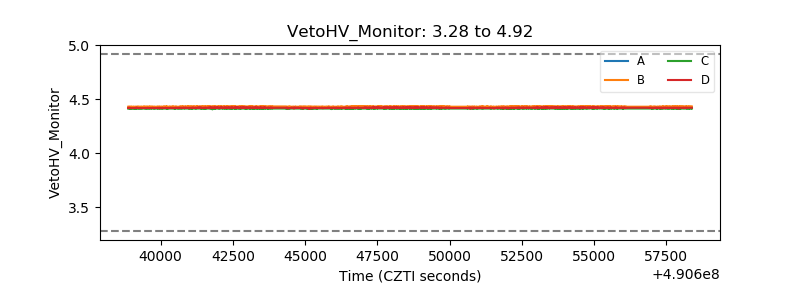 |
| Veto LLD | 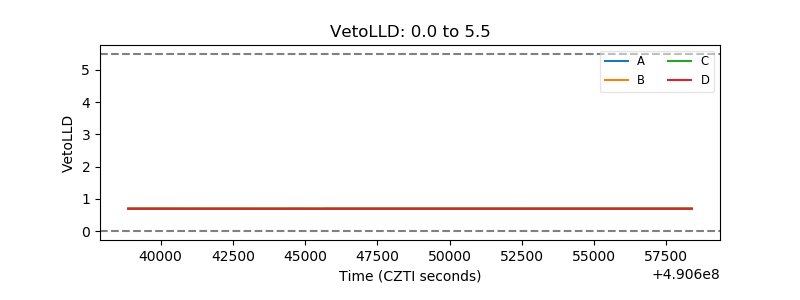 |
| Alpha Counter | 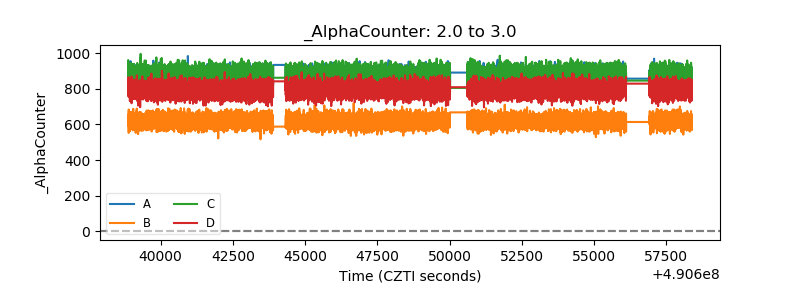 |
| _CPM_Rate | 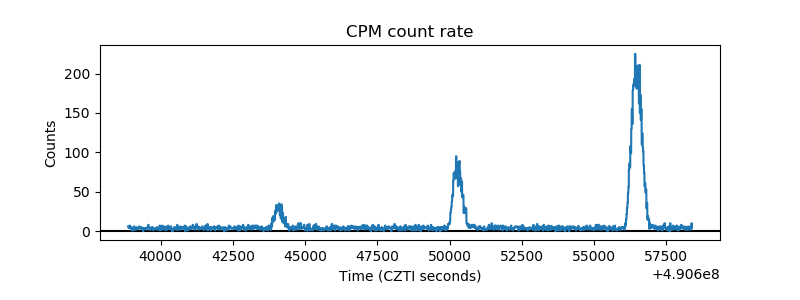 |
| CZT Counter | 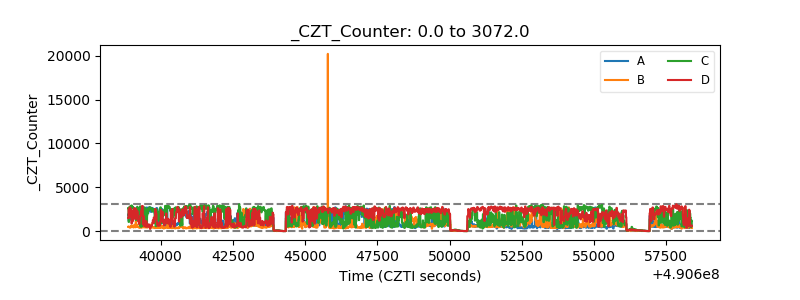 |
| +2.5 Volts monitor |  |
| +5 Volts monitor | 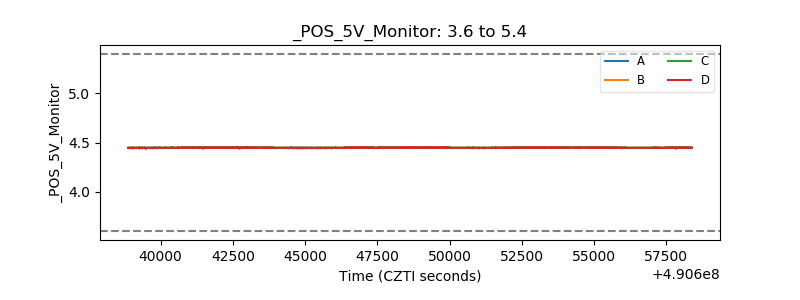 |
| _ROLL_ROT | 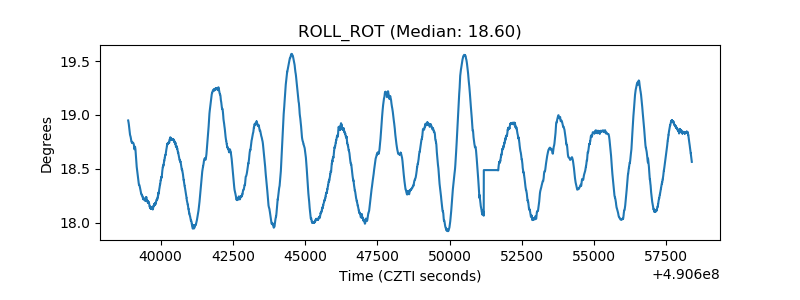 |
| _Roll_DEC | 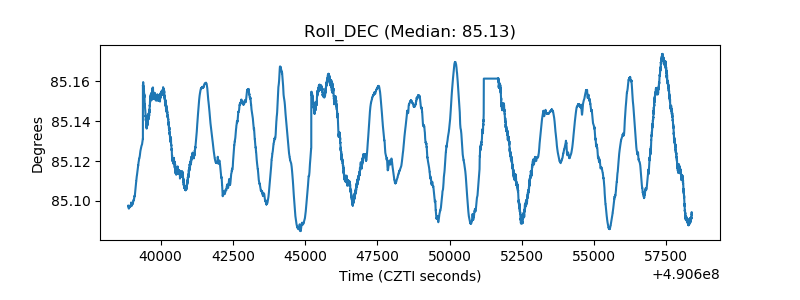 |
| _Roll_RA | 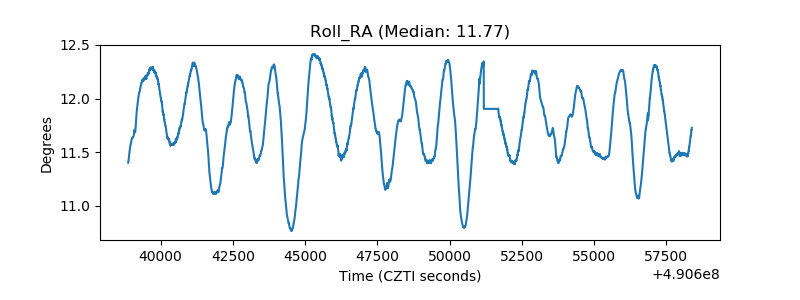 |
| Veto Counter | 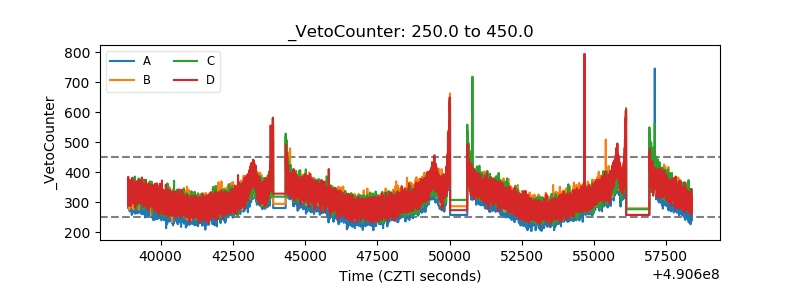 |