| Param | Original file | Final file |
|---|---|---|
| Filename | modeM0/AS1C09_011T07_9000006488_53059cztM0_level2.fits | modeM0/AS1C09_011T07_9000006488_53059cztM0_level2_quad_clean.evt |
| Size (bytes) | 809,040,960 | 84,228,480 |
| Size | 771.6 MB | 80.3 MB |
| Events in quadrant A | 4,642,539 | 611,880 |
| Events in quadrant B | 4,781,085 | 639,670 |
| Events in quadrant C | 10,180,544 | 417,639 |
| Events in quadrant D | 9,831,650 | 418,787 |
| Mode SS | |||
|---|---|---|---|
| Quadrant | BADHDUFLAG | Total packets | Discarded packets |
| A | 0 | 134 | 0 |
| B | 0 | 134 | 0 |
| C | 0 | 134 | 0 |
| D | 0 | 134 | 0 |
| Mode M9 | |||
|---|---|---|---|
| Quadrant | BADHDUFLAG | Total packets | Discarded packets |
| A | 0 | 10 | 0 |
| B | 0 | 10 | 0 |
| C | 0 | 10 | 0 |
| D | 0 | 10 | 0 |
| Mode M0 | |||
|---|---|---|---|
| Quadrant | BADHDUFLAG | Total packets | Discarded packets |
| A | 0 | 18493 | 1 |
| B | 0 | 18874 | 1 |
| C | 0 | 34835 | 4 |
| D | 0 | 33969 | 1 |
| Quadrant | Total seconds | Saturated seconds | Saturation percentage |
|---|---|---|---|
| A | 6626 | 419 | 6.323574% |
| B | 6627 | 457 | 6.896031% |
| C | 6626 | 2432 | 36.703894% |
| D | 6626 | 2074 | 31.300936% |
Noise dominated data is calculated using 1-second bins in cleaned event files. If a bin has >2000 counts, and if more than 50% of those come from <1% of pixels, then it is considered to be noise-dominated and hence unusable.
| Quadrant | # 1 sec bins | Bins with >0 counts | Bins with >2000 counts | High rate bins dominated by noise | Noise dominated (total time) | Noise dominated (detector-on time) | Marked lightcurve |
|---|---|---|---|---|---|---|---|
| A | 7581 | 6627 | 315 | 315 | 4.16% | 4.75% | 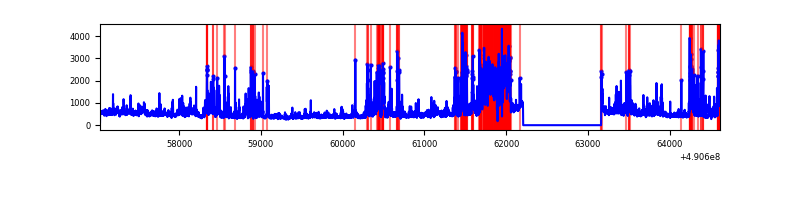 |
| B | 7582 | 6628 | 347 | 347 | 4.58% | 5.24% | 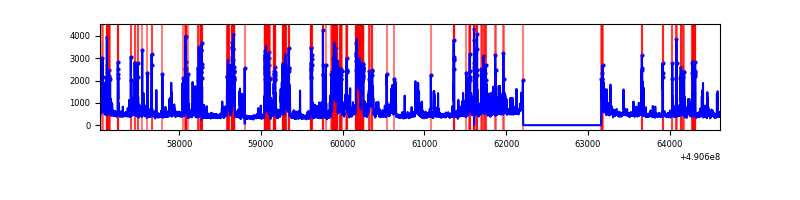 |
| C | 7581 | 6627 | 2169 | 2169 | 28.61% | 32.73% | 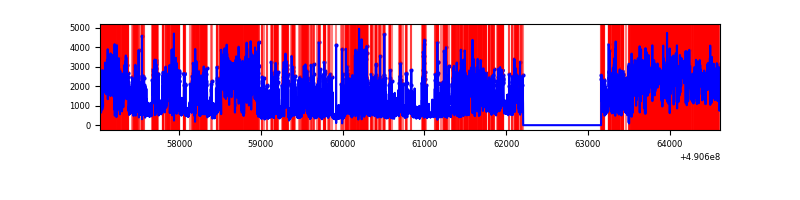 |
| D | 7581 | 6627 | 1926 | 1926 | 25.41% | 29.06% | 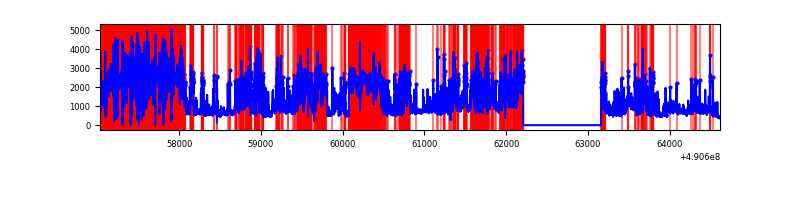 |
Top three noisy pixels from each quadrant. If the there are fewer than three noisy pixels in the level2.evt file, extra rows are filled as -1
| Pixel properties | Quadrant properties | ||||||
|---|---|---|---|---|---|---|---|
| Quadrant | DetID | PixID | Counts | Sigma | Mean | Median | Sigma |
| A | 7 | 206 | 939793 | 5617.88 | 671 | 656 | 167.2 |
| A | 9 | 191 | 233726 | 1394.22 | 671 | 656 | 167.2 |
| A | 0 | 8 | 203166 | 1211.41 | 671 | 656 | 167.2 |
| B | 1 | 255 | 948227 | 6757.56 | 660 | 637 | 140.2 |
| B | 10 | 63 | 358295 | 2550.57 | 660 | 637 | 140.2 |
| B | 5 | 172 | 206941 | 1471.22 | 660 | 637 | 140.2 |
| C | 1 | 241 | 3283949 | 21217.83 | 562 | 556 | 154.7 |
| C | 15 | 224 | 2840145 | 18349.89 | 562 | 556 | 154.7 |
| C | 0 | 193 | 492175 | 3176.92 | 562 | 556 | 154.7 |
| D | 8 | 176 | 2354113 | 14719.09 | 548 | 523 | 159.9 |
| D | 12 | 17 | 1622142 | 10141.43 | 548 | 523 | 159.9 |
| D | 15 | 78 | 1553804 | 9714.05 | 548 | 523 | 159.9 |
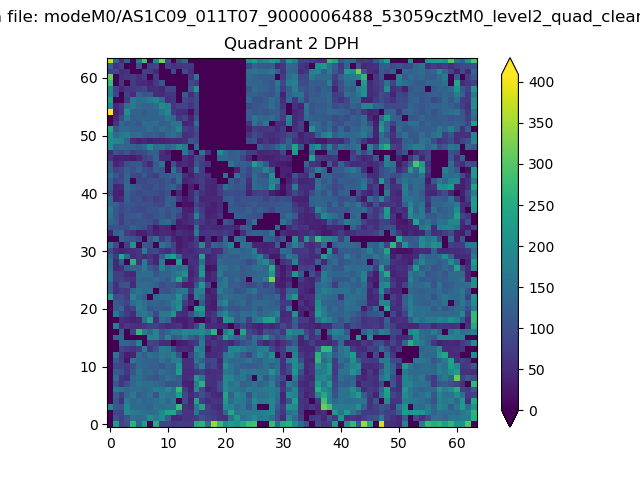
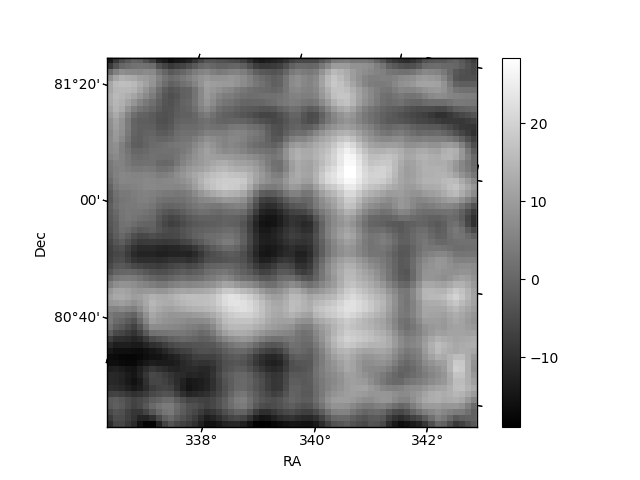
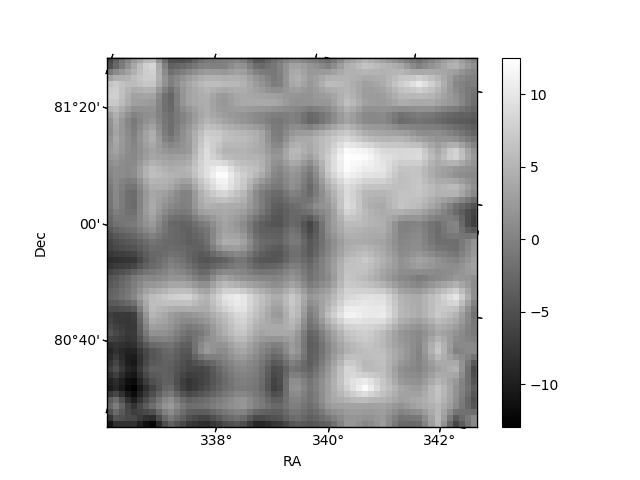
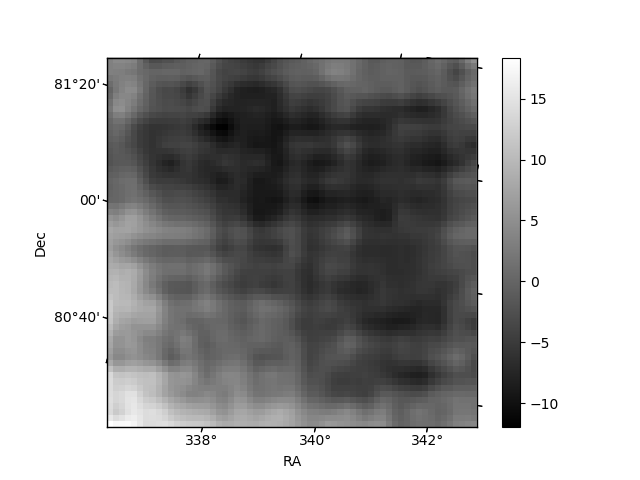
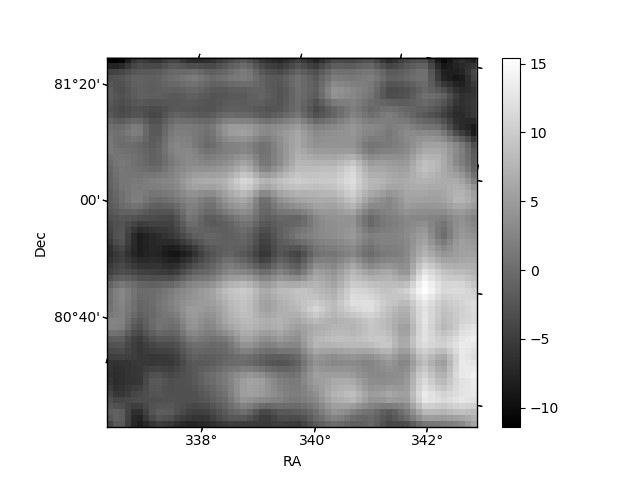
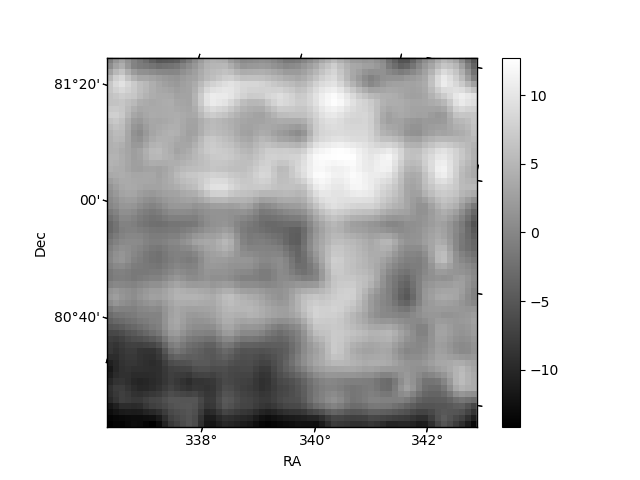
Histogram calculated using DETX and DETY for each event in the final _common_clean file
| Quadrant A | 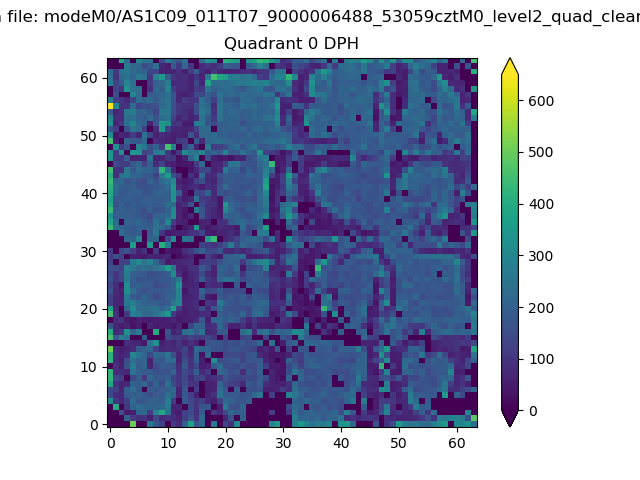 |
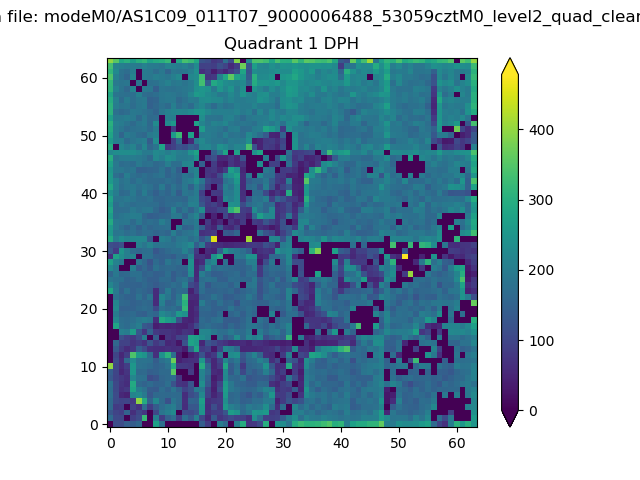 |
Quadrant B |
|---|---|---|---|
| Quadrant D | 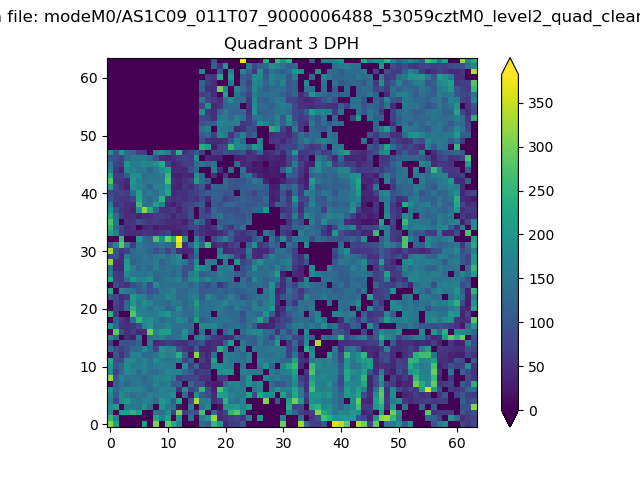 |
 |
Quadrant C |
| Plot type | Count rate plots | Images |
|---|---|---|
| Comparison with Poisson distribution Blue bars denote a histogram of data divided into 1 sec bins. Red curve is a Poisson curve with rate = median count rate of data. |
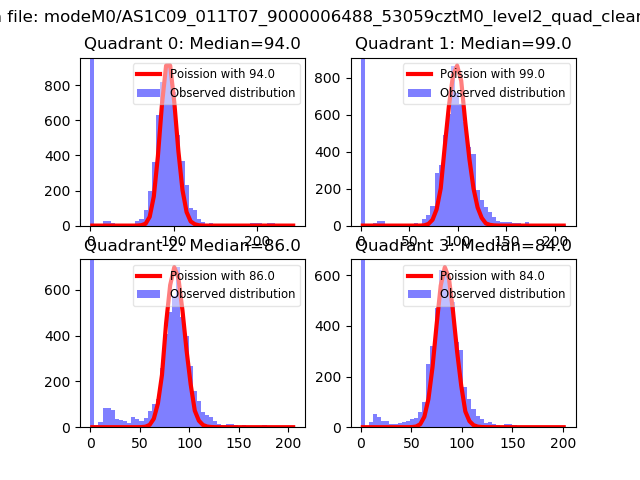 |
 |
| Quadrant-wise count rates Data is divided into 100 sec bins |
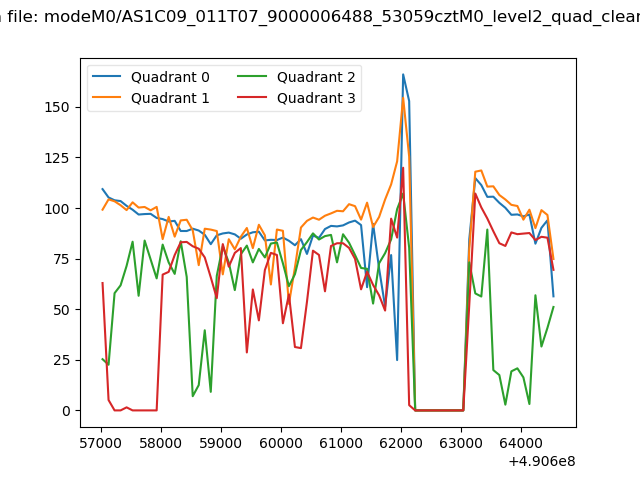 |
|
| Module-wise count rates for Quadrant A Data is divided into 100 sec bins |
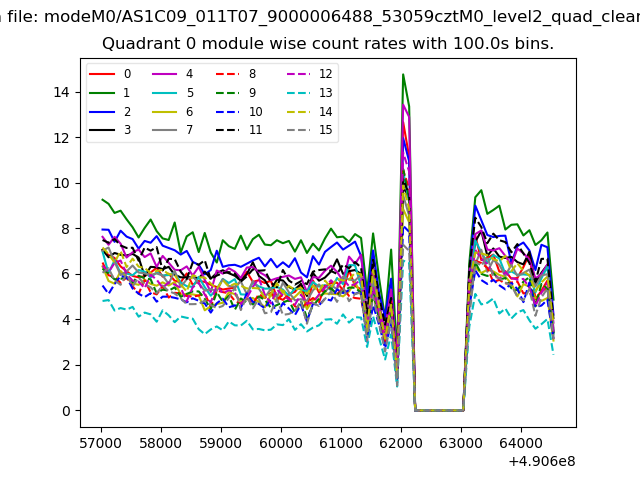 |
 |
| Module-wise count rates for Quadrant B Data is divided into 100 sec bins |
 |
 |
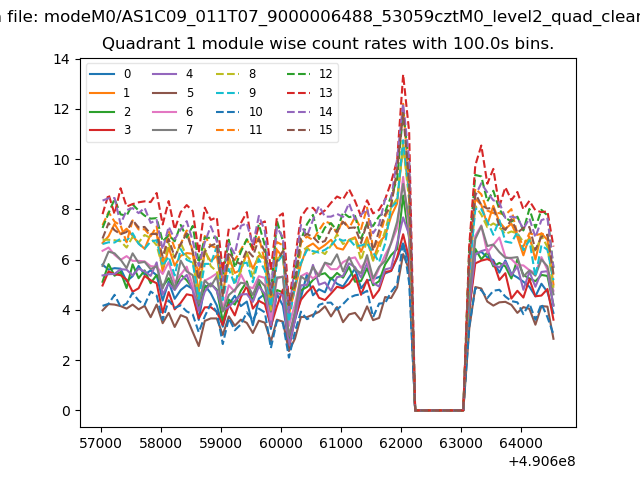
| Module-wise count rates for Quadrant C Data is divided into 100 sec bins |
 |
 |
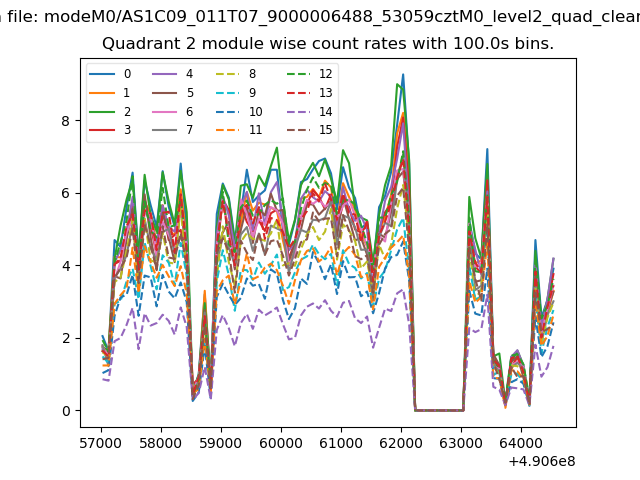
| Module-wise count rates for Quadrant D Data is divided into 100 sec bins |
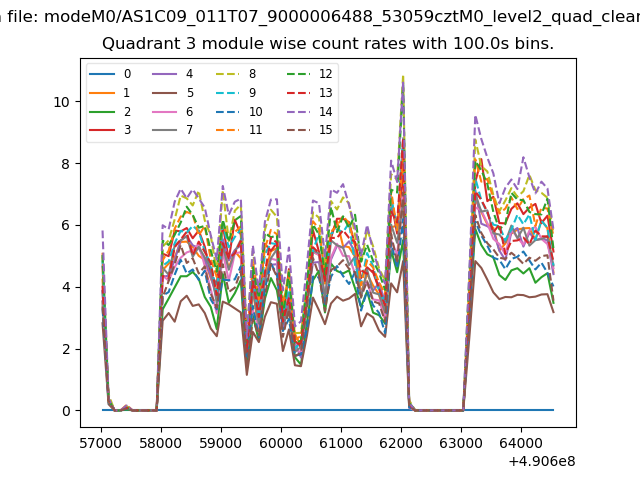 |
 |
| Parameter | Plot |
|---|---|
| CZT HV Monitor |  |
| D_VDD | 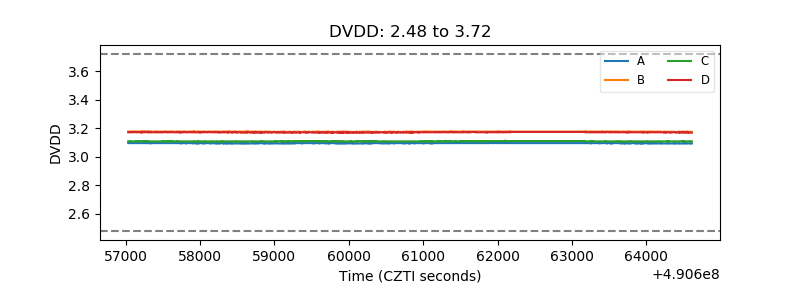 |
| Temperature 1 | 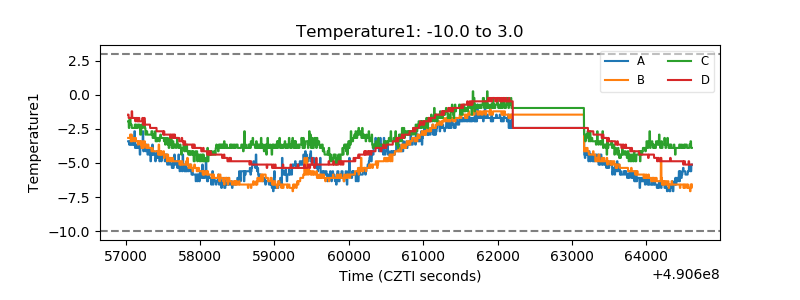 |
| Veto HV Monitor | 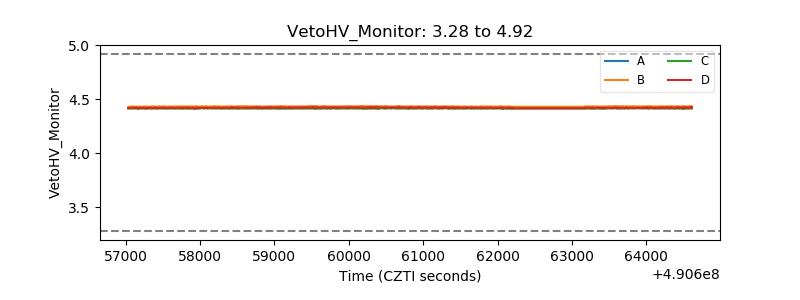 |
| Veto LLD | 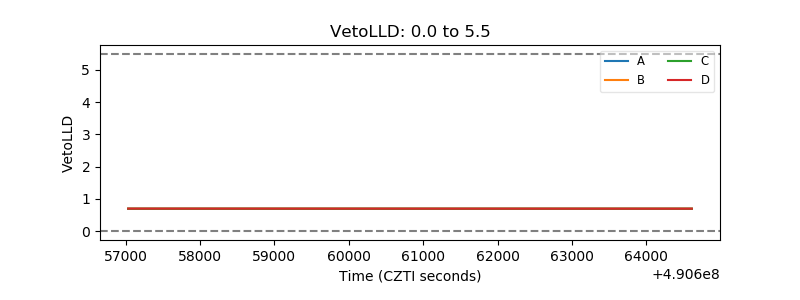 |
| Alpha Counter | 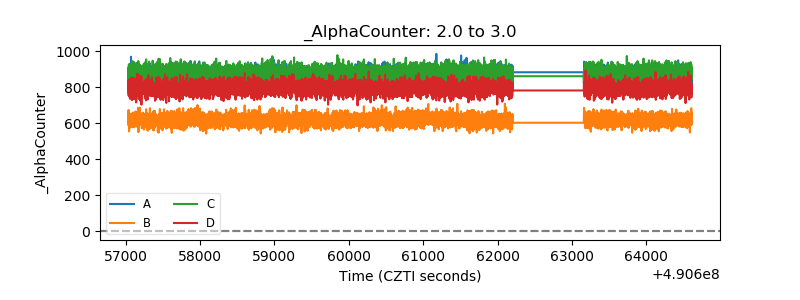 |
| _CPM_Rate | 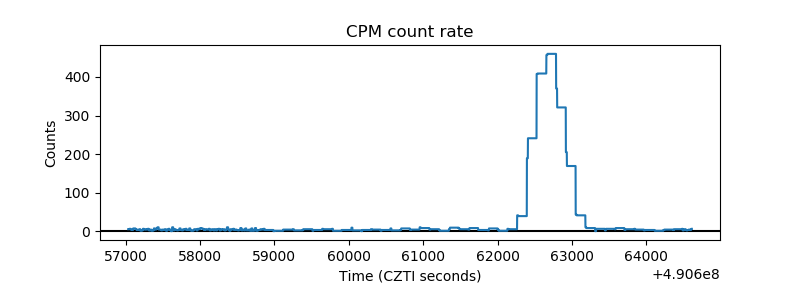 |
| CZT Counter | 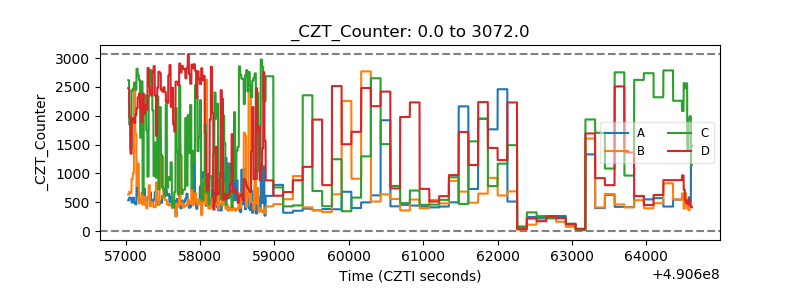 |
| +2.5 Volts monitor |  |
| +5 Volts monitor |  |
| _ROLL_ROT | 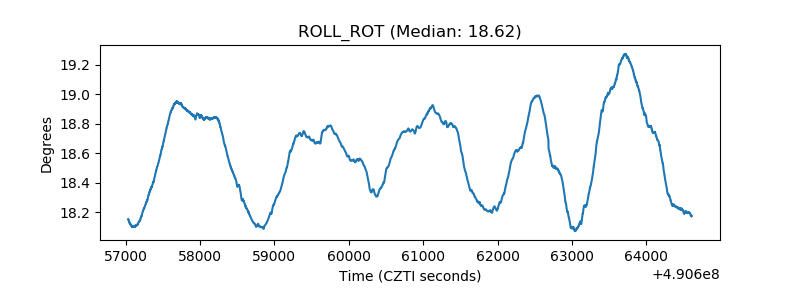 |
| _Roll_DEC | 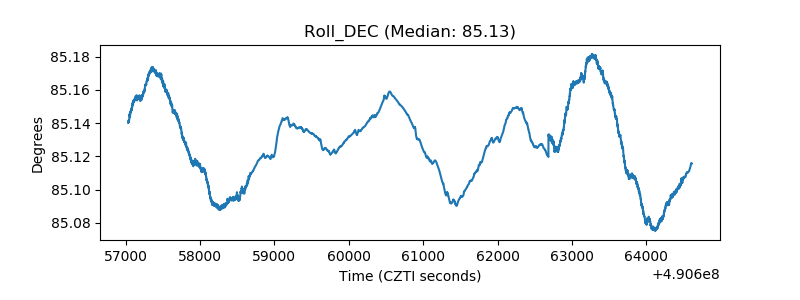 |
| _Roll_RA | 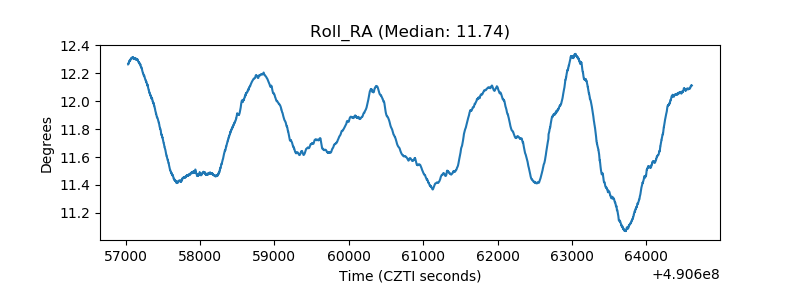 |
| Veto Counter | 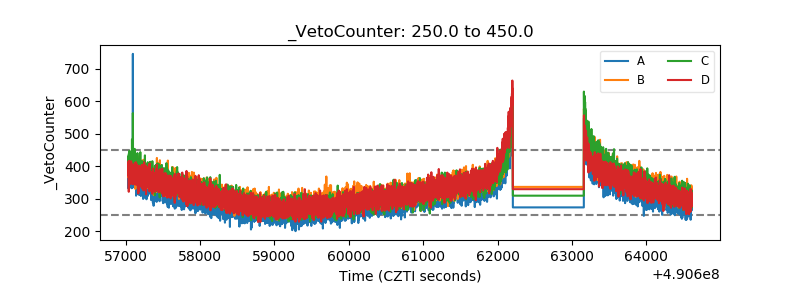 |