| Param | Original file | Final file |
|---|---|---|
| Filename | modeM0/AS1C09_011T07_9000006488_53061cztM0_level2.fits | modeM0/AS1C09_011T07_9000006488_53061cztM0_level2_quad_clean.evt |
| Size (bytes) | 824,846,400 | 80,962,560 |
| Size | 786.6 MB | 77.2 MB |
| Events in quadrant A | 4,988,969 | 600,824 |
| Events in quadrant B | 4,976,813 | 630,308 |
| Events in quadrant C | 13,636,409 | 232,776 |
| Events in quadrant D | 6,420,937 | 527,620 |
| Mode SS | |||
|---|---|---|---|
| Quadrant | BADHDUFLAG | Total packets | Discarded packets |
| A | 0 | 134 | 0 |
| B | 0 | 134 | 0 |
| C | 0 | 134 | 0 |
| D | 0 | 134 | 0 |
| Mode M9 | |||
|---|---|---|---|
| Quadrant | BADHDUFLAG | Total packets | Discarded packets |
| A | 0 | 10 | 0 |
| B | 0 | 10 | 0 |
| C | 0 | 10 | 0 |
| D | 0 | 10 | 0 |
| Mode M0 | |||
|---|---|---|---|
| Quadrant | BADHDUFLAG | Total packets | Discarded packets |
| A | 0 | 19509 | 1 |
| B | 0 | 19436 | 1 |
| C | 0 | 45026 | 1 |
| D | 0 | 23685 | 2 |
| Quadrant | Total seconds | Saturated seconds | Saturation percentage |
|---|---|---|---|
| A | 6589 | 444 | 6.738504% |
| B | 6590 | 511 | 7.754173% |
| C | 6590 | 4338 | 65.827011% |
| D | 6589 | 714 | 10.836242% |
Noise dominated data is calculated using 1-second bins in cleaned event files. If a bin has >2000 counts, and if more than 50% of those come from <1% of pixels, then it is considered to be noise-dominated and hence unusable.
| Quadrant | # 1 sec bins | Bins with >0 counts | Bins with >2000 counts | High rate bins dominated by noise | Noise dominated (total time) | Noise dominated (detector-on time) | Marked lightcurve |
|---|---|---|---|---|---|---|---|
| A | 7624 | 6590 | 357 | 357 | 4.68% | 5.42% | 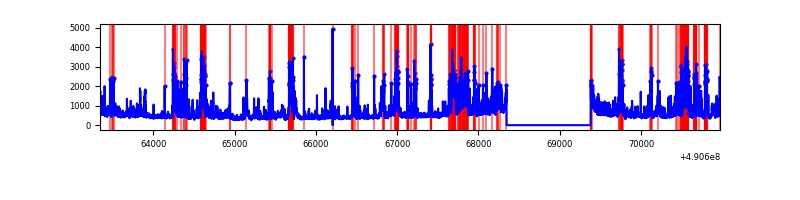 |
| B | 7625 | 6591 | 344 | 344 | 4.51% | 5.22% | 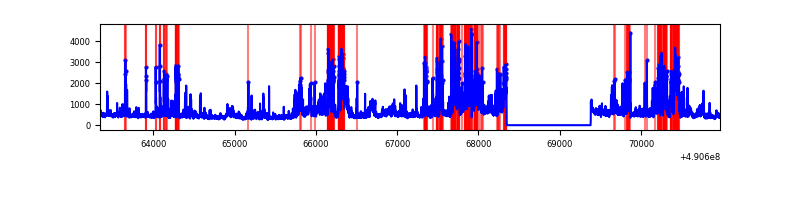 |
| C | 7625 | 6591 | 3990 | 3990 | 52.33% | 60.54% | 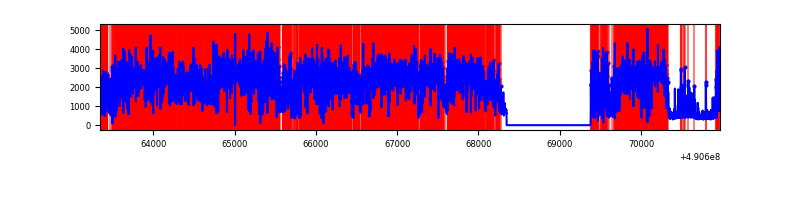 |
| D | 7624 | 6590 | 599 | 599 | 7.86% | 9.09% | 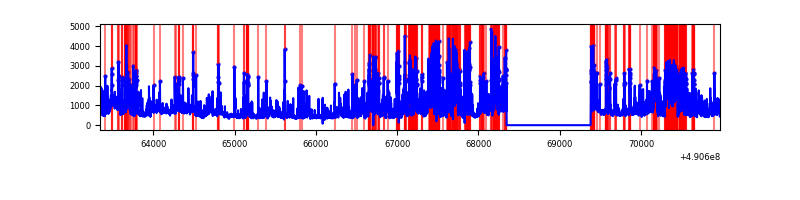 |
Top three noisy pixels from each quadrant. If the there are fewer than three noisy pixels in the level2.evt file, extra rows are filled as -1
| Pixel properties | Quadrant properties | ||||||
|---|---|---|---|---|---|---|---|
| Quadrant | DetID | PixID | Counts | Sigma | Mean | Median | Sigma |
| A | 7 | 206 | 1099527 | 6689.14 | 659 | 642 | 164.3 |
| A | 9 | 191 | 619193 | 3765.25 | 659 | 642 | 164.3 |
| A | 0 | 8 | 223153 | 1354.47 | 659 | 642 | 164.3 |
| B | 1 | 255 | 1077510 | 7747.01 | 651 | 630 | 139.0 |
| B | 10 | 63 | 479166 | 3442.56 | 651 | 630 | 139.0 |
| B | 10 | 254 | 403190 | 2895.99 | 651 | 630 | 139.0 |
| C | 1 | 241 | 9123666 | 76027.72 | 434 | 428 | 120.0 |
| C | 15 | 224 | 1636018 | 13630.05 | 434 | 428 | 120.0 |
| C | 15 | 244 | 498766 | 4152.86 | 434 | 428 | 120.0 |
| D | 12 | 17 | 1034217 | 5721.18 | 625 | 598 | 180.7 |
| D | 11 | 245 | 673175 | 3722.78 | 625 | 598 | 180.7 |
| D | 15 | 78 | 543839 | 3006.89 | 625 | 598 | 180.7 |
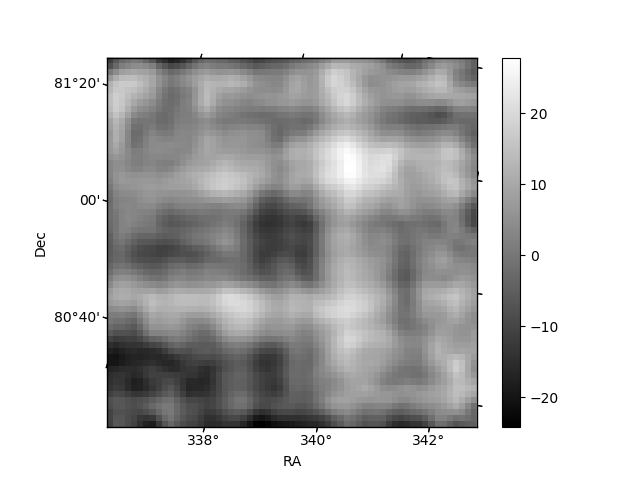
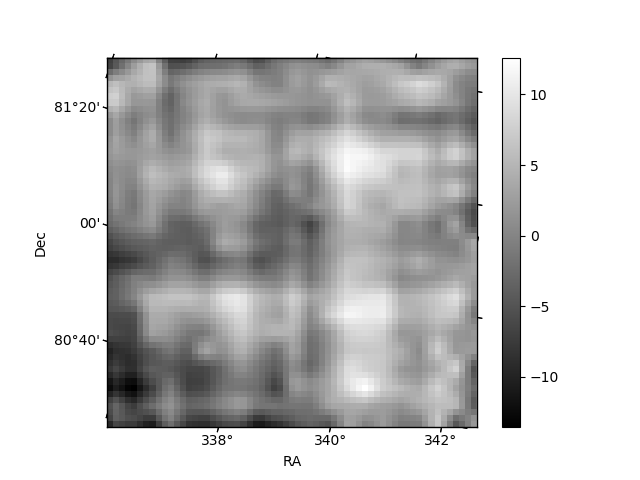
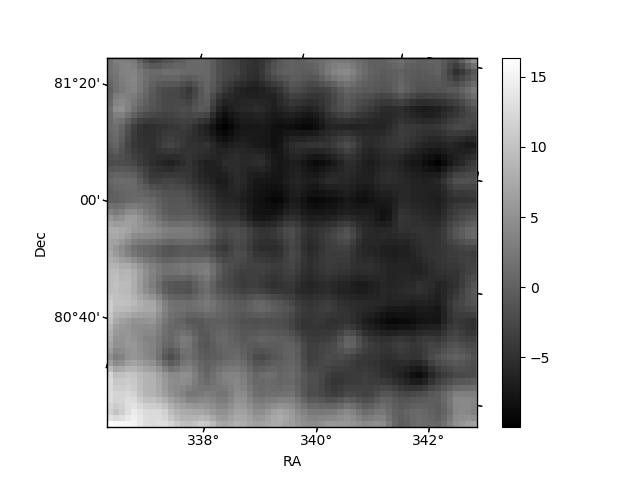
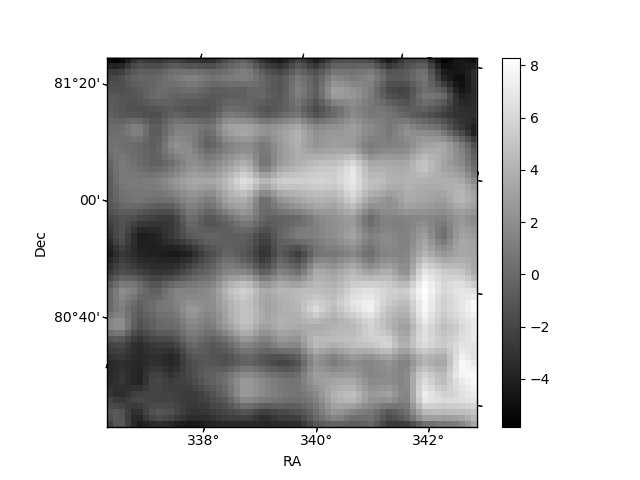
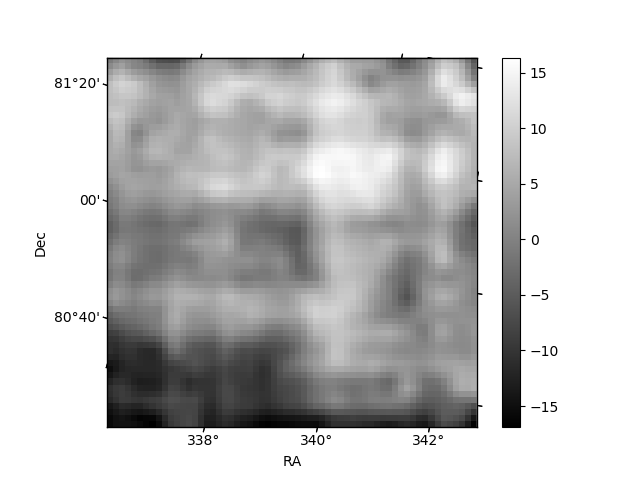
Histogram calculated using DETX and DETY for each event in the final _common_clean file
| Quadrant A | 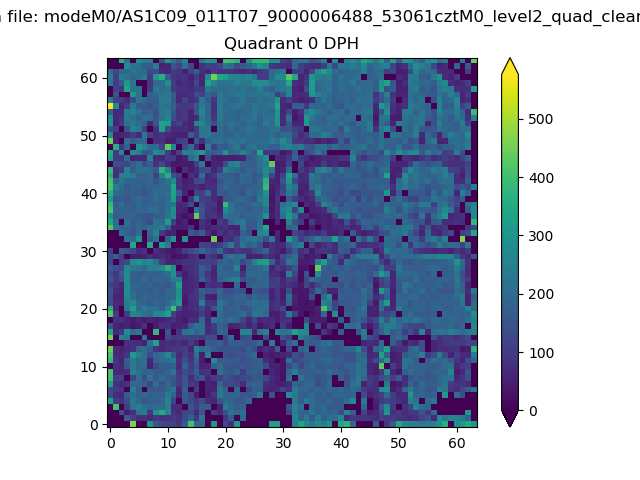 |
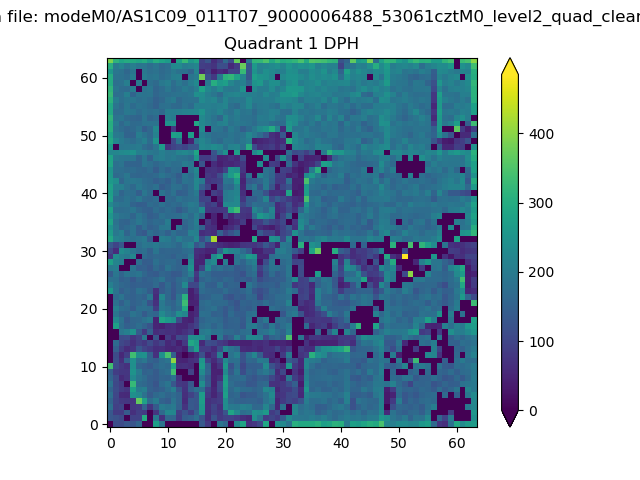 |
Quadrant B |
|---|---|---|---|
| Quadrant D | 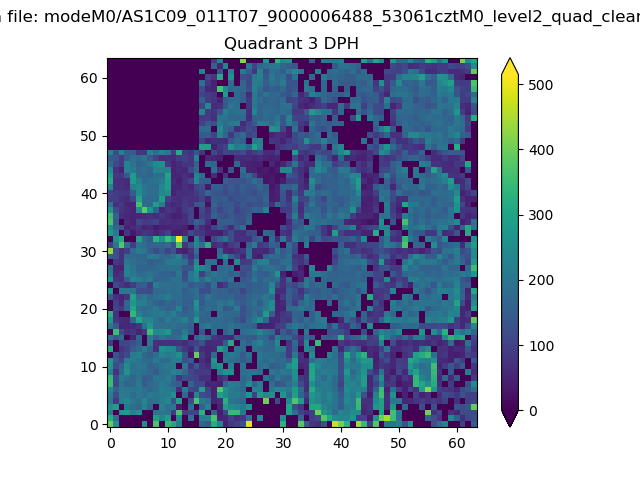 |
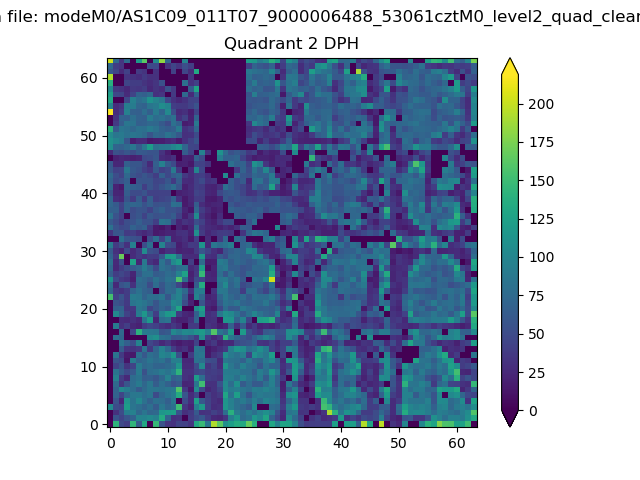 |
Quadrant C |
| Plot type | Count rate plots | Images |
|---|---|---|
| Comparison with Poisson distribution Blue bars denote a histogram of data divided into 1 sec bins. Red curve is a Poisson curve with rate = median count rate of data. |
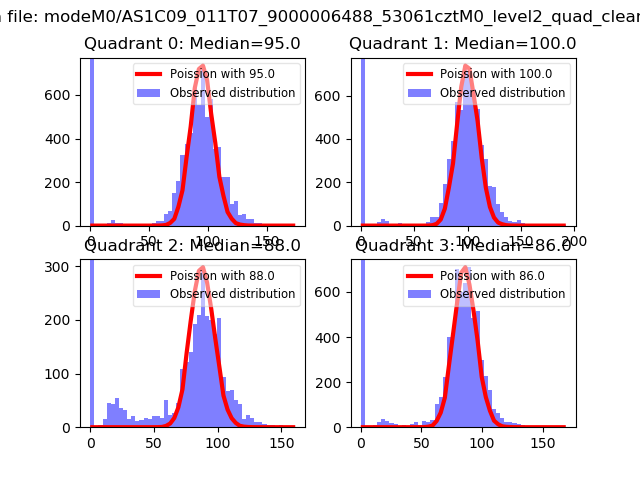 |
 |
| Quadrant-wise count rates Data is divided into 100 sec bins |
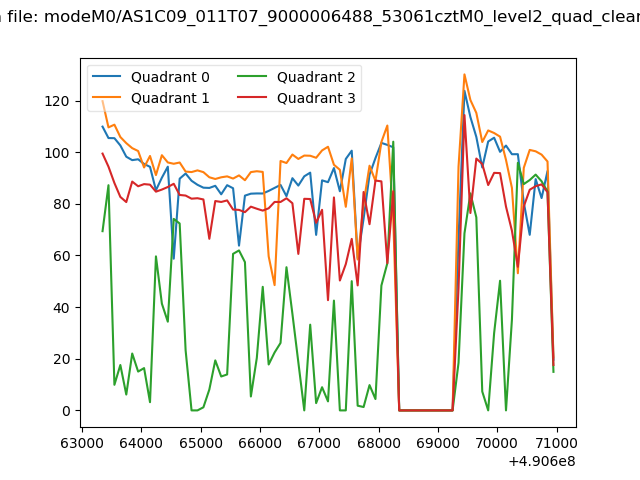 |
|
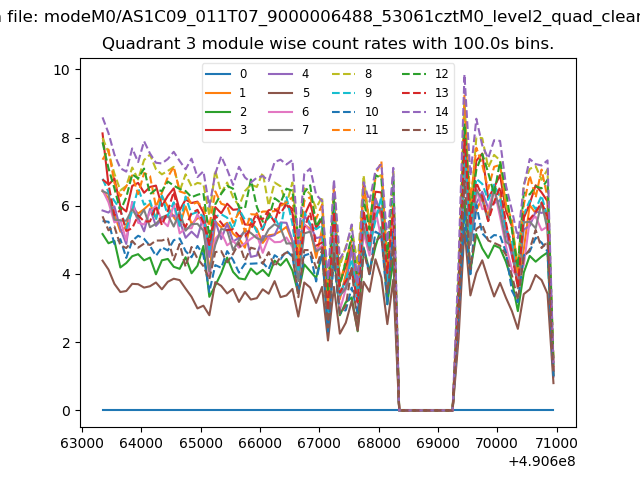
| Module-wise count rates for Quadrant A Data is divided into 100 sec bins |
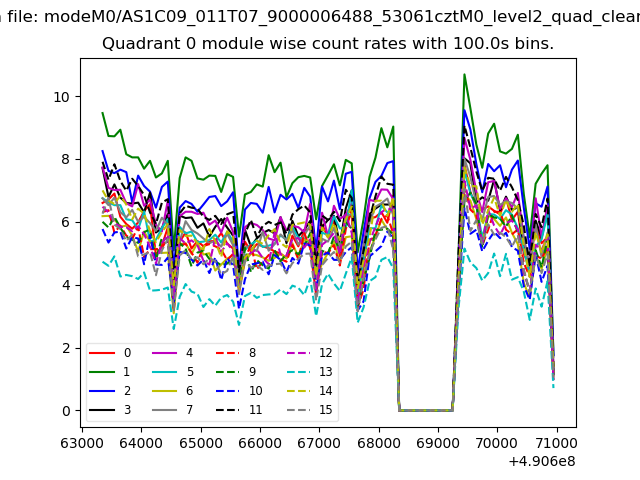 |
 |
| Module-wise count rates for Quadrant B Data is divided into 100 sec bins |
 |
 |
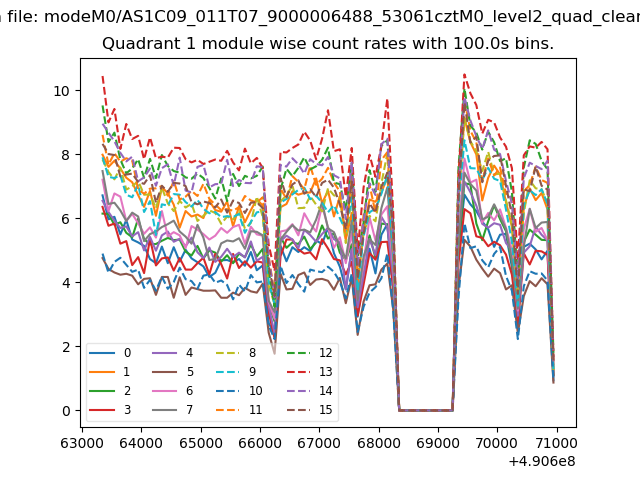
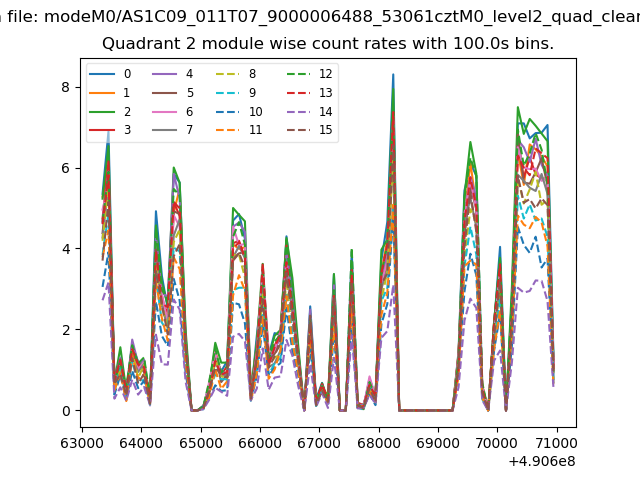
| Module-wise count rates for Quadrant C Data is divided into 100 sec bins |
 |
 |
| Module-wise count rates for Quadrant D Data is divided into 100 sec bins |
 |
 |
| Parameter | Plot |
|---|---|
| CZT HV Monitor | 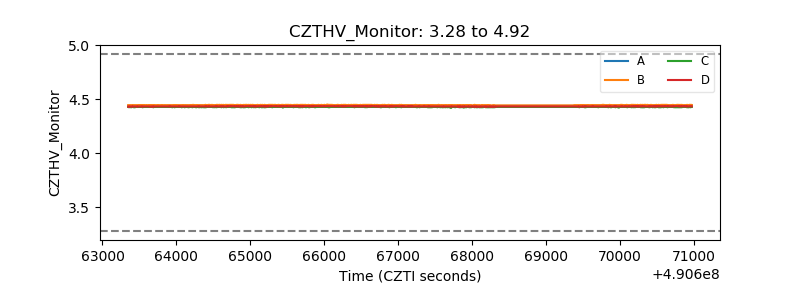 |
| D_VDD | 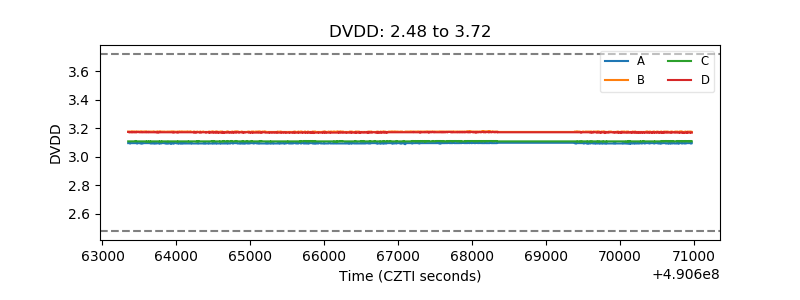 |
| Temperature 1 | 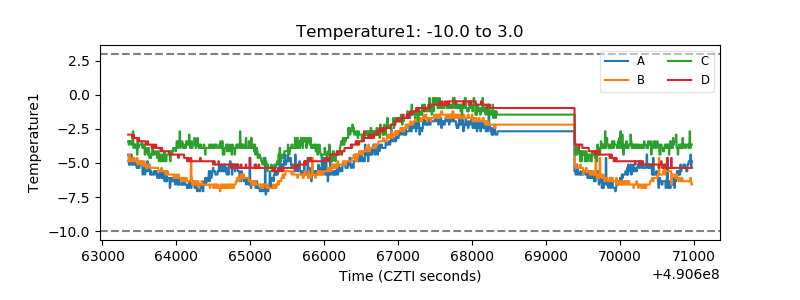 |
| Veto HV Monitor | 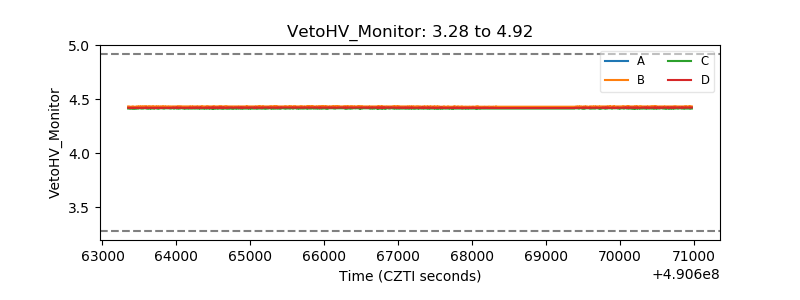 |
| Veto LLD | 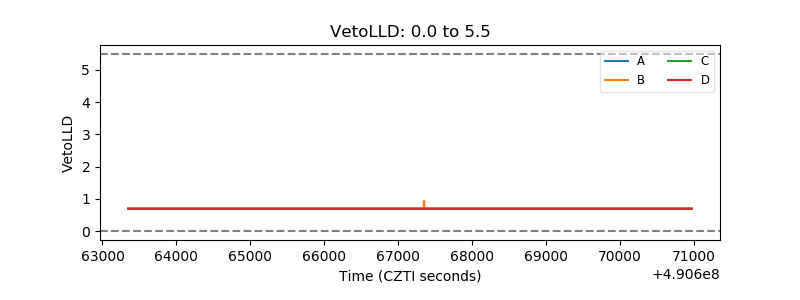 |
| Alpha Counter |  |
| _CPM_Rate | 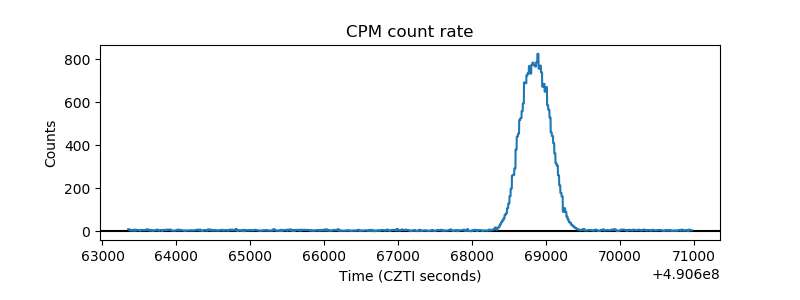 |
| CZT Counter | 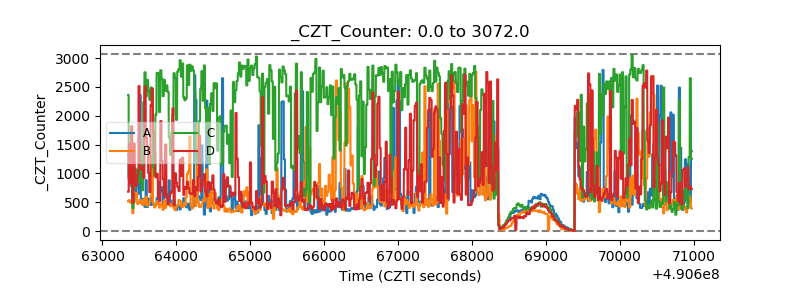 |
| +2.5 Volts monitor |  |
| +5 Volts monitor |  |
| _ROLL_ROT | 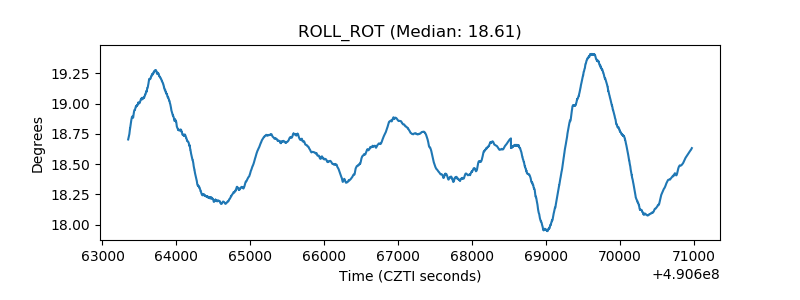 |
| _Roll_DEC | 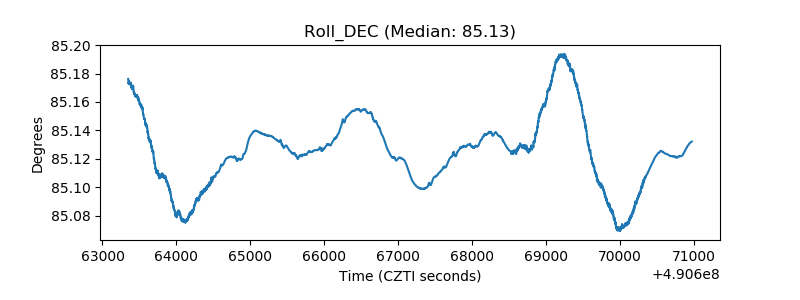 |
| _Roll_RA | 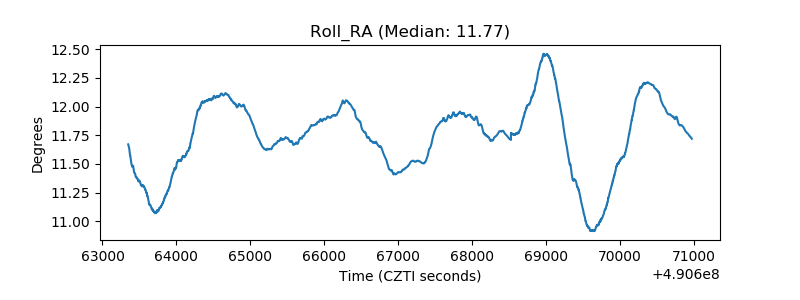 |
| Veto Counter | 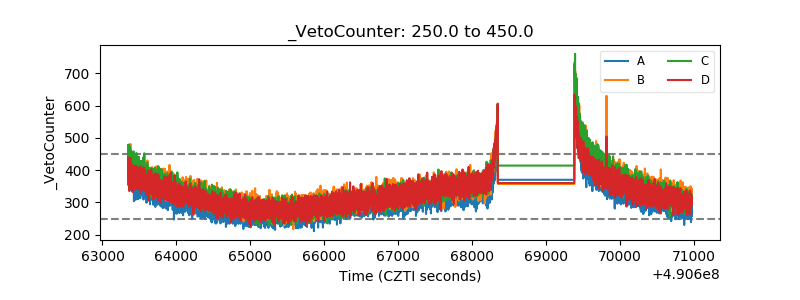 |