| Param | Original file | Final file |
|---|---|---|
| Filename | modeM0/AS1C09_011T07_9000006488_53062cztM0_level2.fits | modeM0/AS1C09_011T07_9000006488_53062cztM0_level2_quad_clean.evt |
| Size (bytes) | 710,081,280 | 91,546,560 |
| Size | 677.2 MB | 87.3 MB |
| Events in quadrant A | 5,411,413 | 622,623 |
| Events in quadrant B | 4,400,254 | 676,334 |
| Events in quadrant C | 8,633,127 | 478,701 |
| Events in quadrant D | 7,325,894 | 530,570 |
| Mode SS | |||
|---|---|---|---|
| Quadrant | BADHDUFLAG | Total packets | Discarded packets |
| A | 0 | 134 | 0 |
| B | 0 | 134 | 0 |
| C | 0 | 134 | 0 |
| D | 0 | 134 | 0 |
| Mode M9 | |||
|---|---|---|---|
| Quadrant | BADHDUFLAG | Total packets | Discarded packets |
| A | 0 | 12 | 0 |
| B | 0 | 12 | 0 |
| C | 0 | 12 | 0 |
| D | 0 | 12 | 0 |
| Mode M0 | |||
|---|---|---|---|
| Quadrant | BADHDUFLAG | Total packets | Discarded packets |
| A | 0 | 20592 | 1 |
| B | 0 | 17773 | 1 |
| C | 0 | 30312 | 1 |
| D | 0 | 26420 | 1 |
| Quadrant | Total seconds | Saturated seconds | Saturation percentage |
|---|---|---|---|
| A | 6649 | 426 | 6.406978% |
| B | 6649 | 247 | 3.714844% |
| C | 6650 | 1755 | 26.390977% |
| D | 6649 | 846 | 12.723718% |
Noise dominated data is calculated using 1-second bins in cleaned event files. If a bin has >2000 counts, and if more than 50% of those come from <1% of pixels, then it is considered to be noise-dominated and hence unusable.
| Quadrant | # 1 sec bins | Bins with >0 counts | Bins with >2000 counts | High rate bins dominated by noise | Noise dominated (total time) | Noise dominated (detector-on time) | Marked lightcurve |
|---|---|---|---|---|---|---|---|
| A | 7794 | 6650 | 388 | 388 | 4.98% | 5.83% | 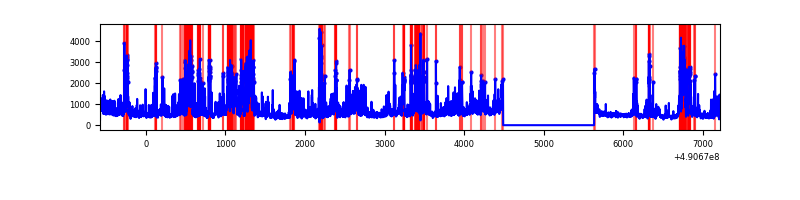 |
| B | 7794 | 6650 | 179 | 179 | 2.30% | 2.69% | 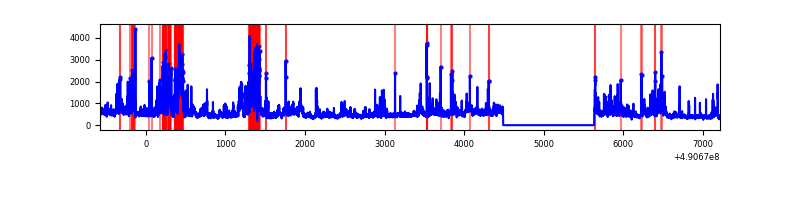 |
| C | 7795 | 6651 | 1629 | 1629 | 20.90% | 24.49% | 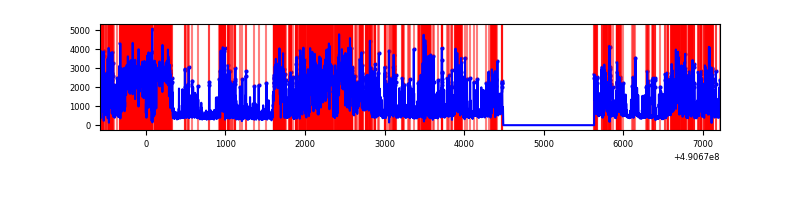 |
| D | 7794 | 6650 | 863 | 863 | 11.07% | 12.98% | 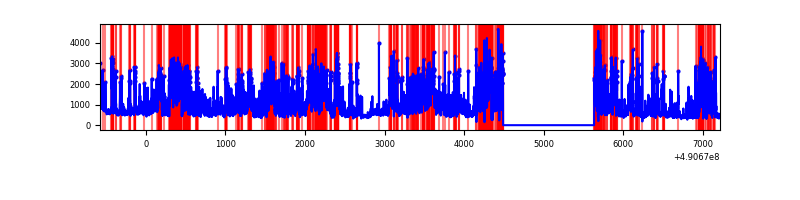 |
Top three noisy pixels from each quadrant. If the there are fewer than three noisy pixels in the level2.evt file, extra rows are filled as -1
| Pixel properties | Quadrant properties | ||||||
|---|---|---|---|---|---|---|---|
| Quadrant | DetID | PixID | Counts | Sigma | Mean | Median | Sigma |
| A | 7 | 206 | 1352147 | 8066.25 | 672 | 657 | 167.5 |
| A | 9 | 191 | 1107422 | 6605.63 | 672 | 657 | 167.5 |
| A | 15 | 190 | 84297 | 499.2 | 672 | 657 | 167.5 |
| B | 1 | 255 | 1034488 | 7188.5 | 677 | 654 | 143.8 |
| B | 4 | 81 | 253089 | 1755.24 | 677 | 654 | 143.8 |
| B | 10 | 254 | 170124 | 1178.36 | 677 | 654 | 143.8 |
| C | 15 | 224 | 2844330 | 17744.02 | 583 | 578 | 160.3 |
| C | 1 | 241 | 2779564 | 17339.9 | 583 | 578 | 160.3 |
| C | 15 | 244 | 201960 | 1256.55 | 583 | 578 | 160.3 |
| D | 11 | 245 | 1665559 | 9133.02 | 629 | 600 | 182.3 |
| D | 12 | 17 | 874014 | 4791.05 | 629 | 600 | 182.3 |
| D | 15 | 78 | 538014 | 2947.95 | 629 | 600 | 182.3 |
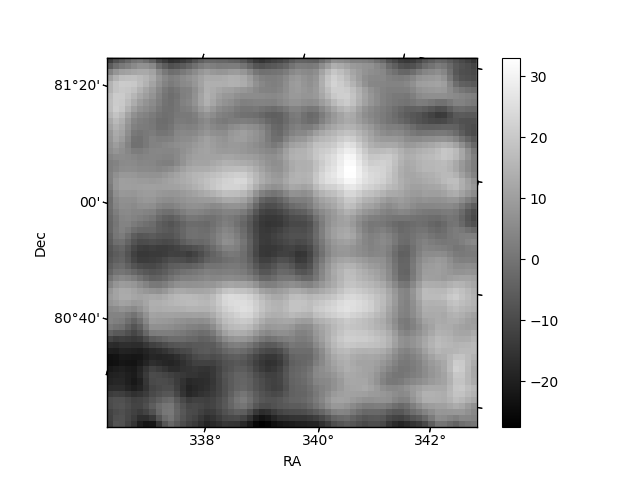
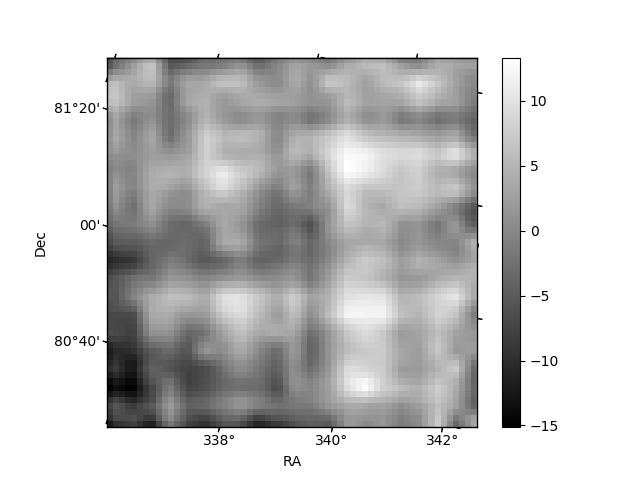
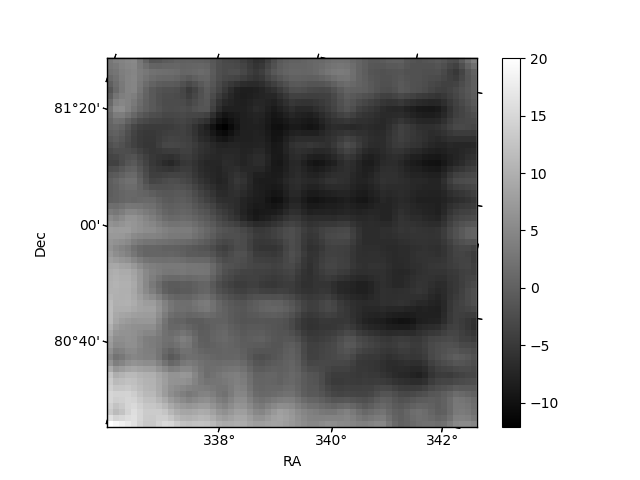
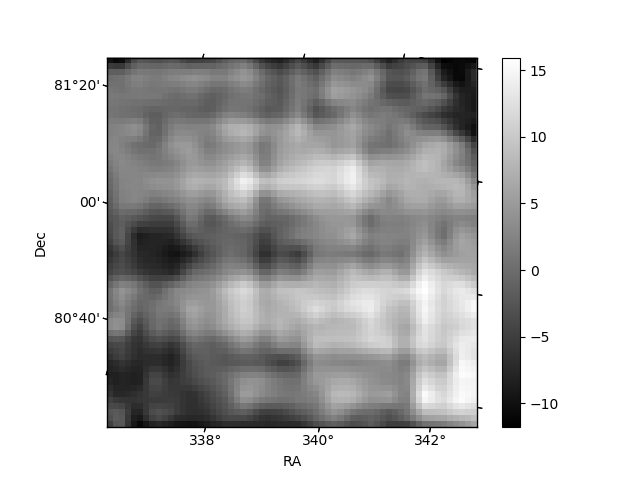
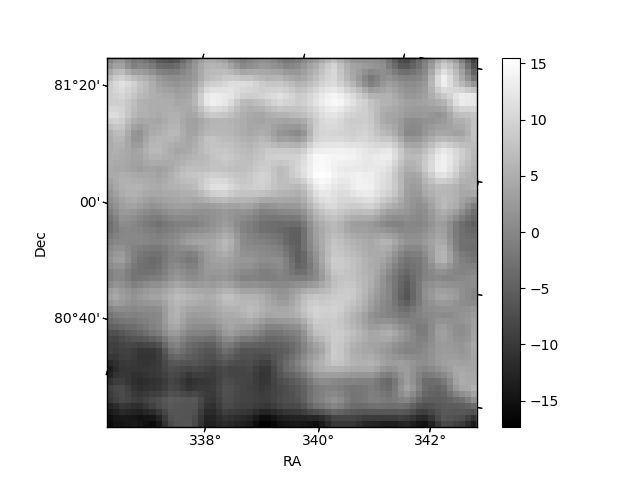
Histogram calculated using DETX and DETY for each event in the final _common_clean file
| Quadrant A | 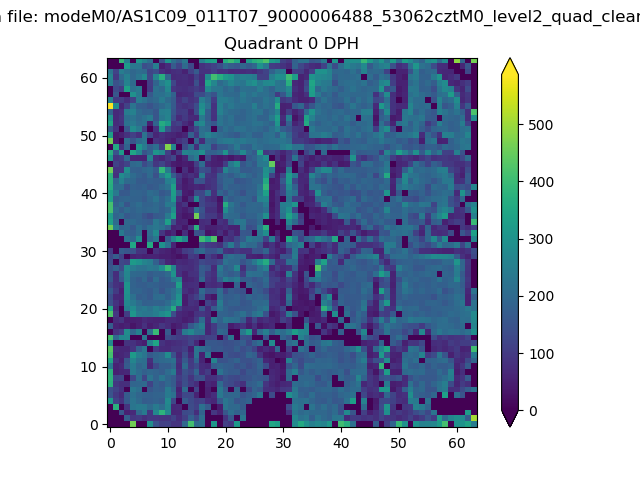 |
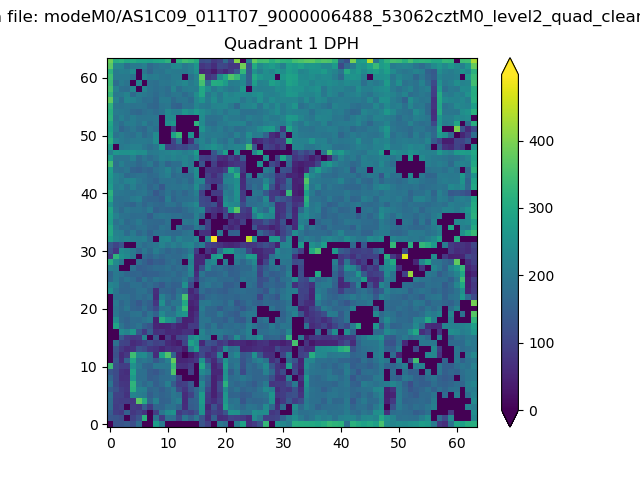 |
Quadrant B |
|---|---|---|---|
| Quadrant D | 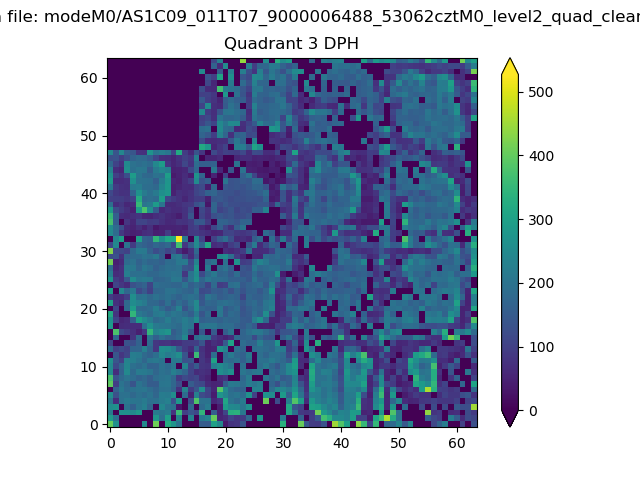 |
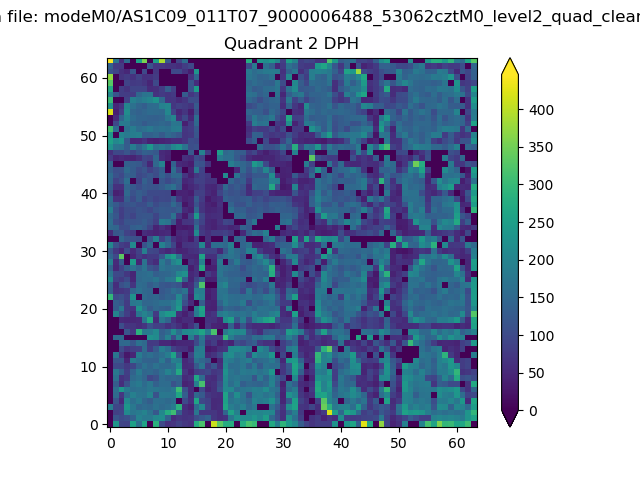 |
Quadrant C |
| Plot type | Count rate plots | Images |
|---|---|---|
| Comparison with Poisson distribution Blue bars denote a histogram of data divided into 1 sec bins. Red curve is a Poisson curve with rate = median count rate of data. |
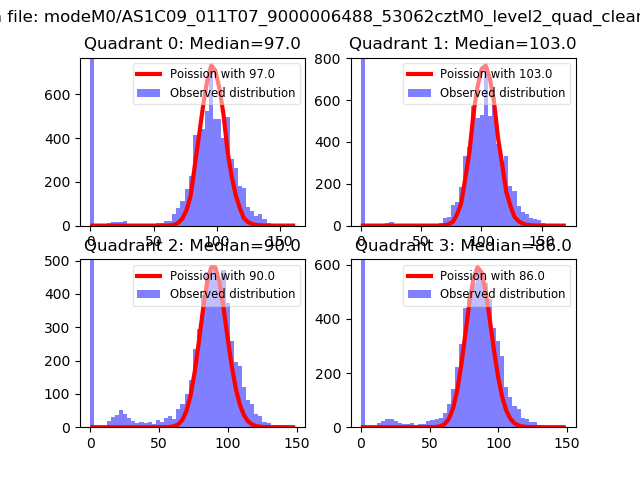 |
 |
| Quadrant-wise count rates Data is divided into 100 sec bins |
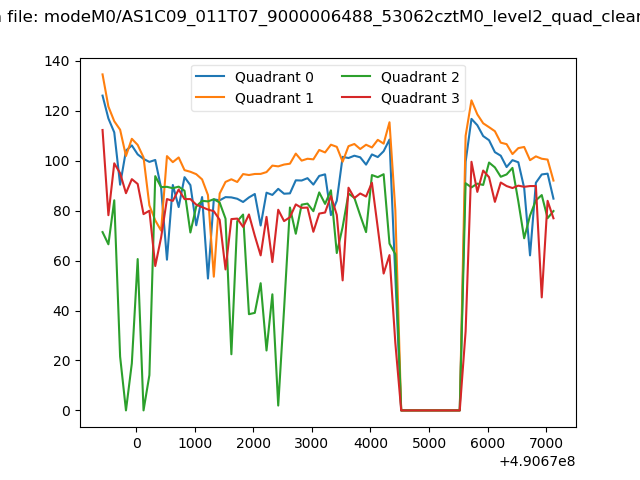 |
|
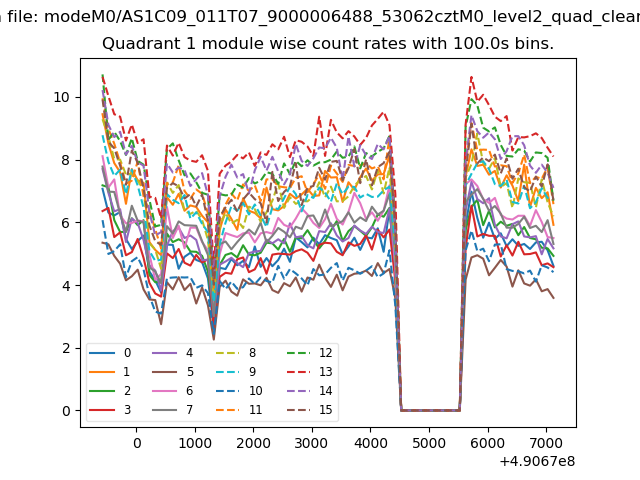
| Module-wise count rates for Quadrant A Data is divided into 100 sec bins |
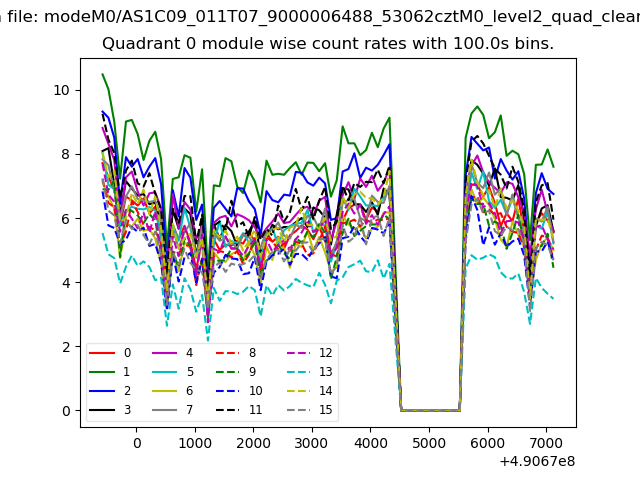 |
 |
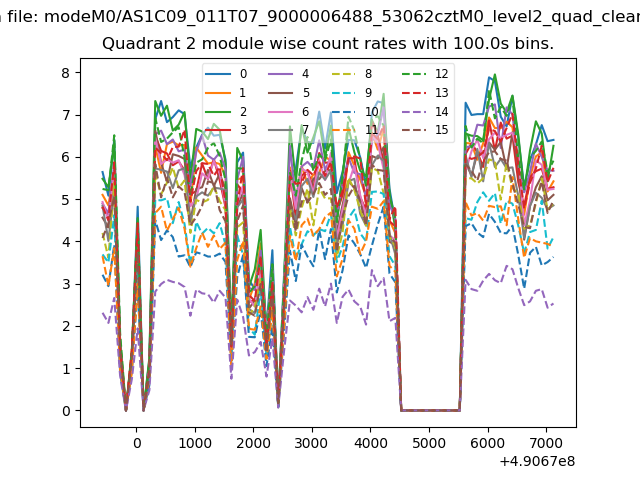
| Module-wise count rates for Quadrant B Data is divided into 100 sec bins |
 |
 |
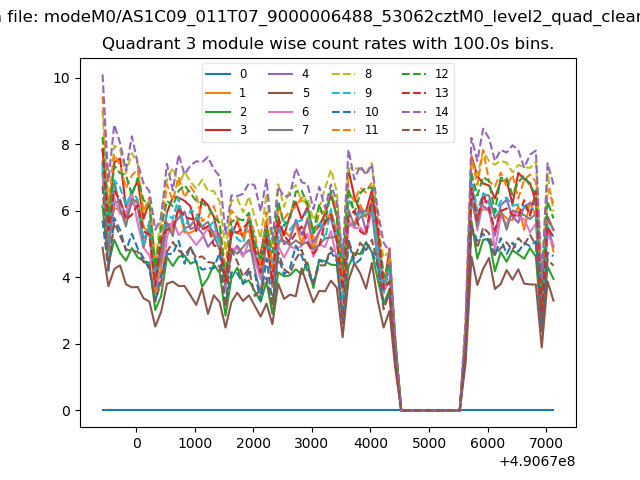
| Module-wise count rates for Quadrant C Data is divided into 100 sec bins |
 |
 |
| Module-wise count rates for Quadrant D Data is divided into 100 sec bins |
 |
 |
| Parameter | Plot |
|---|---|
| CZT HV Monitor | 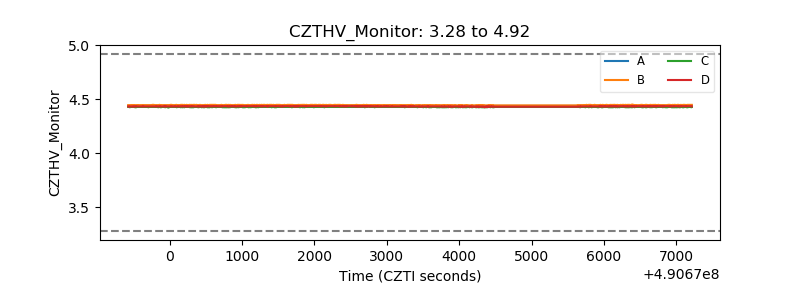 |
| D_VDD | 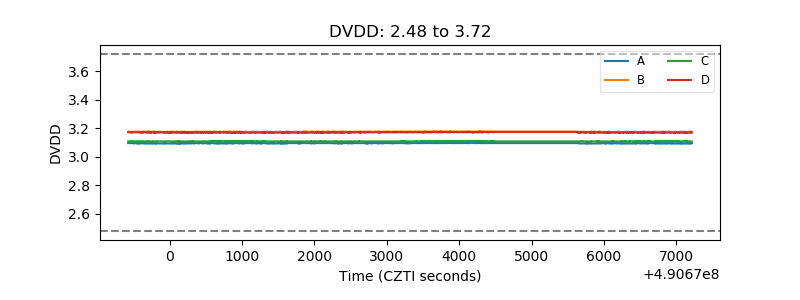 |
| Temperature 1 | 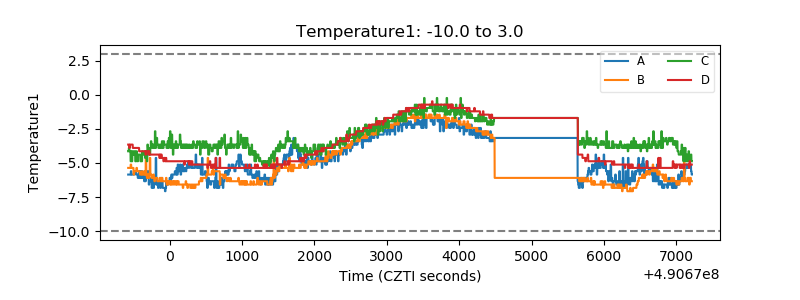 |
| Veto HV Monitor | 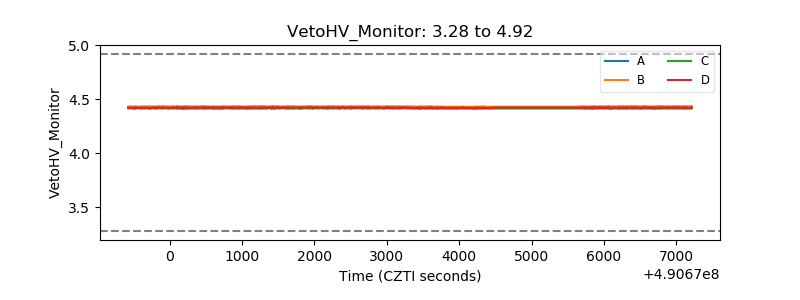 |
| Veto LLD | 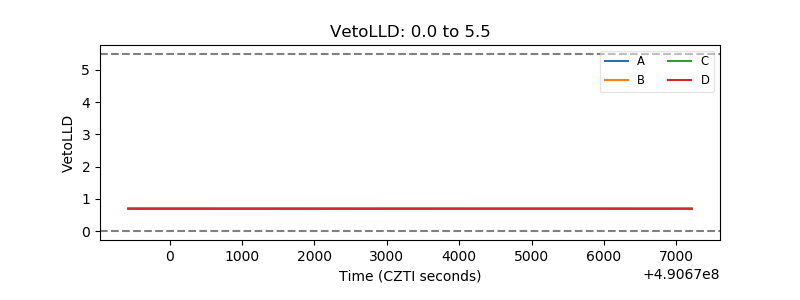 |
| Alpha Counter | 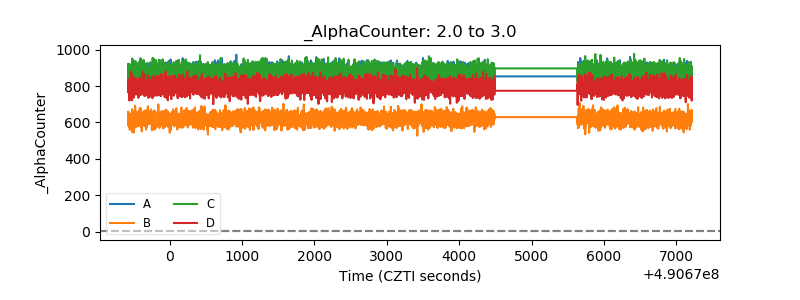 |
| _CPM_Rate | 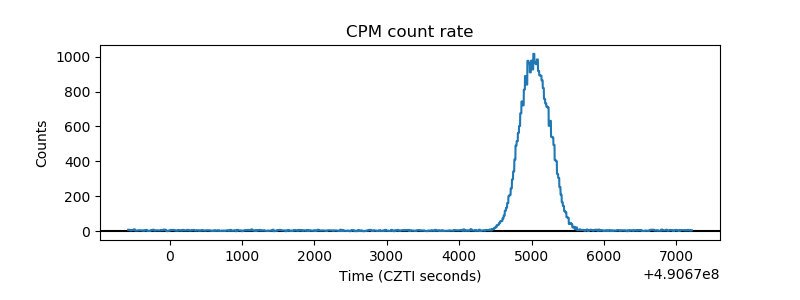 |
| CZT Counter | 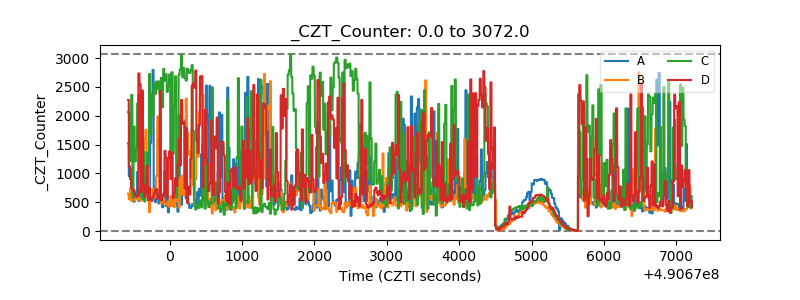 |
| +2.5 Volts monitor |  |
| +5 Volts monitor |  |
| _ROLL_ROT | 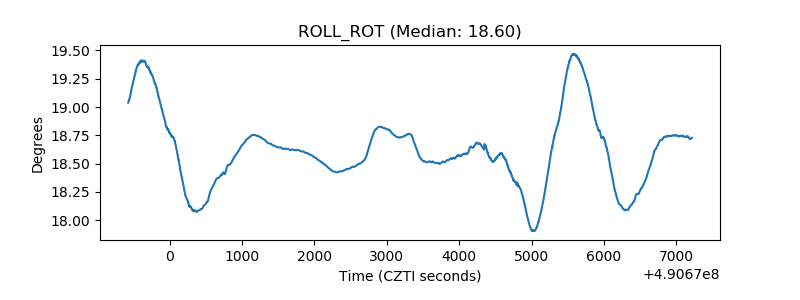 |
| _Roll_DEC | 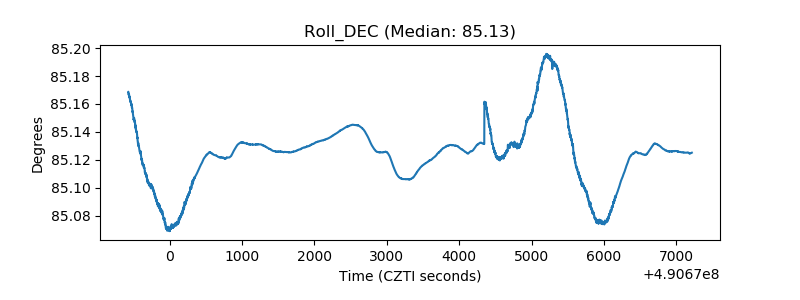 |
| _Roll_RA | 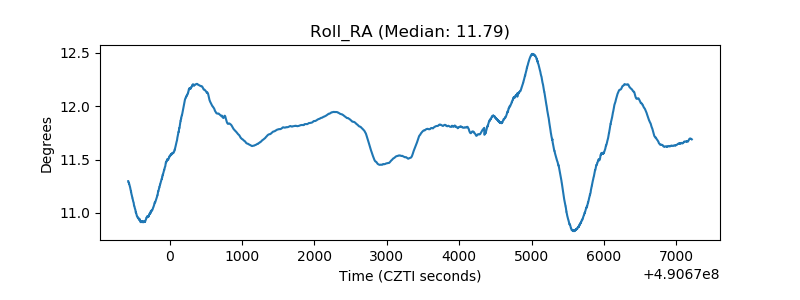 |
| Veto Counter | 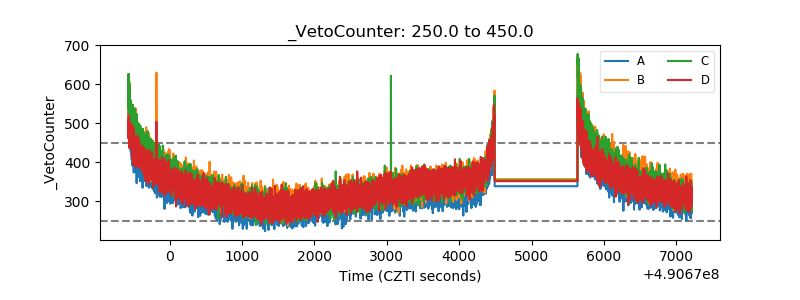 |