| Param | Original file | Final file |
|---|---|---|
| Filename | modeM0/AS1C09_011T07_9000006488_53063cztM0_level2.fits | modeM0/AS1C09_011T07_9000006488_53063cztM0_level2_quad_clean.evt |
| Size (bytes) | 615,110,400 | 88,695,360 |
| Size | 586.6 MB | 84.6 MB |
| Events in quadrant A | 5,858,271 | 570,435 |
| Events in quadrant B | 3,898,248 | 646,808 |
| Events in quadrant C | 7,688,852 | 495,440 |
| Events in quadrant D | 4,837,041 | 533,832 |
| Mode SS | |||
|---|---|---|---|
| Quadrant | BADHDUFLAG | Total packets | Discarded packets |
| A | 0 | 128 | 0 |
| B | 0 | 128 | 0 |
| C | 0 | 128 | 0 |
| D | 0 | 128 | 0 |
| Mode M9 | |||
|---|---|---|---|
| Quadrant | BADHDUFLAG | Total packets | Discarded packets |
| A | 0 | 12 | 0 |
| B | 0 | 12 | 0 |
| C | 0 | 12 | 0 |
| D | 0 | 12 | 0 |
| Mode M0 | |||
|---|---|---|---|
| Quadrant | BADHDUFLAG | Total packets | Discarded packets |
| A | 0 | 21753 | 1 |
| B | 0 | 16191 | 1 |
| C | 0 | 27220 | 1 |
| D | 0 | 18812 | 1 |
| Quadrant | Total seconds | Saturated seconds | Saturation percentage |
|---|---|---|---|
| A | 6286 | 653 | 10.388164% |
| B | 6287 | 222 | 3.531096% |
| C | 6287 | 1275 | 20.279943% |
| D | 6287 | 357 | 5.678384% |
Noise dominated data is calculated using 1-second bins in cleaned event files. If a bin has >2000 counts, and if more than 50% of those come from <1% of pixels, then it is considered to be noise-dominated and hence unusable.
| Quadrant | # 1 sec bins | Bins with >0 counts | Bins with >2000 counts | High rate bins dominated by noise | Noise dominated (total time) | Noise dominated (detector-on time) | Marked lightcurve |
|---|---|---|---|---|---|---|---|
| A | 7466 | 6287 | 506 | 506 | 6.78% | 8.05% | 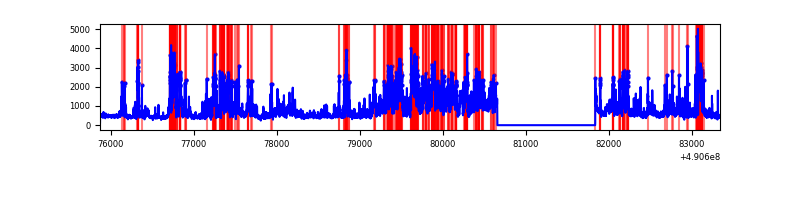 |
| B | 7467 | 6288 | 177 | 177 | 2.37% | 2.81% | 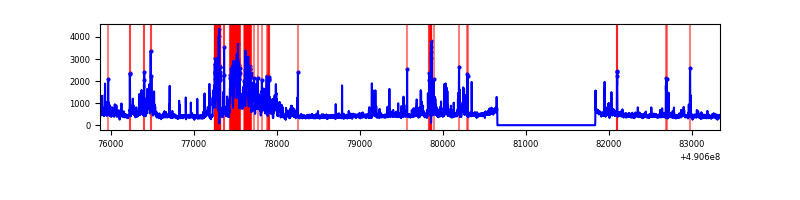 |
| C | 7467 | 6287 | 1150 | 1150 | 15.40% | 18.29% | 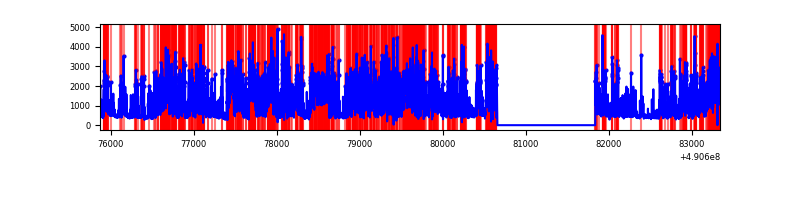 |
| D | 7467 | 6288 | 283 | 283 | 3.79% | 4.50% | 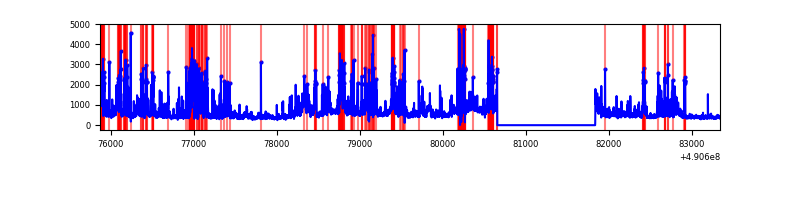 |
Top three noisy pixels from each quadrant. If the there are fewer than three noisy pixels in the level2.evt file, extra rows are filled as -1
| Pixel properties | Quadrant properties | ||||||
|---|---|---|---|---|---|---|---|
| Quadrant | DetID | PixID | Counts | Sigma | Mean | Median | Sigma |
| A | 7 | 206 | 1565787 | 9944.27 | 627 | 613 | 157.4 |
| A | 9 | 191 | 1033191 | 6560.45 | 627 | 613 | 157.4 |
| A | 15 | 190 | 326243 | 2068.88 | 627 | 613 | 157.4 |
| B | 4 | 81 | 852740 | 6192.18 | 641 | 620 | 137.6 |
| B | 1 | 255 | 223955 | 1622.93 | 641 | 620 | 137.6 |
| B | 10 | 247 | 169221 | 1225.19 | 641 | 620 | 137.6 |
| C | 15 | 224 | 3059256 | 19046.61 | 579 | 574 | 160.6 |
| C | 1 | 241 | 673205 | 4188.52 | 579 | 574 | 160.6 |
| C | 0 | 240 | 482454 | 3000.7 | 579 | 574 | 160.6 |
| D | 12 | 17 | 805157 | 4633.44 | 609 | 583 | 173.6 |
| D | 15 | 78 | 376186 | 2163.05 | 609 | 583 | 173.6 |
| D | 2 | 249 | 234251 | 1345.67 | 609 | 583 | 173.6 |
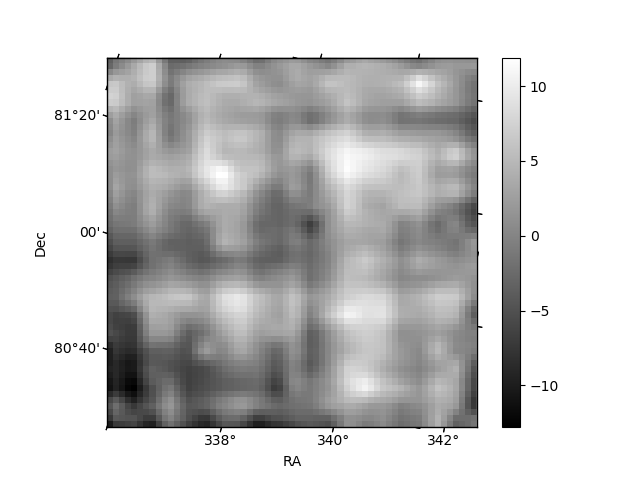
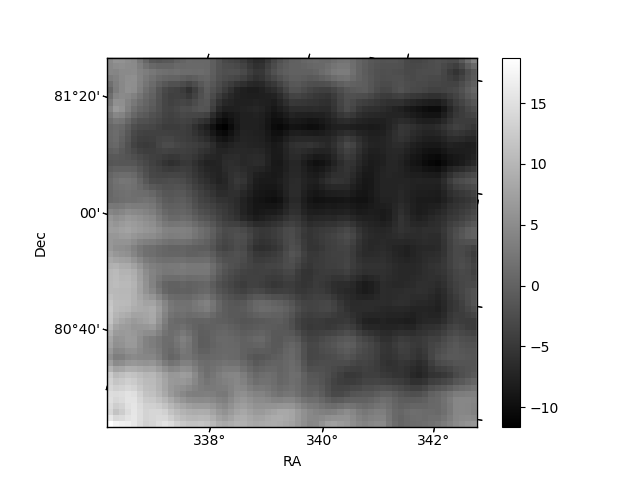
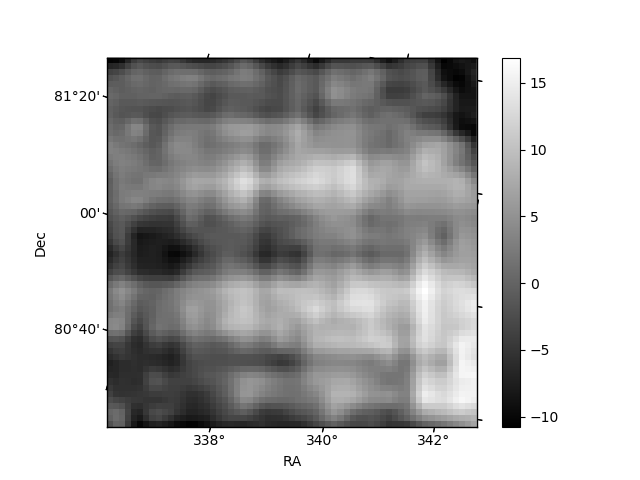
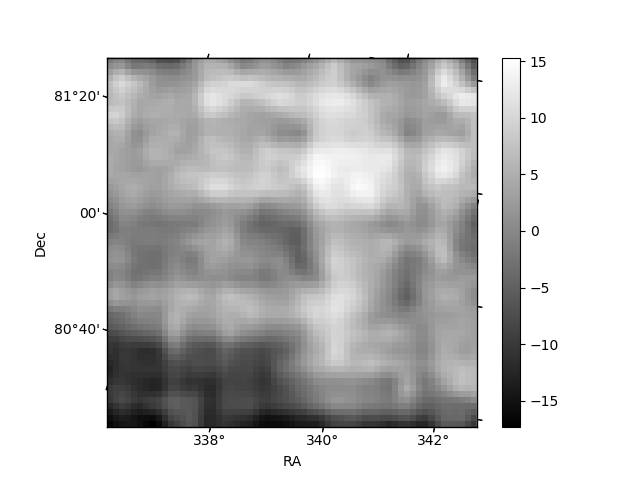
Histogram calculated using DETX and DETY for each event in the final _common_clean file
| Quadrant A | 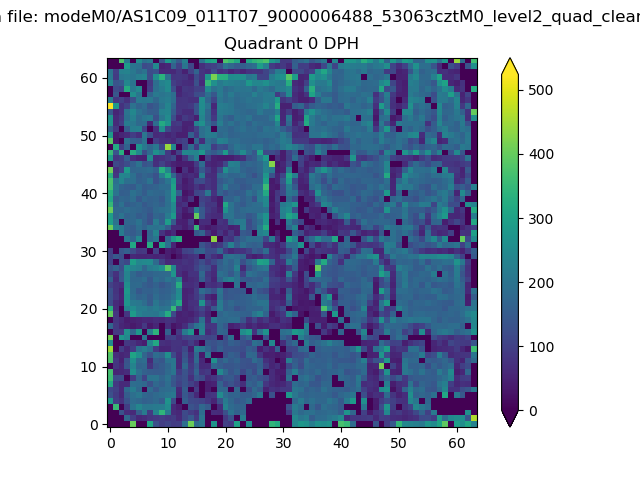 |
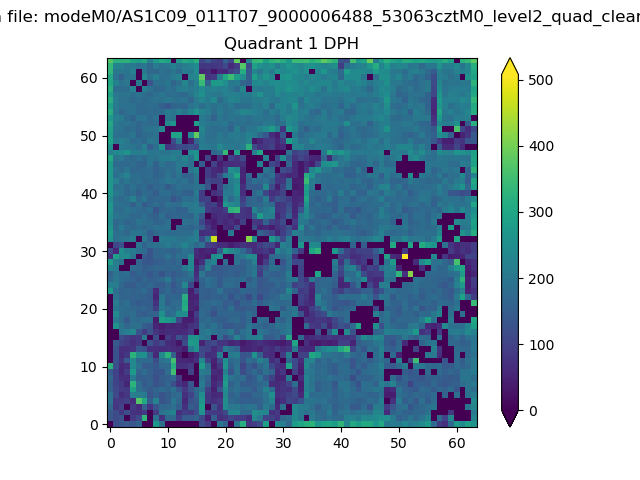 |
Quadrant B |
|---|---|---|---|
| Quadrant D | 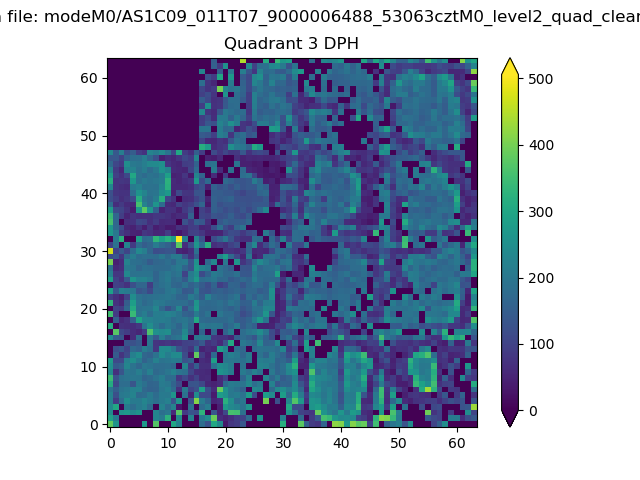 |
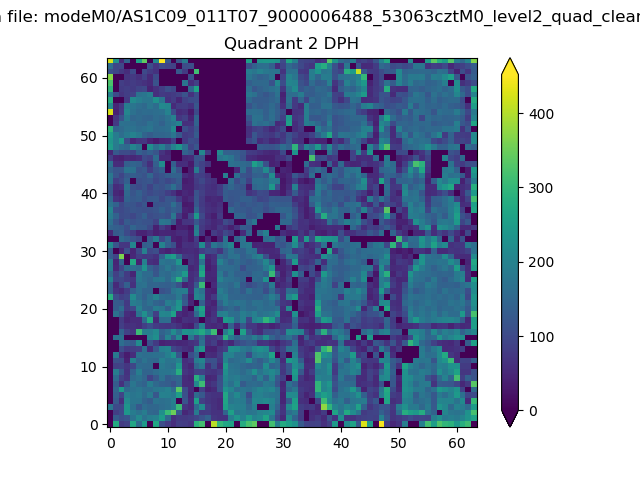 |
Quadrant C |
| Plot type | Count rate plots | Images |
|---|---|---|
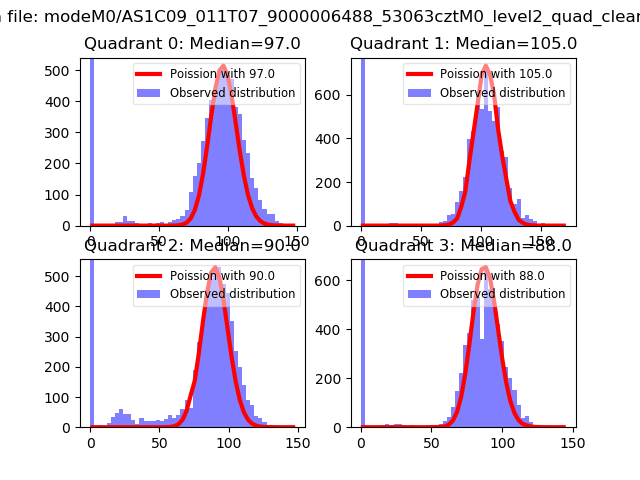
| Comparison with Poisson distribution Blue bars denote a histogram of data divided into 1 sec bins. Red curve is a Poisson curve with rate = median count rate of data. |
 |
 |
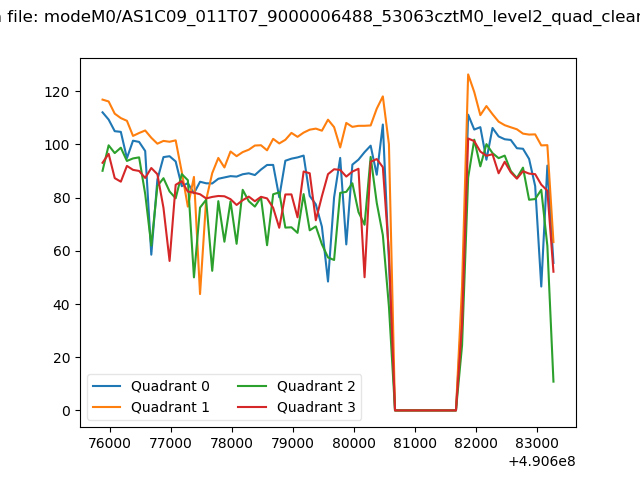
| Quadrant-wise count rates Data is divided into 100 sec bins |
 |
|
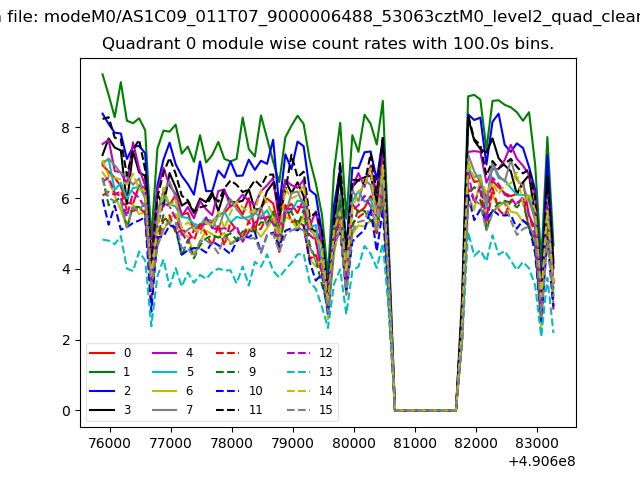
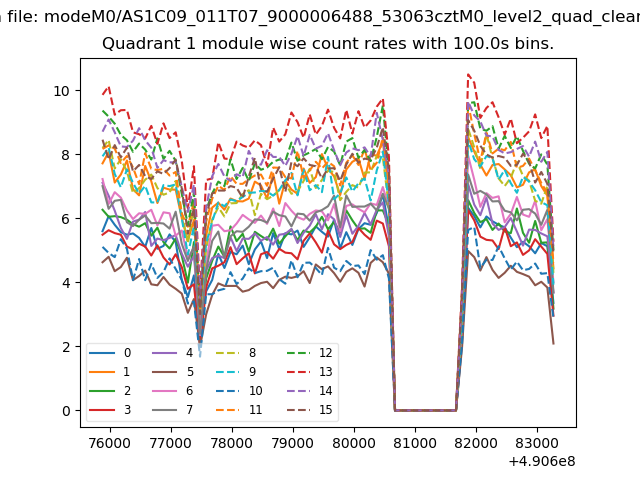
| Module-wise count rates for Quadrant A Data is divided into 100 sec bins |
 |
 |
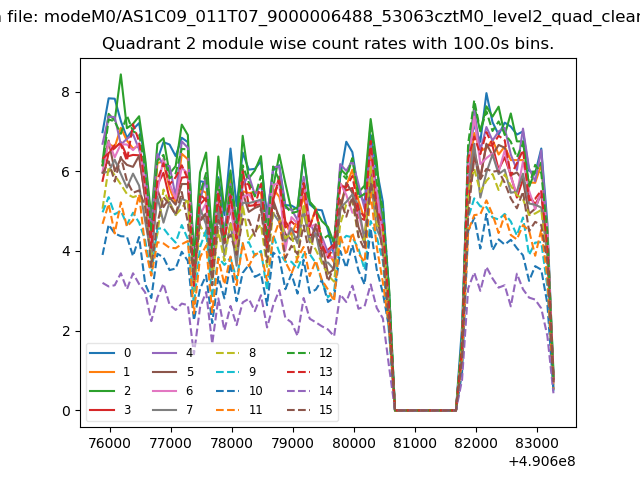
| Module-wise count rates for Quadrant B Data is divided into 100 sec bins |
 |
 |
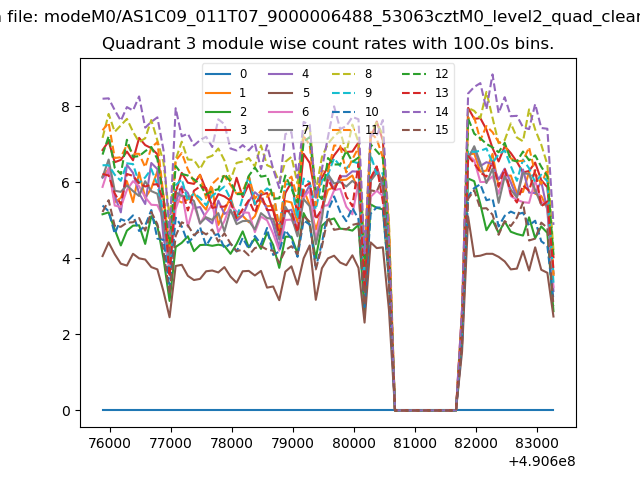
| Module-wise count rates for Quadrant C Data is divided into 100 sec bins |
 |
 |
| Module-wise count rates for Quadrant D Data is divided into 100 sec bins |
 |
 |
| Parameter | Plot |
|---|---|
| CZT HV Monitor |  |
| D_VDD | 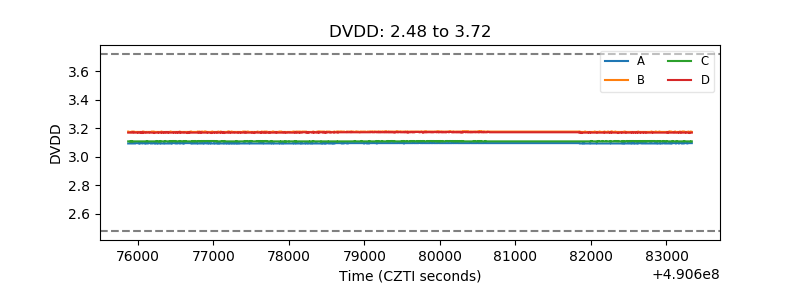 |
| Temperature 1 | 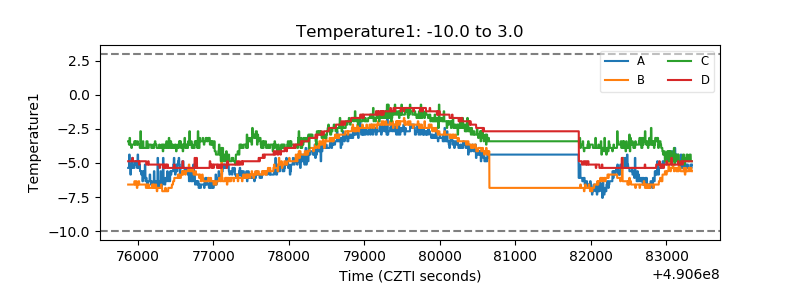 |
| Veto HV Monitor | 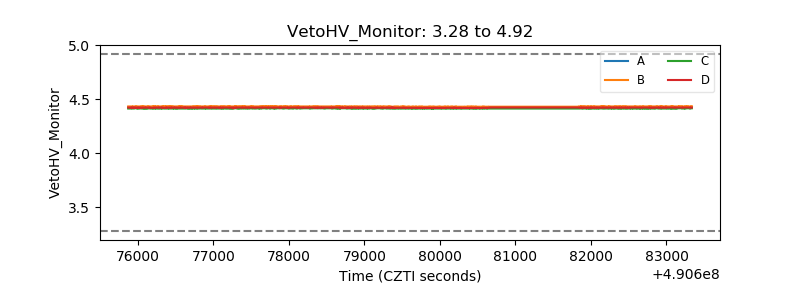 |
| Veto LLD | 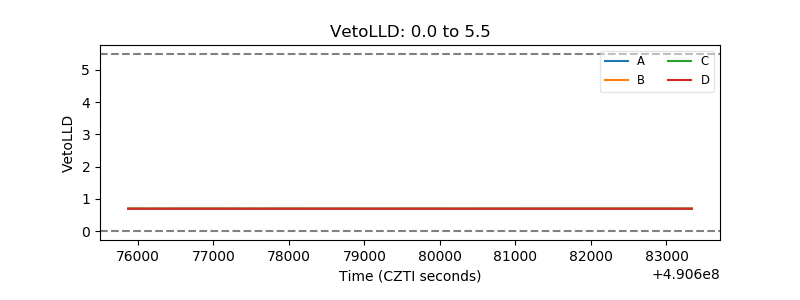 |
| Alpha Counter | 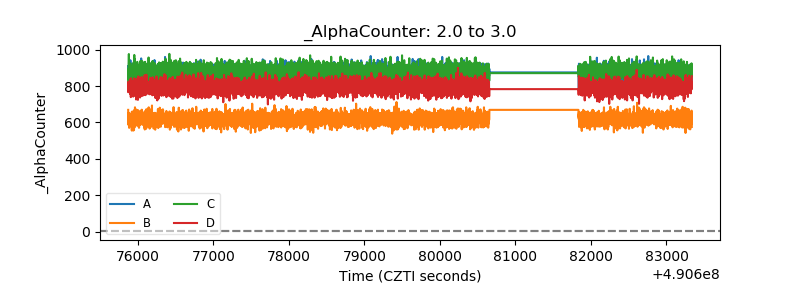 |
| _CPM_Rate | 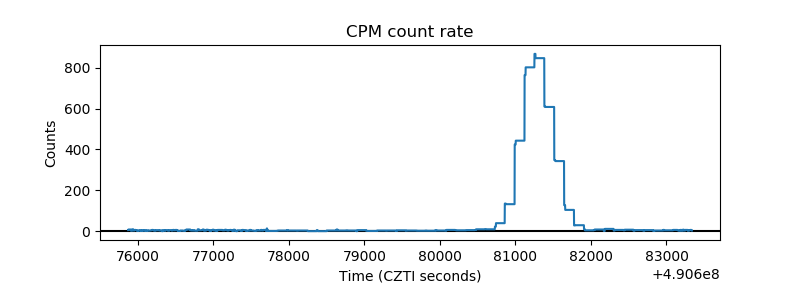 |
| CZT Counter | 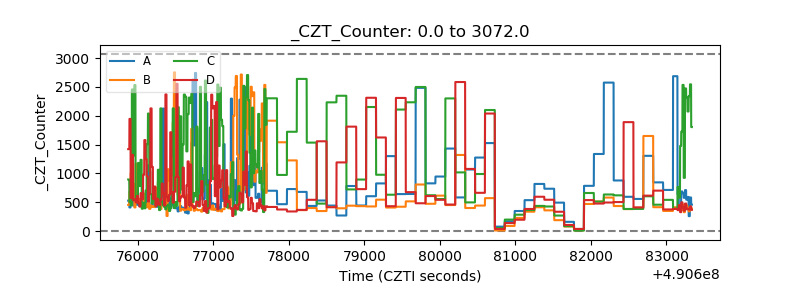 |
| +2.5 Volts monitor |  |
| +5 Volts monitor |  |
| _ROLL_ROT |  |
| _Roll_DEC | 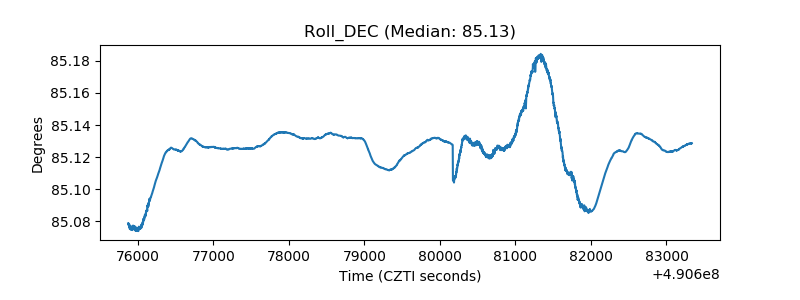 |
| _Roll_RA | 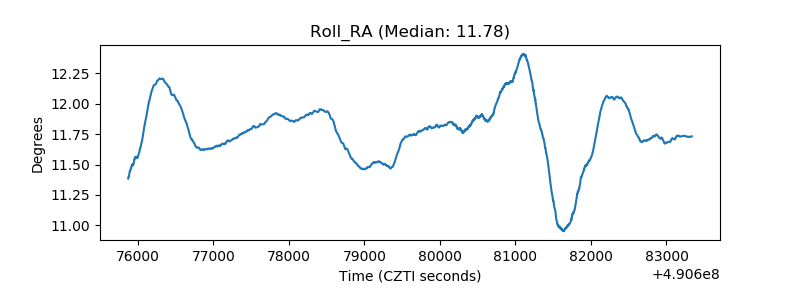 |
| Veto Counter | 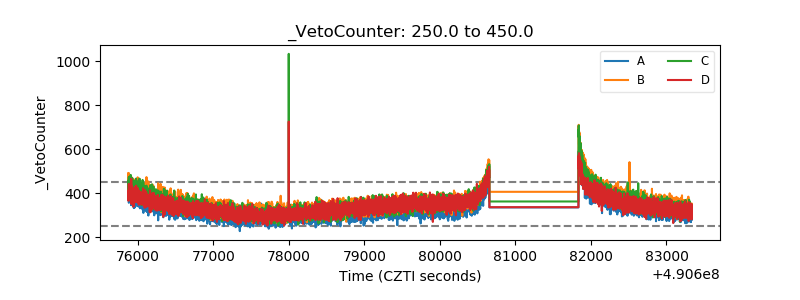 |