| Param | Original file | Final file |
|---|---|---|
| Filename | modeM0/AS1C09_011T07_9000006488_53064cztM0_level2.fits | modeM0/AS1C09_011T07_9000006488_53064cztM0_level2_quad_clean.evt |
| Size (bytes) | 573,503,040 | 79,911,360 |
| Size | 546.9 MB | 76.2 MB |
| Events in quadrant A | 5,249,303 | 536,744 |
| Events in quadrant B | 2,750,987 | 610,506 |
| Events in quadrant C | 6,894,640 | 456,272 |
| Events in quadrant D | 5,878,165 | 404,470 |
| Mode SS | |||
|---|---|---|---|
| Quadrant | BADHDUFLAG | Total packets | Discarded packets |
| A | 0 | 122 | 0 |
| B | 0 | 122 | 0 |
| C | 0 | 122 | 0 |
| D | 0 | 122 | 0 |
| Mode M9 | |||
|---|---|---|---|
| Quadrant | BADHDUFLAG | Total packets | Discarded packets |
| A | 0 | 11 | 0 |
| B | 0 | 11 | 0 |
| C | 0 | 11 | 0 |
| D | 0 | 11 | 0 |
| Mode M0 | |||
|---|---|---|---|
| Quadrant | BADHDUFLAG | Total packets | Discarded packets |
| A | 0 | 19717 | 65 |
| B | 0 | 12631 | 38 |
| C | 0 | 24777 | 162 |
| D | 0 | 21946 | 55 |
| Quadrant | Total seconds | Saturated seconds | Saturation percentage |
|---|---|---|---|
| A | 5882 | 487 | 8.279497% |
| B | 5878 | 76 | 1.292957% |
| C | 5872 | 1168 | 19.891008% |
| D | 5878 | 1264 | 21.503913% |
Noise dominated data is calculated using 1-second bins in cleaned event files. If a bin has >2000 counts, and if more than 50% of those come from <1% of pixels, then it is considered to be noise-dominated and hence unusable.
| Quadrant | # 1 sec bins | Bins with >0 counts | Bins with >2000 counts | High rate bins dominated by noise | Noise dominated (total time) | Noise dominated (detector-on time) | Marked lightcurve |
|---|---|---|---|---|---|---|---|
| A | 7031 | 5903 | 324 | 324 | 4.61% | 5.49% | 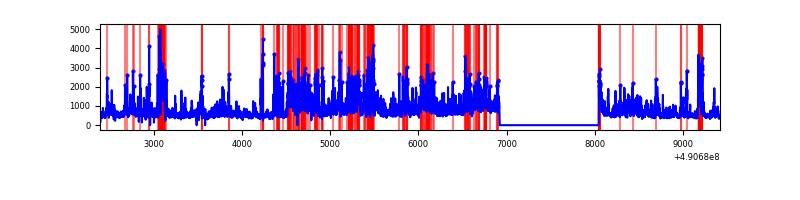 |
| B | 7032 | 5899 | 10 | 10 | 0.14% | 0.17% | 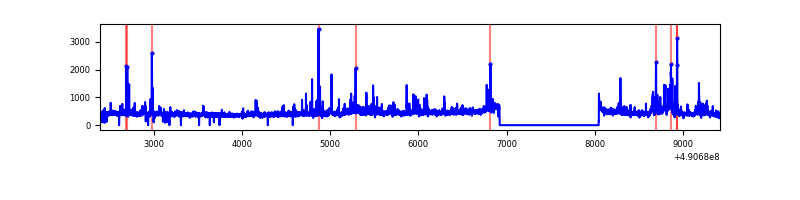 |
| C | 7032 | 5903 | 966 | 966 | 13.74% | 16.36% | 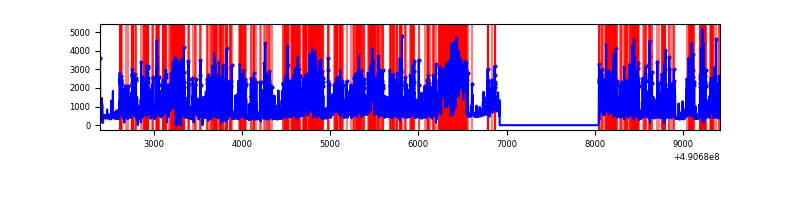 |
| D | 7032 | 5897 | 1113 | 1113 | 15.83% | 18.87% | 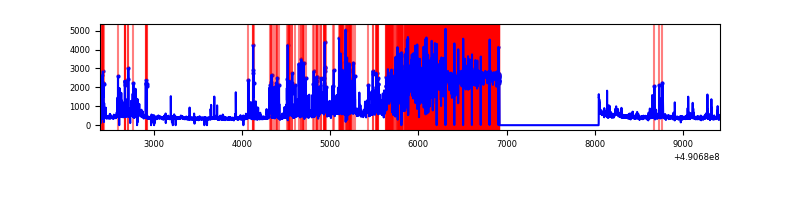 |
Top three noisy pixels from each quadrant. If the there are fewer than three noisy pixels in the level2.evt file, extra rows are filled as -1
| Pixel properties | Quadrant properties | ||||||
|---|---|---|---|---|---|---|---|
| Quadrant | DetID | PixID | Counts | Sigma | Mean | Median | Sigma |
| A | 9 | 191 | 1609372 | 10796.91 | 594 | 578 | 149.0 |
| A | 7 | 206 | 679205 | 4554.39 | 594 | 578 | 149.0 |
| A | 0 | 8 | 134712 | 900.2 | 594 | 578 | 149.0 |
| B | 4 | 81 | 145230 | 1121.59 | 605 | 583 | 129.0 |
| B | 1 | 255 | 71998 | 553.75 | 605 | 583 | 129.0 |
| B | 10 | 254 | 32088 | 244.29 | 605 | 583 | 129.0 |
| C | 15 | 224 | 2844816 | 18821.65 | 539 | 533 | 151.1 |
| C | 1 | 241 | 922473 | 6100.81 | 539 | 533 | 151.1 |
| C | 13 | 3 | 230418 | 1521.23 | 539 | 533 | 151.1 |
| D | 8 | 176 | 2351076 | 16736.8 | 483 | 460 | 140.4 |
| D | 2 | 62 | 601502 | 4279.53 | 483 | 460 | 140.4 |
| D | 12 | 17 | 491058 | 3493.14 | 483 | 460 | 140.4 |
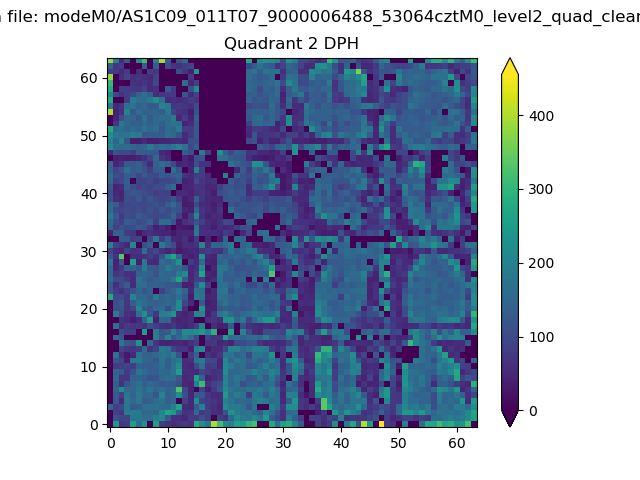
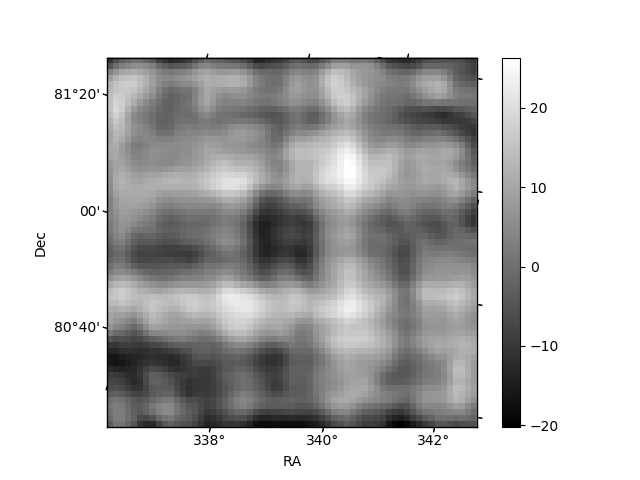
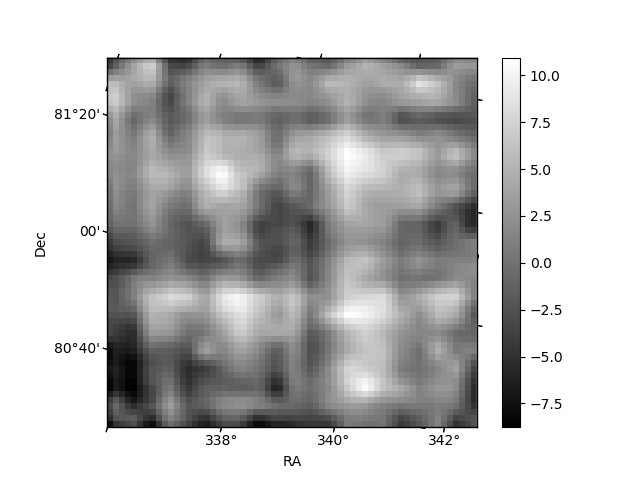
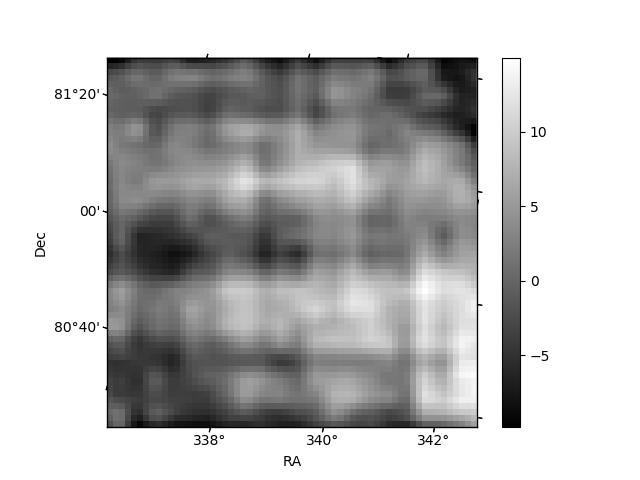
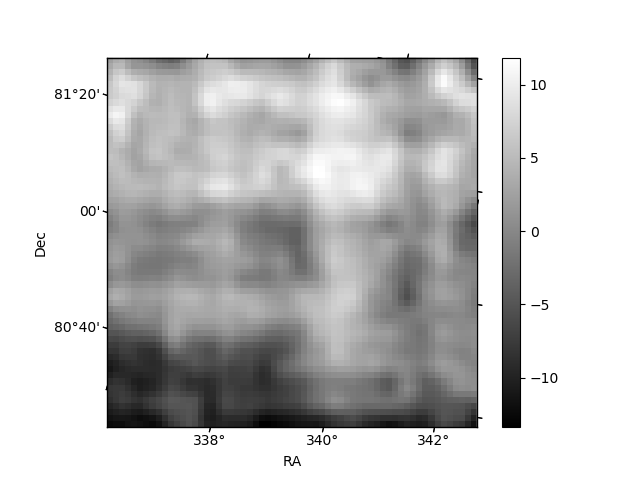
Histogram calculated using DETX and DETY for each event in the final _common_clean file
| Quadrant A | 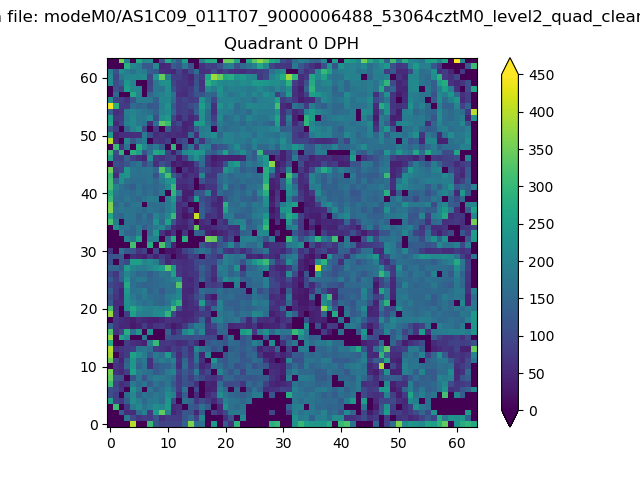 |
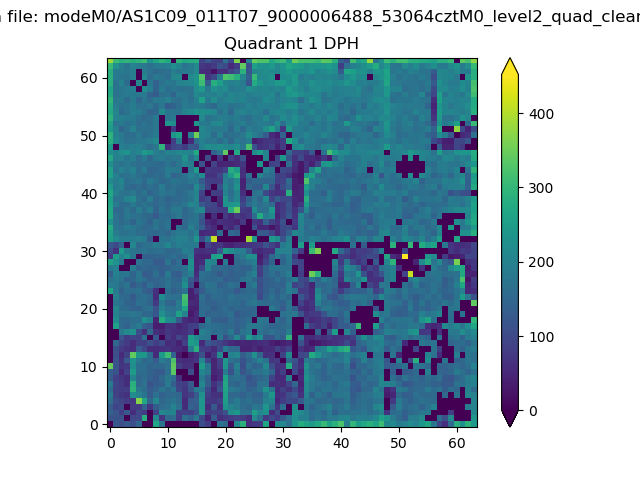 |
Quadrant B |
|---|---|---|---|
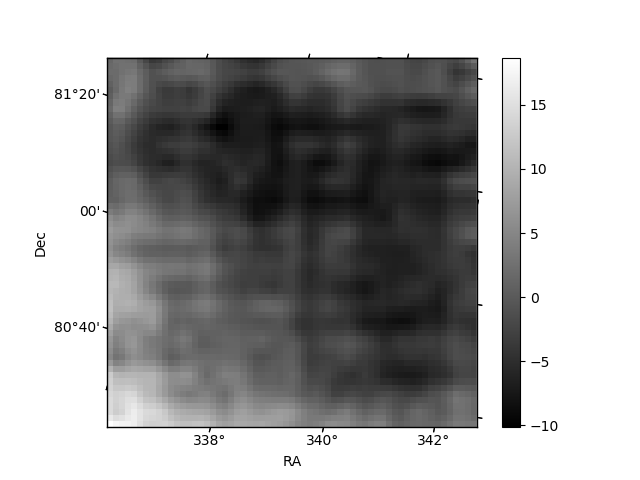
| Quadrant D | 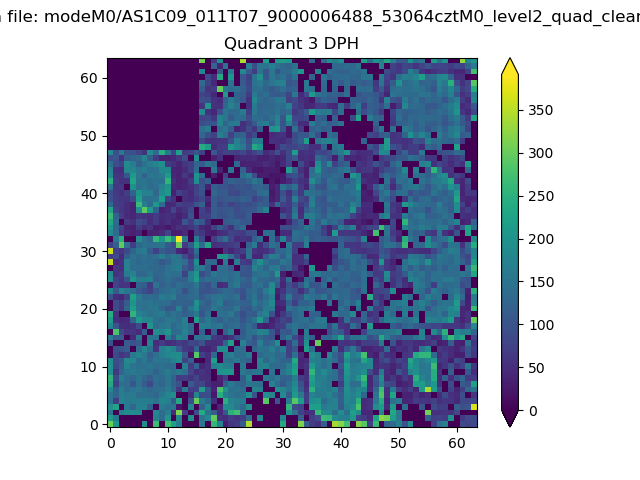 |
 |
Quadrant C |
| Plot type | Count rate plots | Images |
|---|---|---|
| Comparison with Poisson distribution Blue bars denote a histogram of data divided into 1 sec bins. Red curve is a Poisson curve with rate = median count rate of data. |
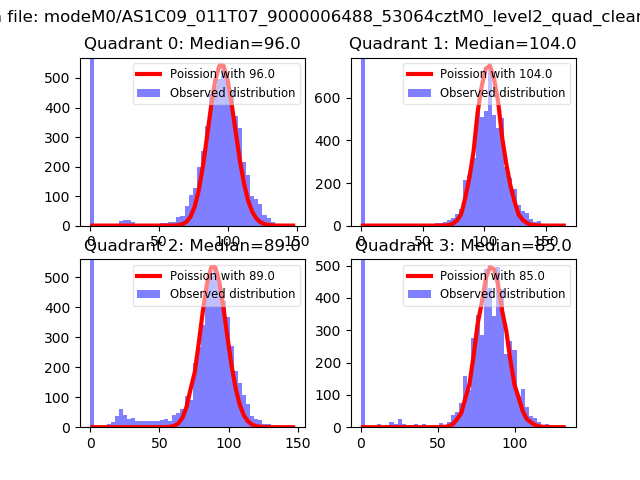 |
 |
| Quadrant-wise count rates Data is divided into 100 sec bins |
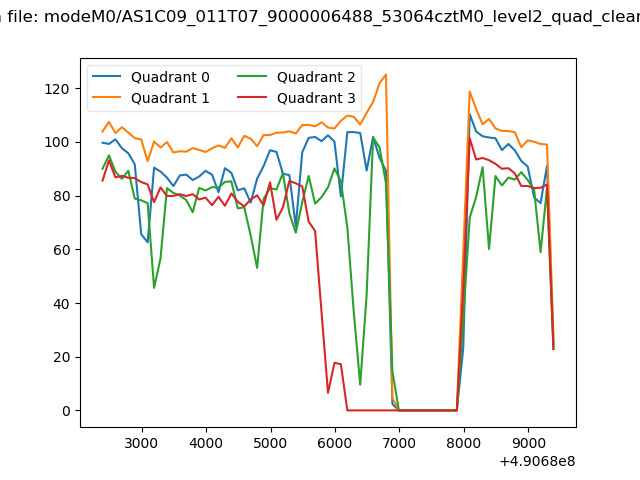 |
|
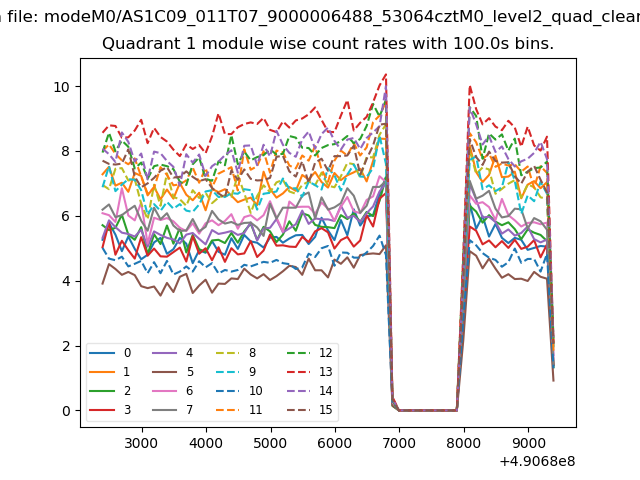
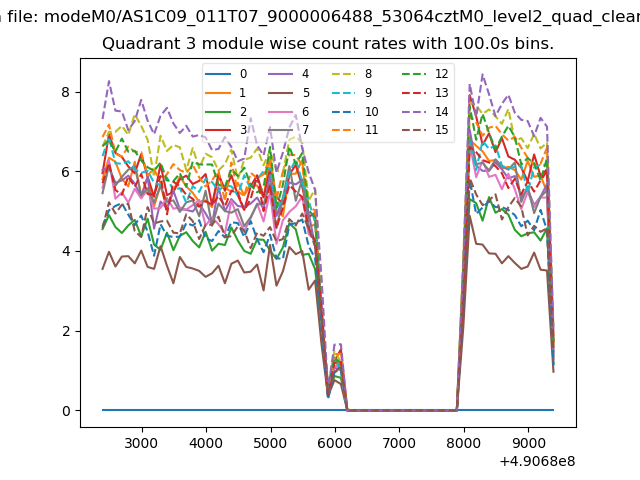
| Module-wise count rates for Quadrant A Data is divided into 100 sec bins |
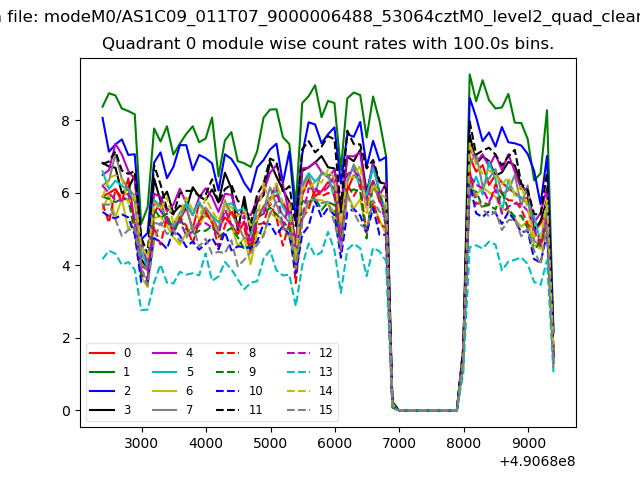 |
 |
| Module-wise count rates for Quadrant B Data is divided into 100 sec bins |
 |
 |
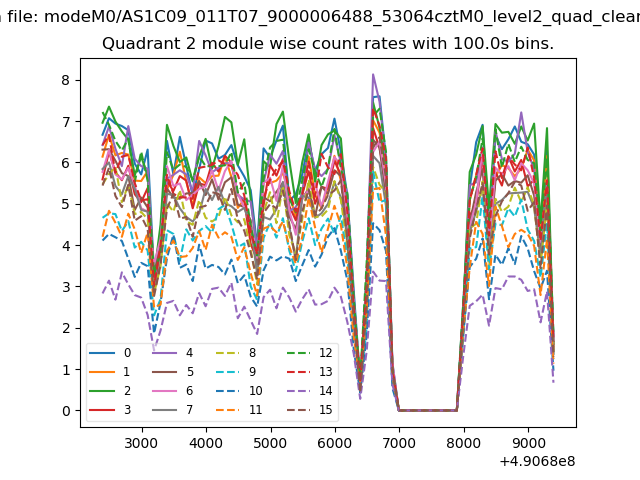
| Module-wise count rates for Quadrant C Data is divided into 100 sec bins |
 |
 |
| Module-wise count rates for Quadrant D Data is divided into 100 sec bins |
 |
 |
| Parameter | Plot |
|---|---|
| CZT HV Monitor | 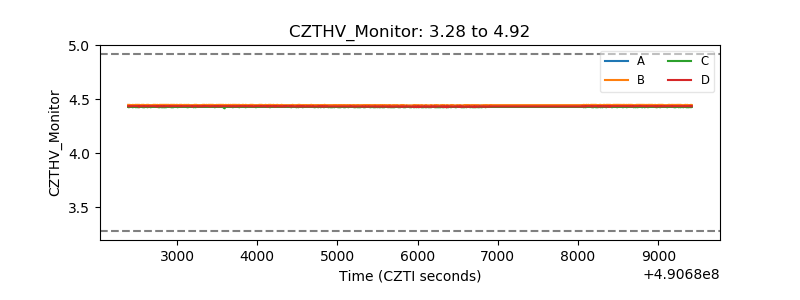 |
| D_VDD | 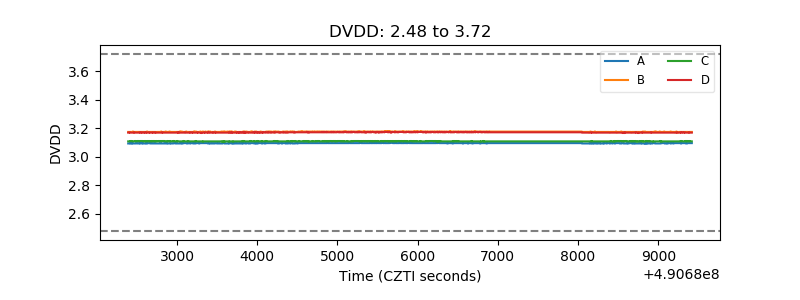 |
| Temperature 1 | 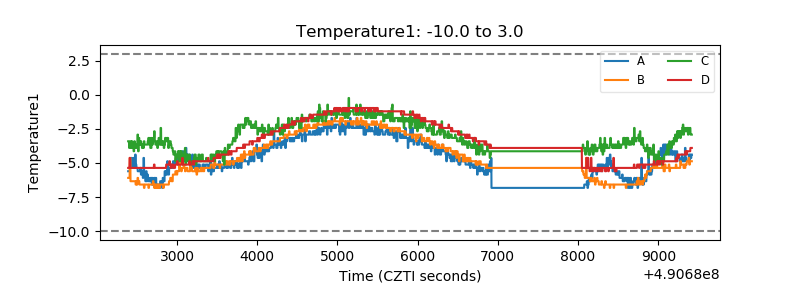 |
| Veto HV Monitor | 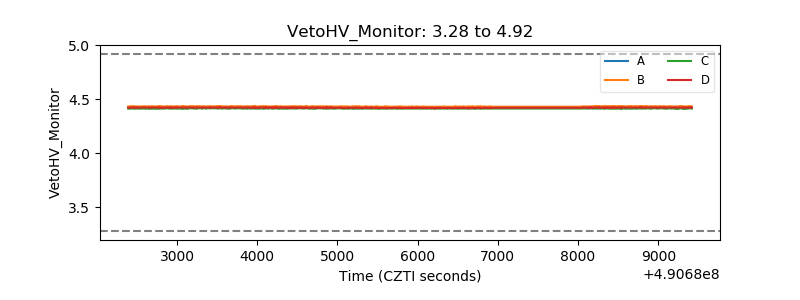 |
| Veto LLD | 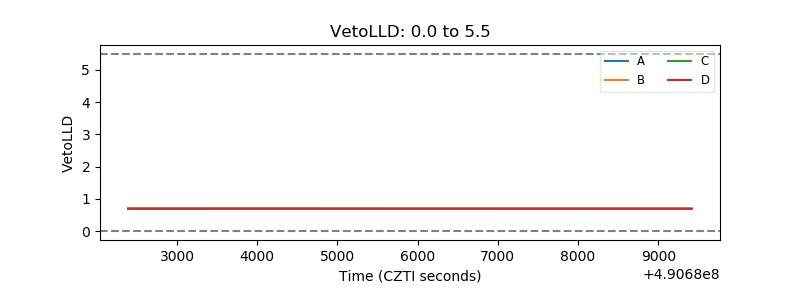 |
| Alpha Counter | 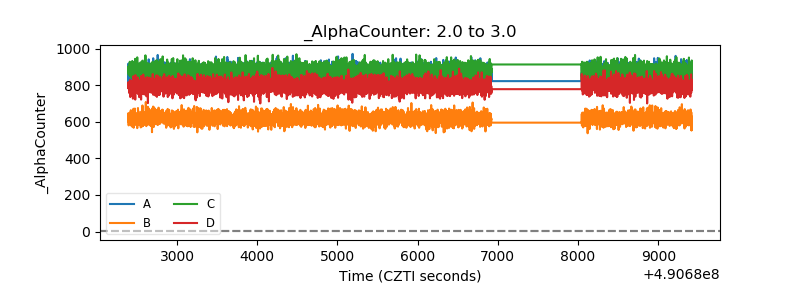 |
| _CPM_Rate | 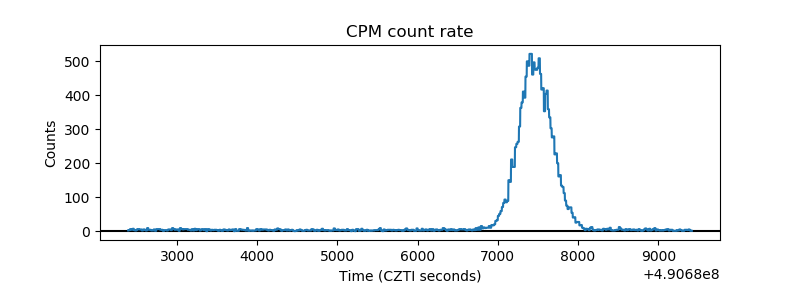 |
| CZT Counter | 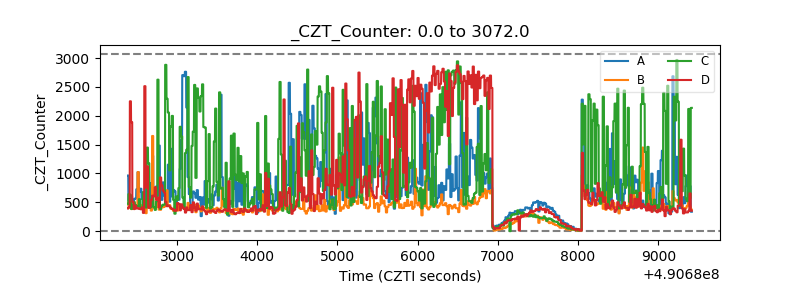 |
| +2.5 Volts monitor |  |
| +5 Volts monitor | 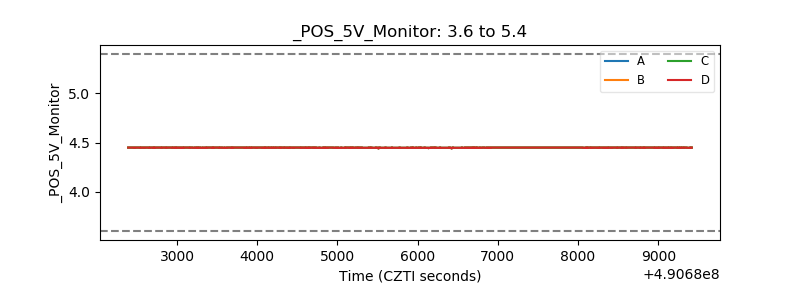 |
| _ROLL_ROT | 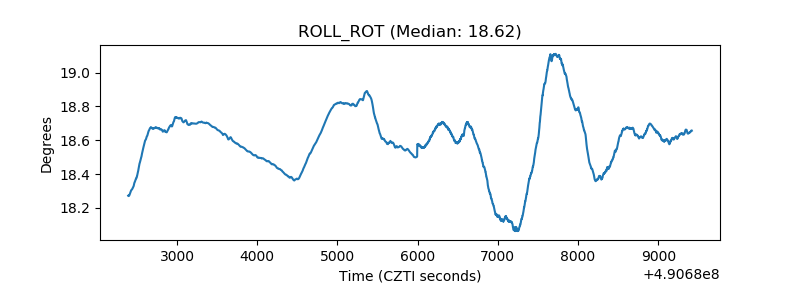 |
| _Roll_DEC | 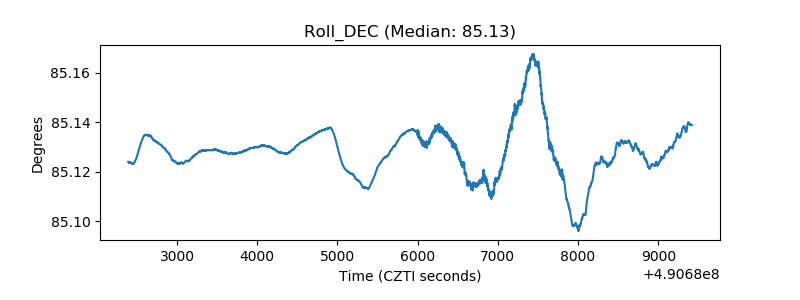 |
| _Roll_RA | 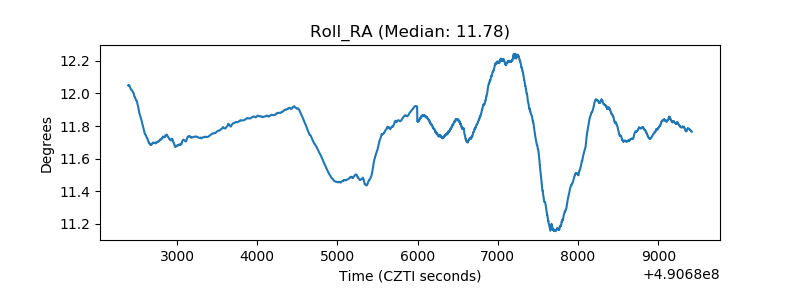 |
| Veto Counter | 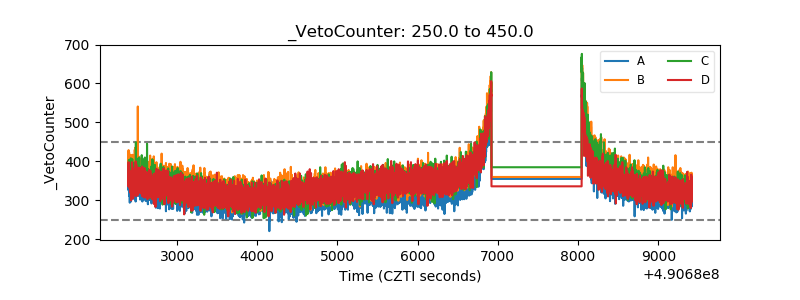 |