| Param | Original file | Final file |
|---|---|---|
| Filename | modeM0/AS1C09_011T07_9000006488_53065cztM0_level2.fits | modeM0/AS1C09_011T07_9000006488_53065cztM0_level2_quad_clean.evt |
| Size (bytes) | 563,132,160 | 93,490,560 |
| Size | 537.0 MB | 89.2 MB |
| Events in quadrant A | 5,080,727 | 612,402 |
| Events in quadrant B | 3,991,720 | 659,591 |
| Events in quadrant C | 6,723,225 | 536,313 |
| Events in quadrant D | 4,529,577 | 555,489 |
| Mode SS | |||
|---|---|---|---|
| Quadrant | BADHDUFLAG | Total packets | Discarded packets |
| A | 0 | 134 | 0 |
| B | 0 | 134 | 0 |
| C | 0 | 134 | 0 |
| D | 0 | 134 | 0 |
| Mode M9 | |||
|---|---|---|---|
| Quadrant | BADHDUFLAG | Total packets | Discarded packets |
| A | 0 | 12 | 0 |
| B | 0 | 12 | 0 |
| C | 0 | 13 | 0 |
| D | 0 | 13 | 0 |
| Mode M0 | |||
|---|---|---|---|
| Quadrant | BADHDUFLAG | Total packets | Discarded packets |
| A | 0 | 19836 | 2 |
| B | 0 | 16796 | 2 |
| C | 0 | 24694 | 2 |
| D | 0 | 18286 | 2 |
| Quadrant | Total seconds | Saturated seconds | Saturation percentage |
|---|---|---|---|
| A | 6702 | 473 | 7.057595% |
| B | 6702 | 366 | 5.461056% |
| C | 6702 | 984 | 14.682184% |
| D | 6702 | 348 | 5.192480% |
Noise dominated data is calculated using 1-second bins in cleaned event files. If a bin has >2000 counts, and if more than 50% of those come from <1% of pixels, then it is considered to be noise-dominated and hence unusable.
| Quadrant | # 1 sec bins | Bins with >0 counts | Bins with >2000 counts | High rate bins dominated by noise | Noise dominated (total time) | Noise dominated (detector-on time) | Marked lightcurve |
|---|---|---|---|---|---|---|---|
| A | 7752 | 6703 | 324 | 324 | 4.18% | 4.83% | 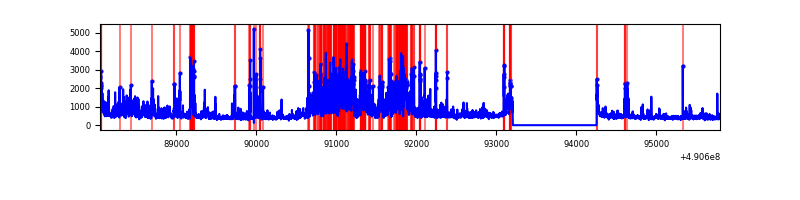 |
| B | 7752 | 6703 | 198 | 198 | 2.55% | 2.95% | 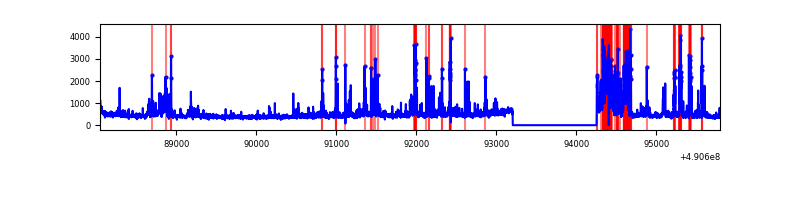 |
| C | 7752 | 6702 | 805 | 805 | 10.38% | 12.01% | 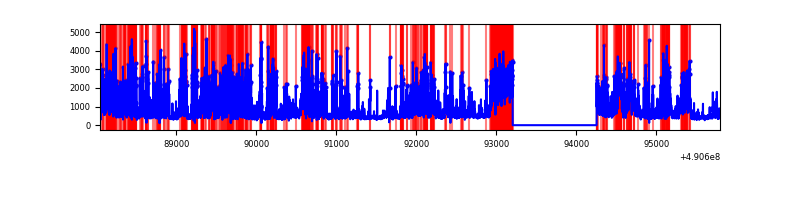 |
| D | 7752 | 6703 | 241 | 241 | 3.11% | 3.60% | 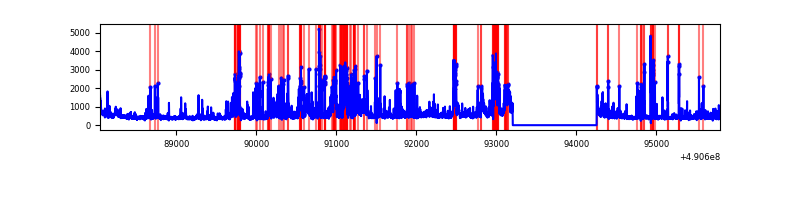 |
Top three noisy pixels from each quadrant. If the there are fewer than three noisy pixels in the level2.evt file, extra rows are filled as -1
| Pixel properties | Quadrant properties | ||||||
|---|---|---|---|---|---|---|---|
| Quadrant | DetID | PixID | Counts | Sigma | Mean | Median | Sigma |
| A | 9 | 191 | 1281634 | 7667.33 | 680 | 664 | 167.1 |
| A | 0 | 8 | 460013 | 2749.46 | 680 | 664 | 167.1 |
| A | 7 | 206 | 408046 | 2438.41 | 680 | 664 | 167.1 |
| B | 1 | 255 | 692015 | 4831.94 | 674 | 650 | 143.1 |
| B | 4 | 81 | 244080 | 1701.33 | 674 | 650 | 143.1 |
| B | 5 | 185 | 156214 | 1087.24 | 674 | 650 | 143.1 |
| C | 15 | 224 | 2617073 | 15206.34 | 623 | 616 | 172.1 |
| C | 1 | 241 | 692864 | 4023.21 | 623 | 616 | 172.1 |
| C | 7 | 80 | 236893 | 1373.2 | 623 | 616 | 172.1 |
| D | 12 | 17 | 895133 | 4769.65 | 655 | 625 | 187.5 |
| D | 3 | 12 | 118081 | 626.29 | 655 | 625 | 187.5 |
| D | 2 | 120 | 117577 | 623.61 | 655 | 625 | 187.5 |
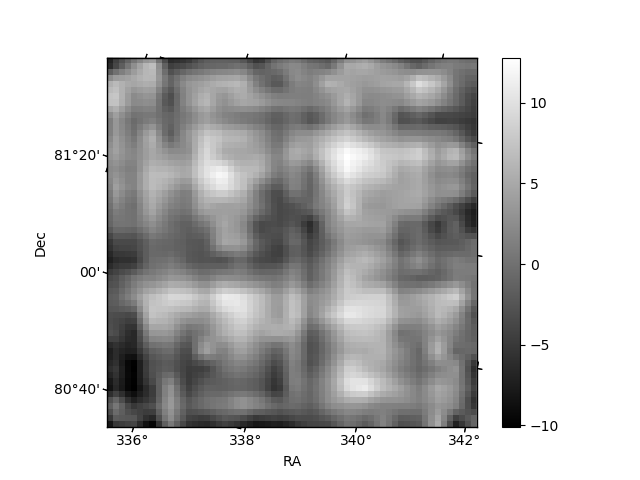
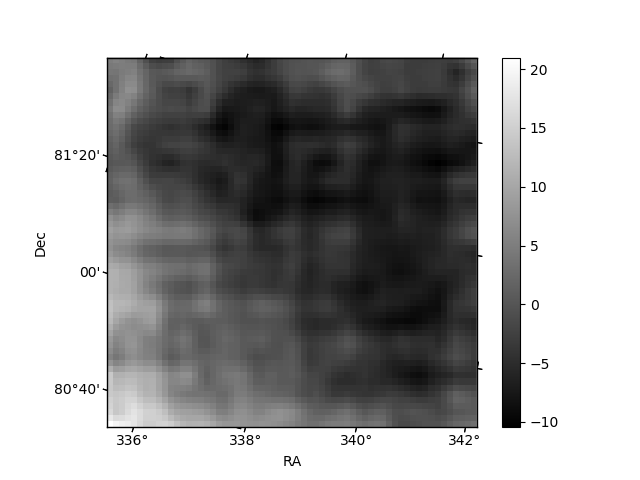
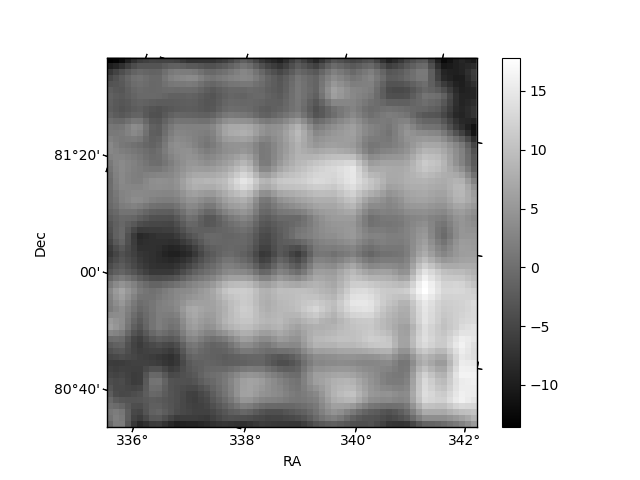
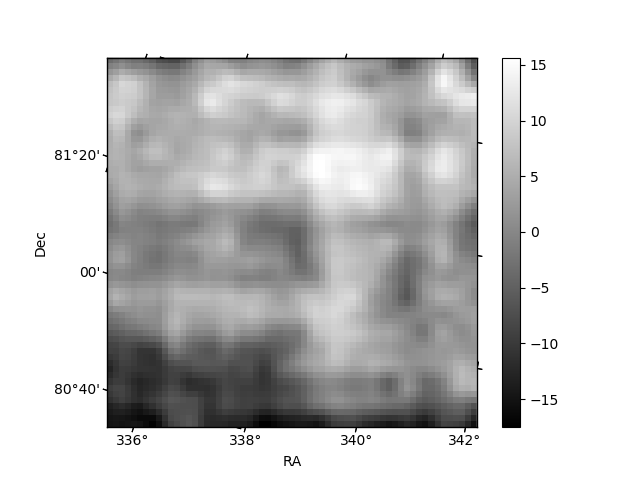
Histogram calculated using DETX and DETY for each event in the final _common_clean file
| Quadrant A | 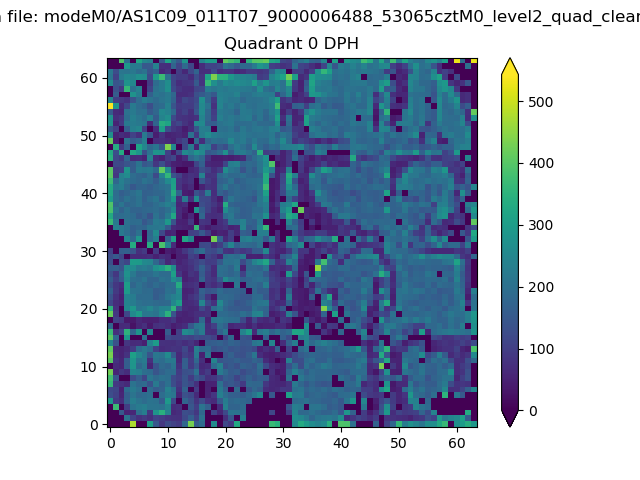 |
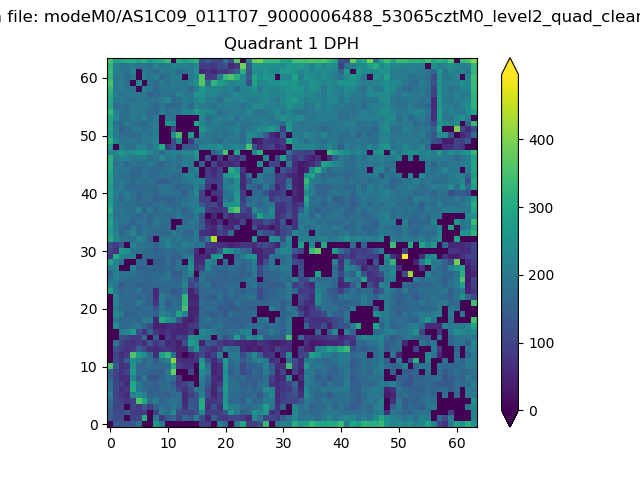 |
Quadrant B |
|---|---|---|---|
| Quadrant D | 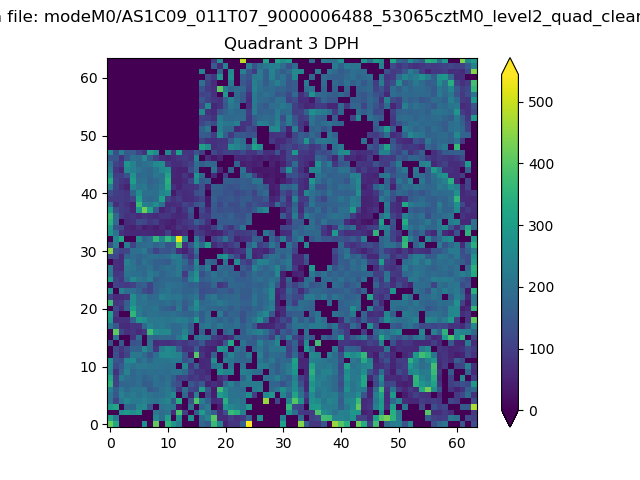 |
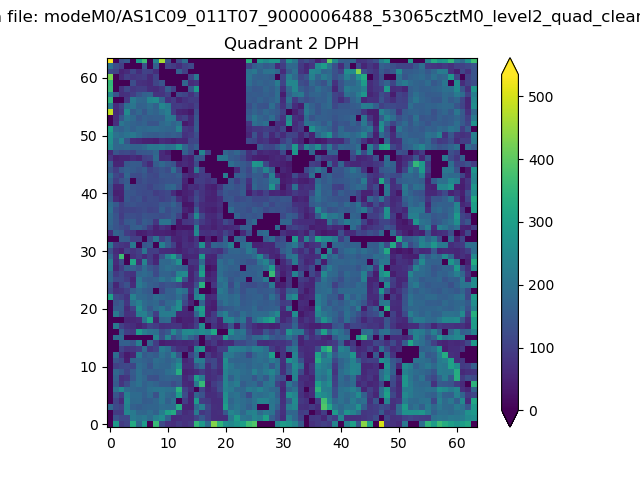 |
Quadrant C |
| Plot type | Count rate plots | Images |
|---|---|---|
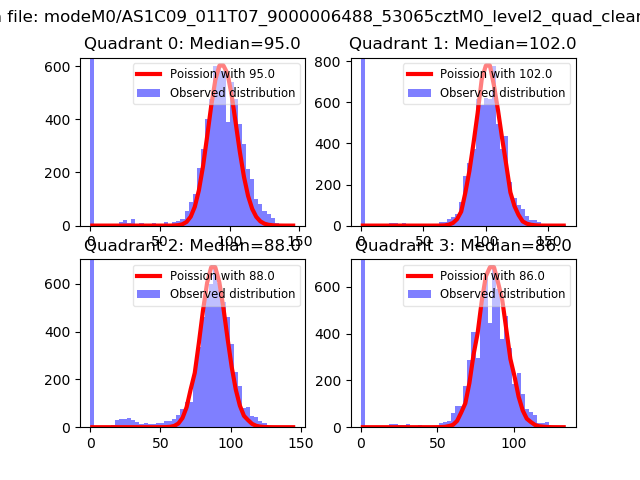
| Comparison with Poisson distribution Blue bars denote a histogram of data divided into 1 sec bins. Red curve is a Poisson curve with rate = median count rate of data. |
 |
 |
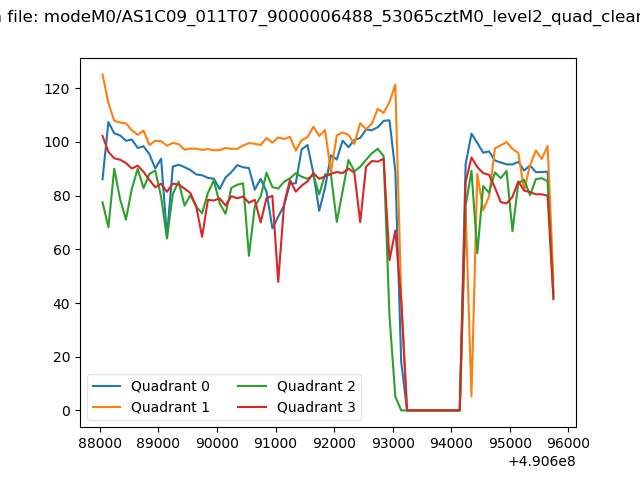
| Quadrant-wise count rates Data is divided into 100 sec bins |
 |
|
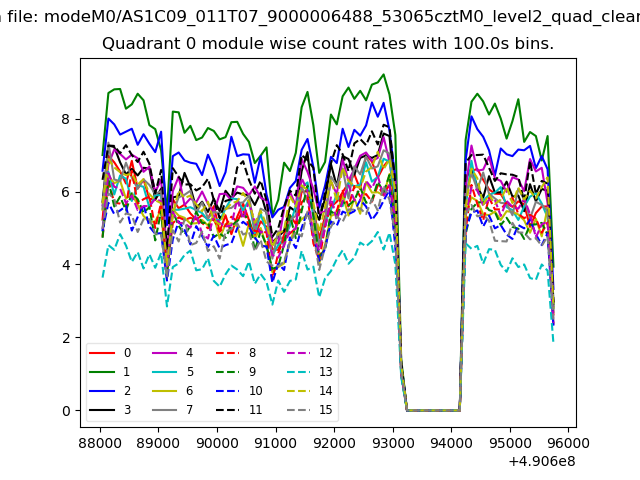
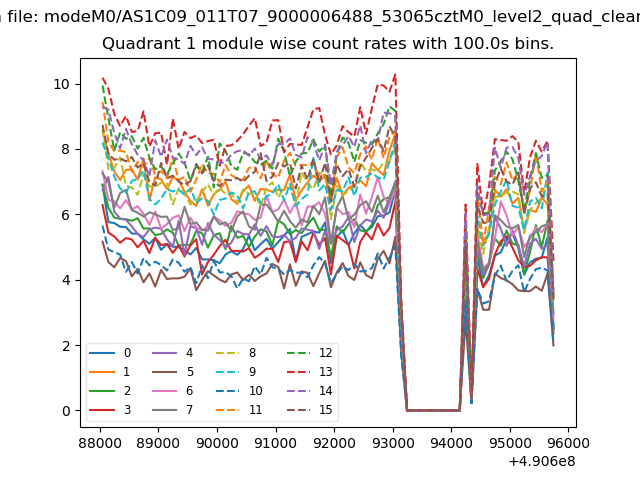
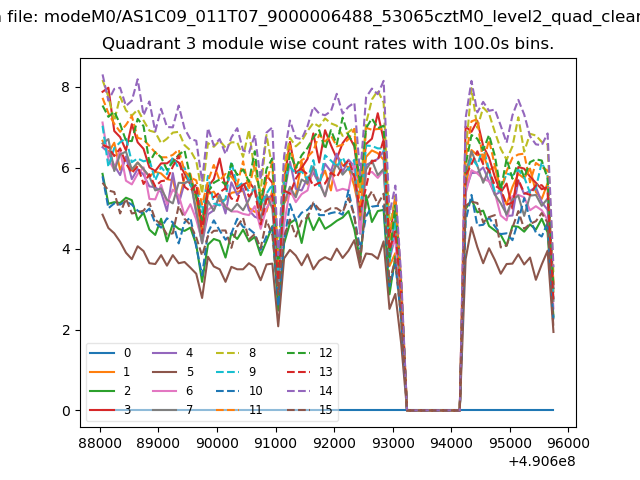
| Module-wise count rates for Quadrant A Data is divided into 100 sec bins |
 |
 |
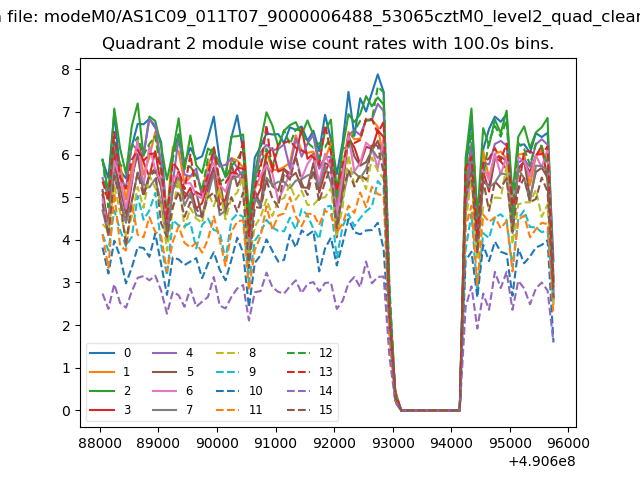
| Module-wise count rates for Quadrant B Data is divided into 100 sec bins |
 |
 |
| Module-wise count rates for Quadrant C Data is divided into 100 sec bins |
 |
 |
| Module-wise count rates for Quadrant D Data is divided into 100 sec bins |
 |
 |
| Parameter | Plot |
|---|---|
| CZT HV Monitor | 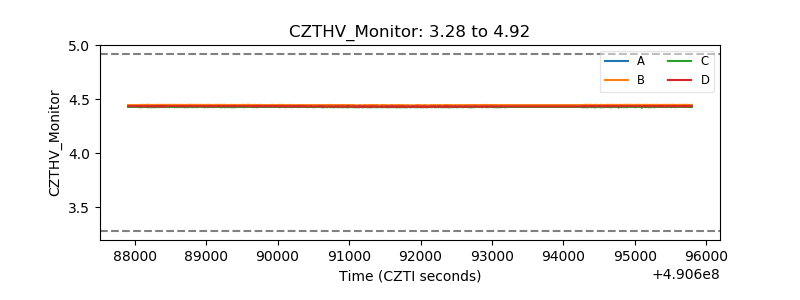 |
| D_VDD | 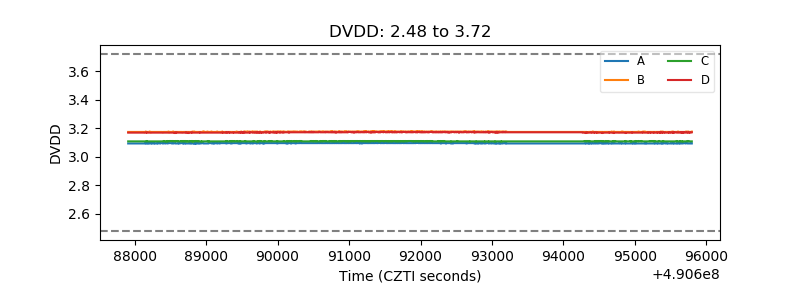 |
| Temperature 1 | 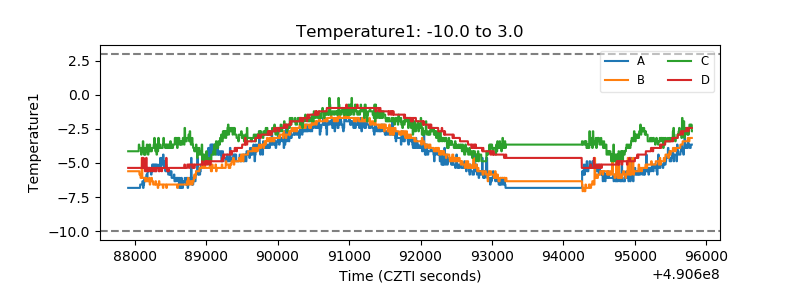 |
| Veto HV Monitor | 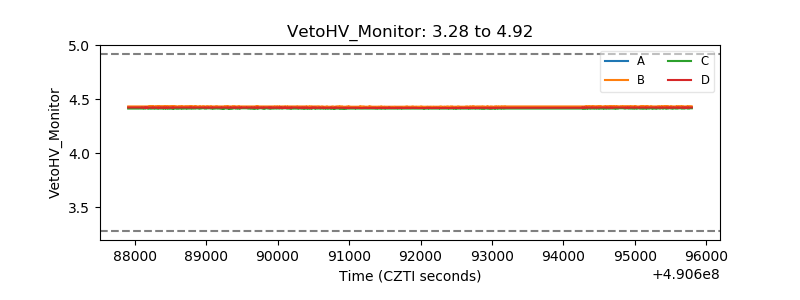 |
| Veto LLD | 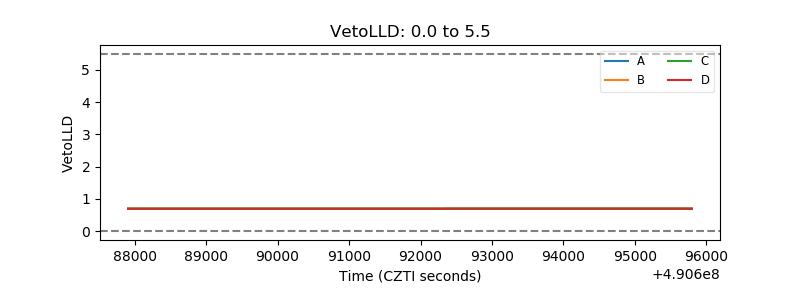 |
| Alpha Counter | 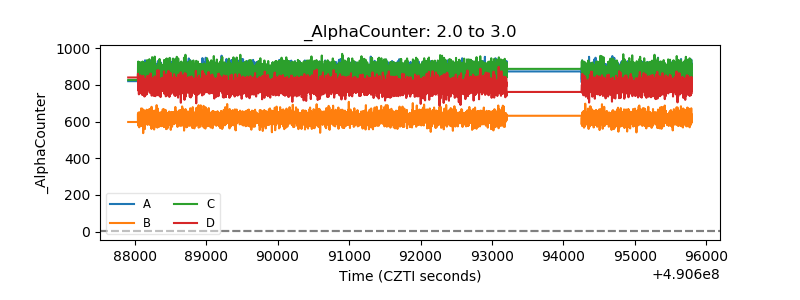 |
| _CPM_Rate | 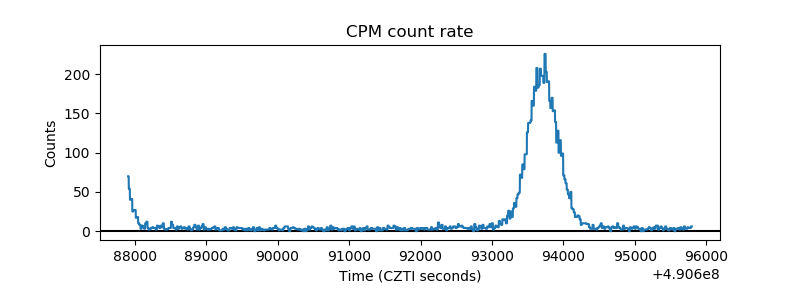 |
| CZT Counter | 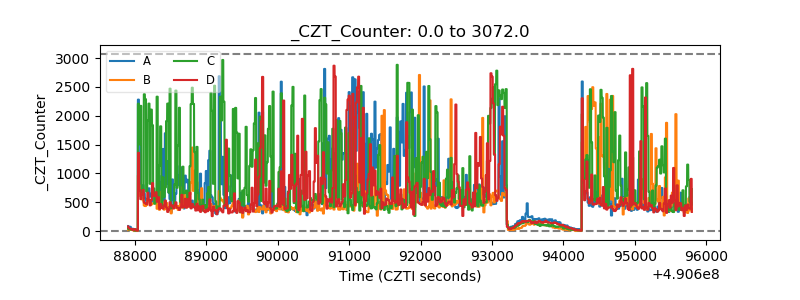 |
| +2.5 Volts monitor |  |
| +5 Volts monitor |  |
| _ROLL_ROT | 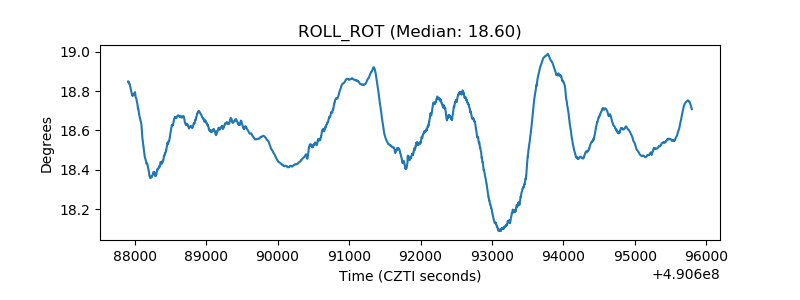 |
| _Roll_DEC | 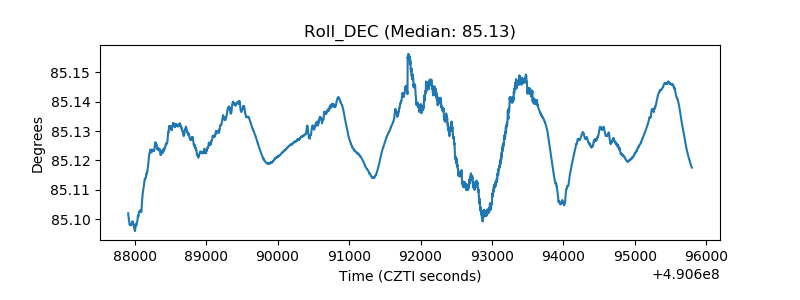 |
| _Roll_RA | 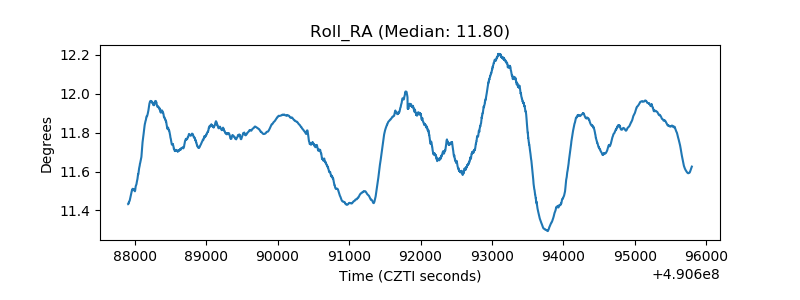 |
| Veto Counter | 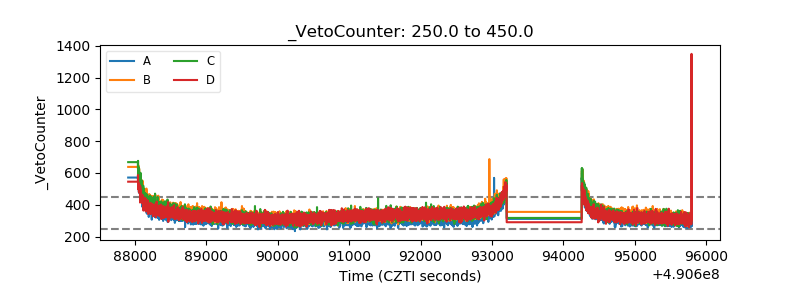 |