| Param | Original file | Final file |
|---|---|---|
| Filename | modeM0/AS1C09_011T07_9000006488_53066cztM0_level2.fits | modeM0/AS1C09_011T07_9000006488_53066cztM0_level2_quad_clean.evt |
| Size (bytes) | 644,817,600 | 87,048,000 |
| Size | 614.9 MB | 83.0 MB |
| Events in quadrant A | 5,810,058 | 579,646 |
| Events in quadrant B | 3,390,433 | 647,211 |
| Events in quadrant C | 9,506,544 | 412,896 |
| Events in quadrant D | 4,652,393 | 537,618 |
| Mode SS | |||
|---|---|---|---|
| Quadrant | BADHDUFLAG | Total packets | Discarded packets |
| A | 0 | 132 | 0 |
| B | 0 | 132 | 0 |
| C | 0 | 132 | 0 |
| D | 0 | 132 | 0 |
| Mode M9 | |||
|---|---|---|---|
| Quadrant | BADHDUFLAG | Total packets | Discarded packets |
| A | 0 | 8 | 0 |
| B | 0 | 8 | 0 |
| C | 0 | 8 | 0 |
| D | 0 | 8 | 0 |
| Mode M0 | |||
|---|---|---|---|
| Quadrant | BADHDUFLAG | Total packets | Discarded packets |
| A | 0 | 21898 | 2 |
| B | 0 | 14973 | 1 |
| C | 0 | 32813 | 1 |
| D | 0 | 18515 | 1 |
| Quadrant | Total seconds | Saturated seconds | Saturation percentage |
|---|---|---|---|
| A | 6572 | 644 | 9.799148% |
| B | 6573 | 202 | 3.073178% |
| C | 6573 | 2184 | 33.226837% |
| D | 6573 | 347 | 5.279172% |
Noise dominated data is calculated using 1-second bins in cleaned event files. If a bin has >2000 counts, and if more than 50% of those come from <1% of pixels, then it is considered to be noise-dominated and hence unusable.
| Quadrant | # 1 sec bins | Bins with >0 counts | Bins with >2000 counts | High rate bins dominated by noise | Noise dominated (total time) | Noise dominated (detector-on time) | Marked lightcurve |
|---|---|---|---|---|---|---|---|
| A | 7332 | 6573 | 387 | 387 | 5.28% | 5.89% | 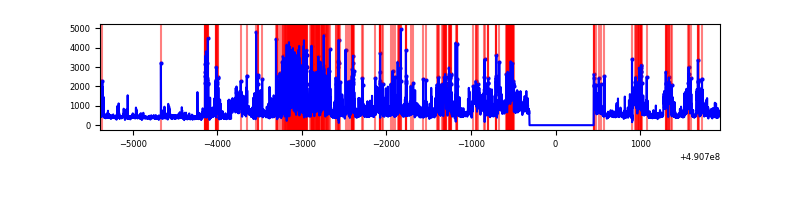 |
| B | 7333 | 6574 | 82 | 82 | 1.12% | 1.25% | 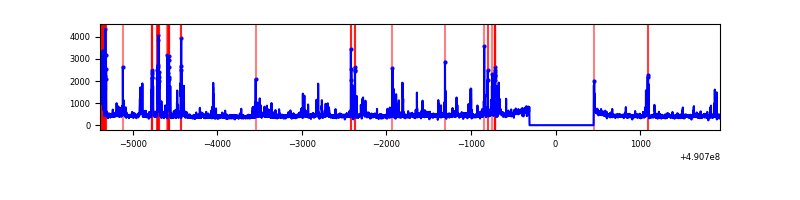 |
| C | 7333 | 6574 | 1917 | 1917 | 26.14% | 29.16% | 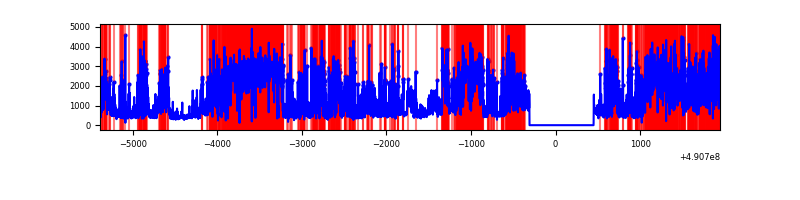 |
| D | 7333 | 6574 | 234 | 234 | 3.19% | 3.56% | 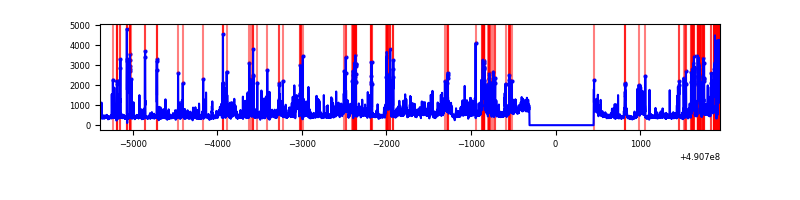 |
Top three noisy pixels from each quadrant. If the there are fewer than three noisy pixels in the level2.evt file, extra rows are filled as -1
| Pixel properties | Quadrant properties | ||||||
|---|---|---|---|---|---|---|---|
| Quadrant | DetID | PixID | Counts | Sigma | Mean | Median | Sigma |
| A | 9 | 191 | 930815 | 5717.8 | 658 | 642 | 162.7 |
| A | 3 | 49 | 898133 | 5516.9 | 658 | 642 | 162.7 |
| A | 15 | 190 | 806968 | 4956.51 | 658 | 642 | 162.7 |
| B | 1 | 255 | 256405 | 1795.52 | 662 | 639 | 142.4 |
| B | 4 | 81 | 174151 | 1218.09 | 662 | 639 | 142.4 |
| B | 7 | 128 | 90031 | 627.55 | 662 | 639 | 142.4 |
| C | 1 | 241 | 3549308 | 23458.0 | 549 | 544 | 151.3 |
| C | 15 | 224 | 1769492 | 11693.08 | 549 | 544 | 151.3 |
| C | 10 | 171 | 797797 | 5269.99 | 549 | 544 | 151.3 |
| D | 12 | 17 | 704631 | 3798.23 | 642 | 610 | 185.4 |
| D | 2 | 62 | 575395 | 3101.0 | 642 | 610 | 185.4 |
| D | 3 | 12 | 175305 | 942.49 | 642 | 610 | 185.4 |
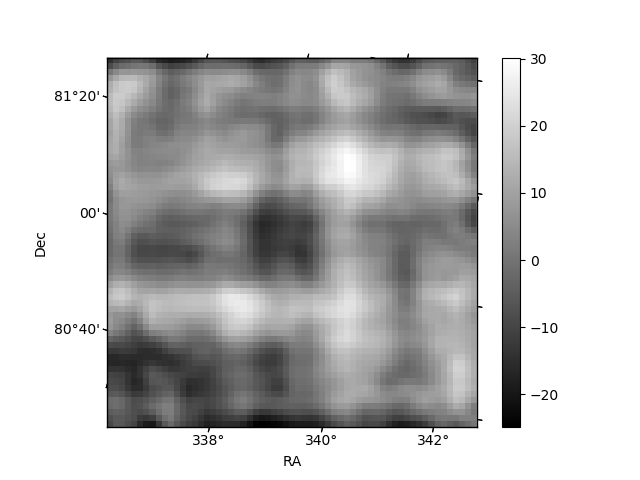
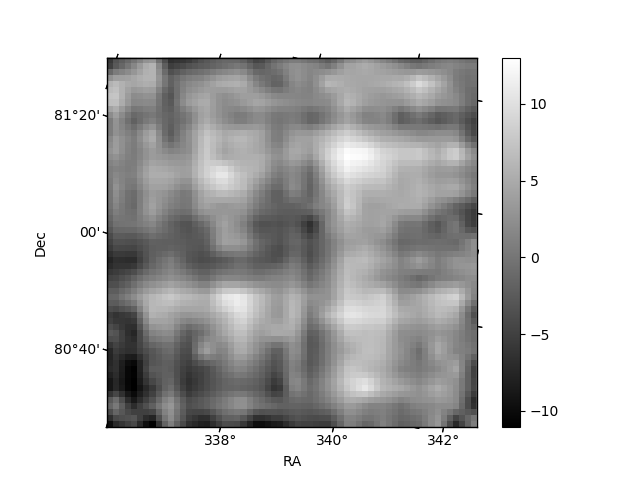
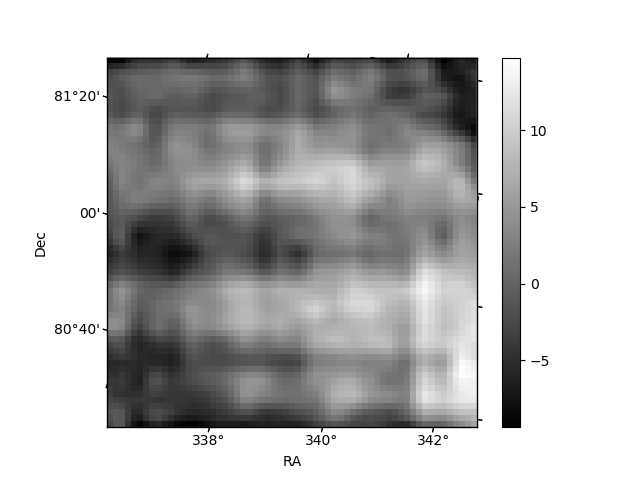
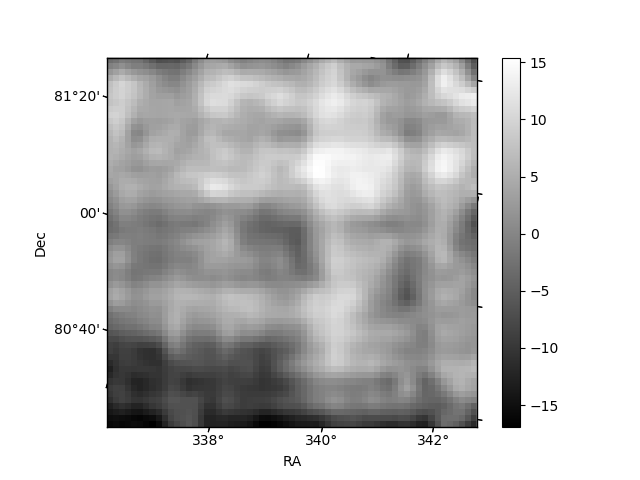
Histogram calculated using DETX and DETY for each event in the final _common_clean file
| Quadrant A | 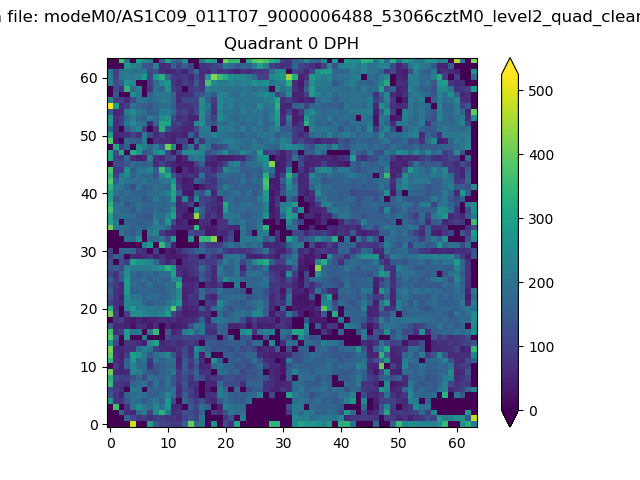 |
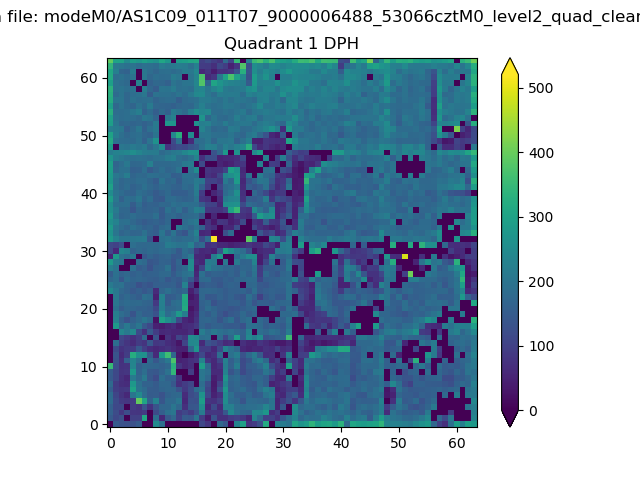 |
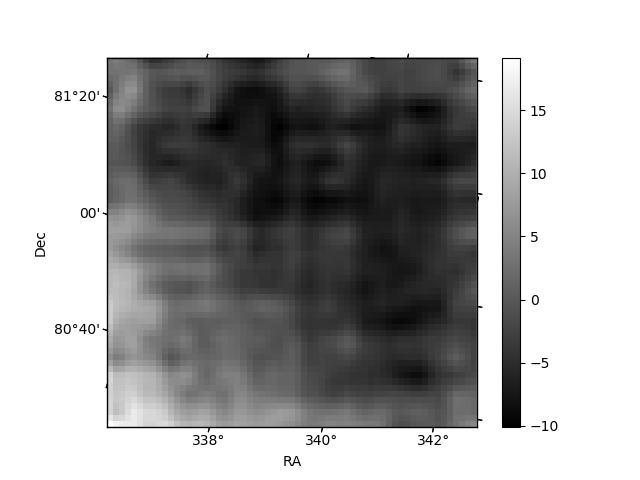
Quadrant B |
|---|---|---|---|
| Quadrant D | 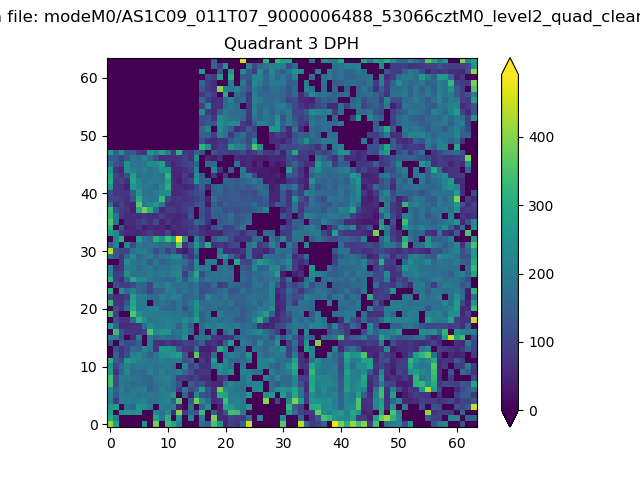 |
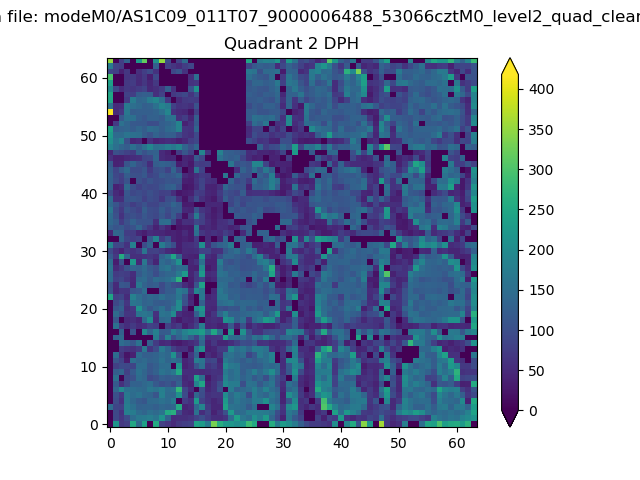 |
Quadrant C |
| Plot type | Count rate plots | Images |
|---|---|---|
| Comparison with Poisson distribution Blue bars denote a histogram of data divided into 1 sec bins. Red curve is a Poisson curve with rate = median count rate of data. |
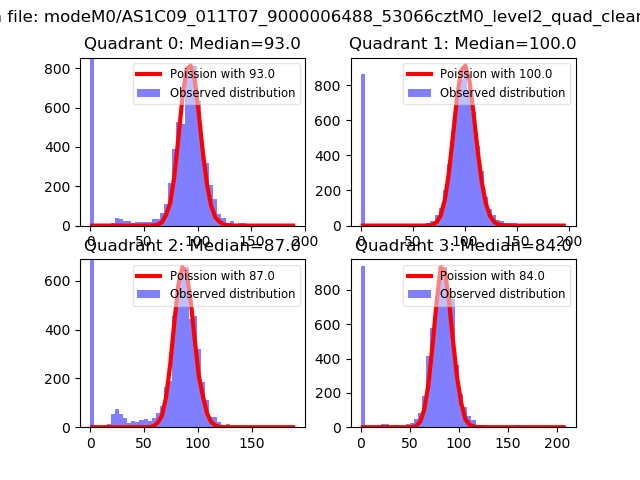 |
 |
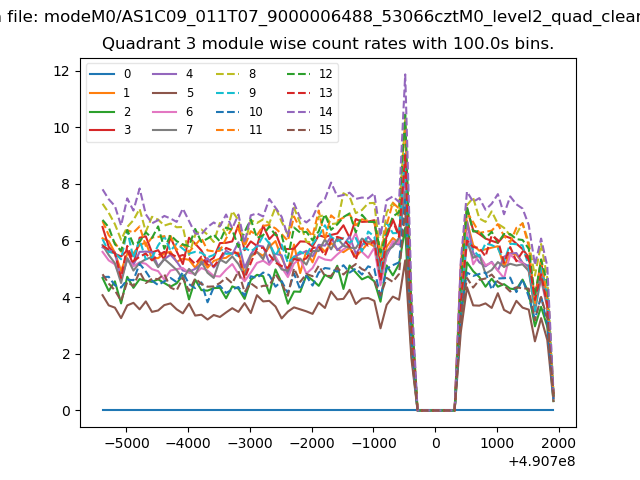
| Quadrant-wise count rates Data is divided into 100 sec bins |
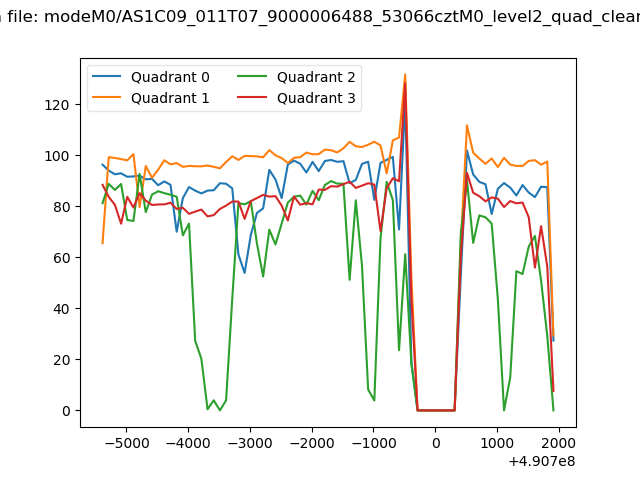 |
|
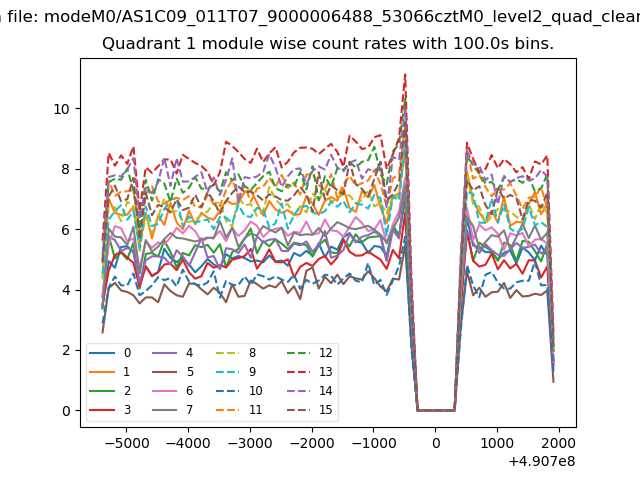
| Module-wise count rates for Quadrant A Data is divided into 100 sec bins |
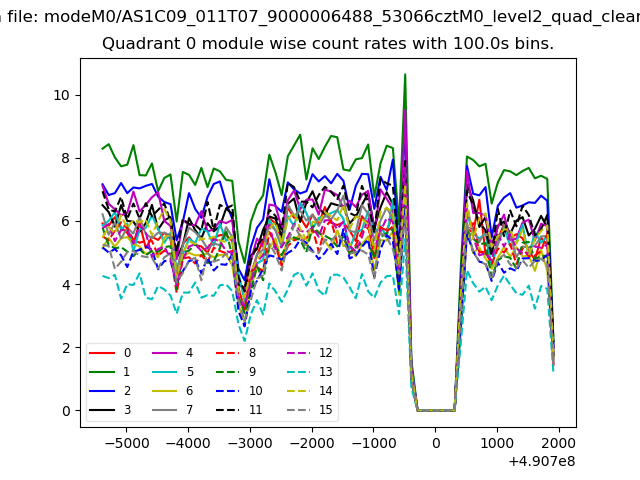 |
 |
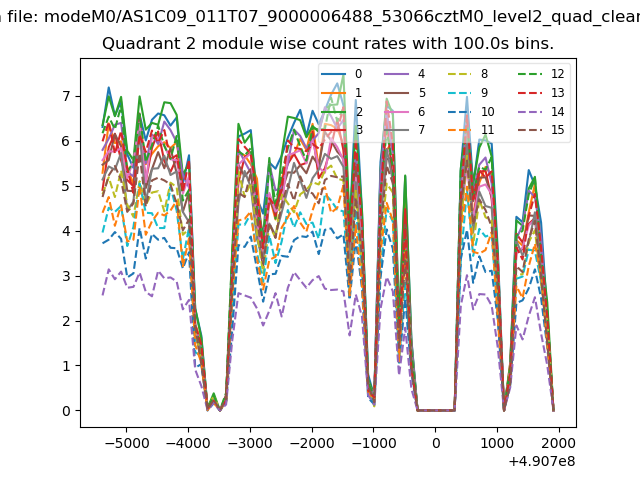
| Module-wise count rates for Quadrant B Data is divided into 100 sec bins |
 |
 |
| Module-wise count rates for Quadrant C Data is divided into 100 sec bins |
 |
 |
| Module-wise count rates for Quadrant D Data is divided into 100 sec bins |
 |
 |
| Parameter | Plot |
|---|---|
| CZT HV Monitor | 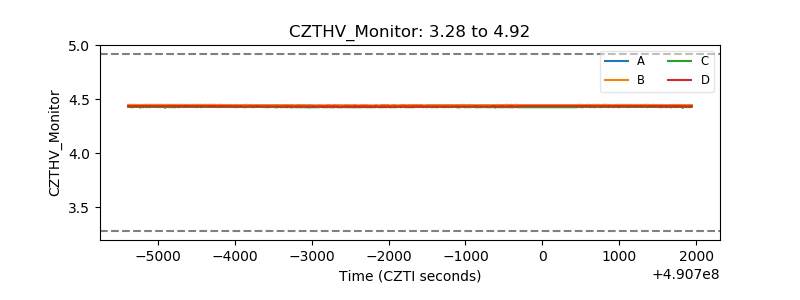 |
| D_VDD | 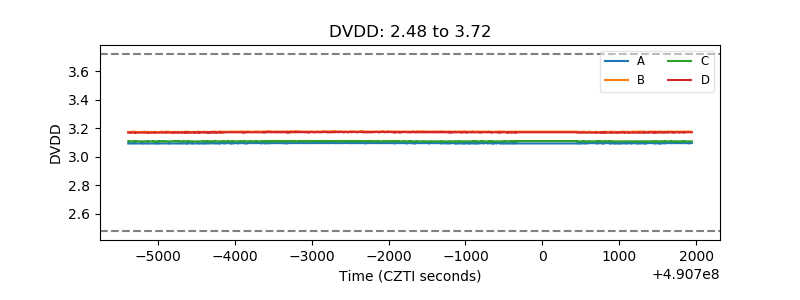 |
| Temperature 1 | 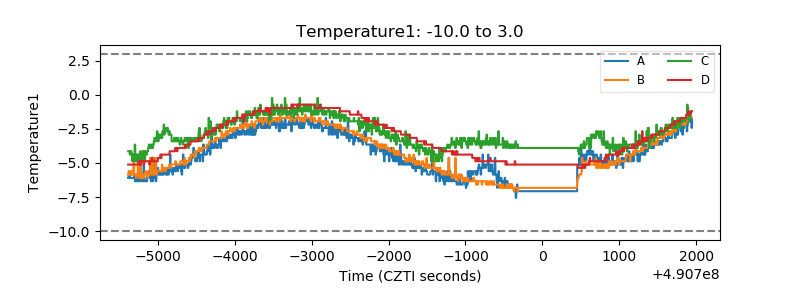 |
| Veto HV Monitor | 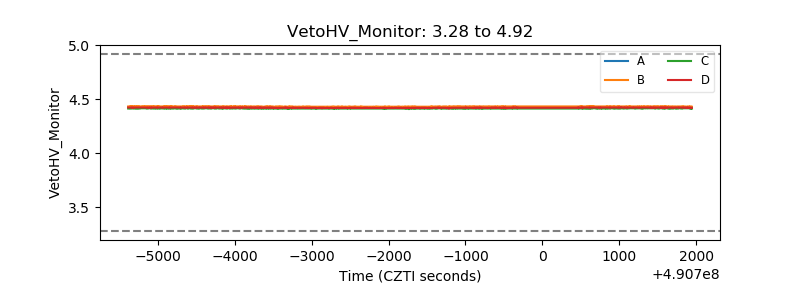 |
| Veto LLD | 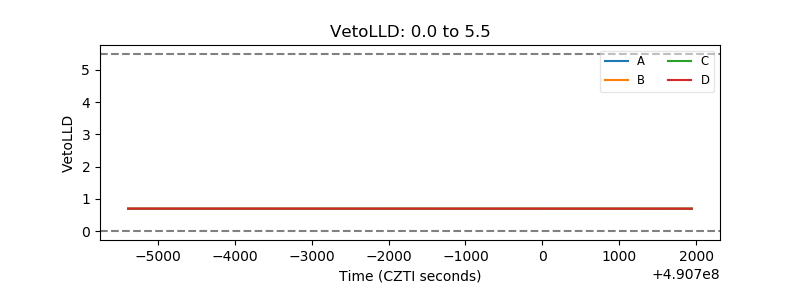 |
| Alpha Counter | 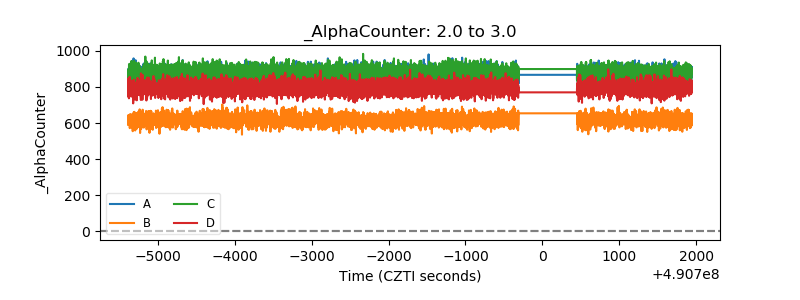 |
| _CPM_Rate | 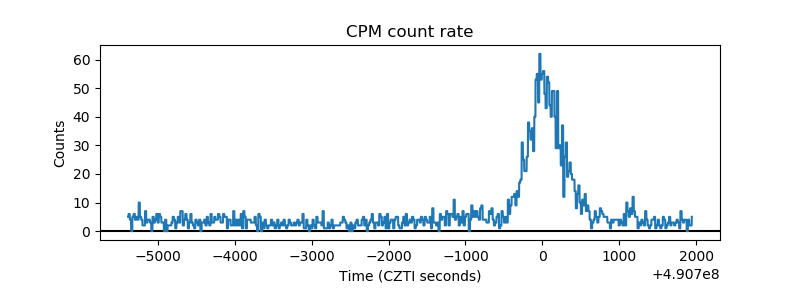 |
| CZT Counter | 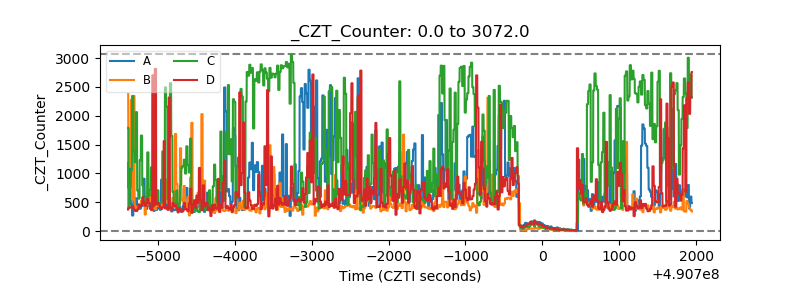 |
| +2.5 Volts monitor | 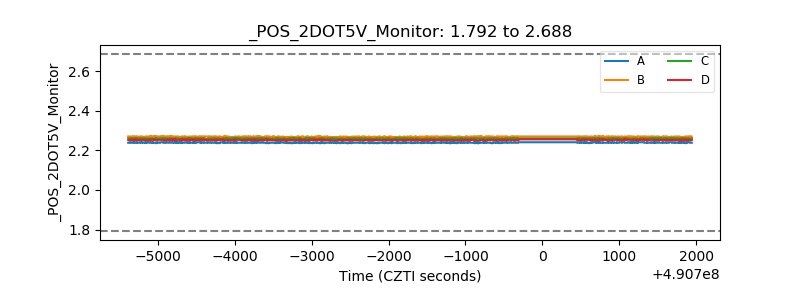 |
| +5 Volts monitor | 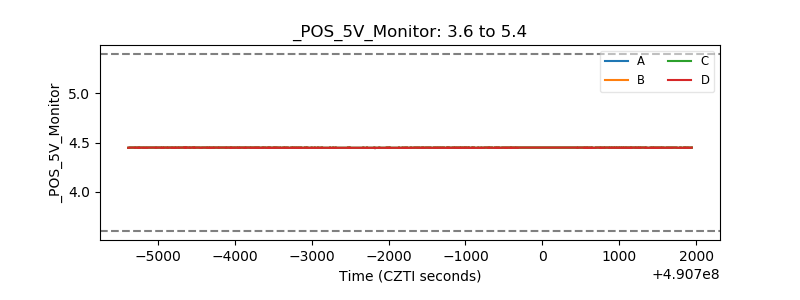 |
| _ROLL_ROT | 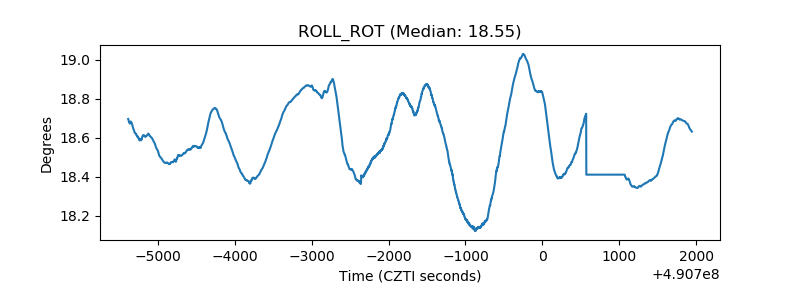 |
| _Roll_DEC | 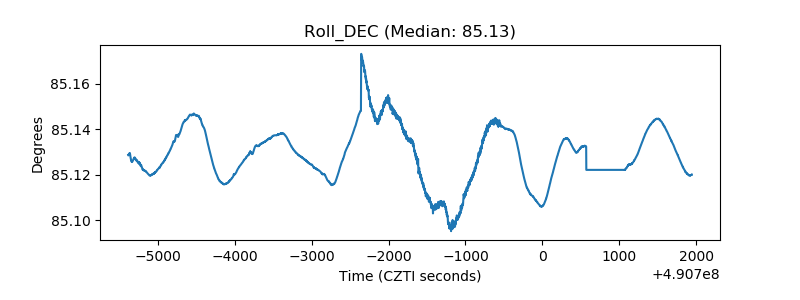 |
| _Roll_RA | 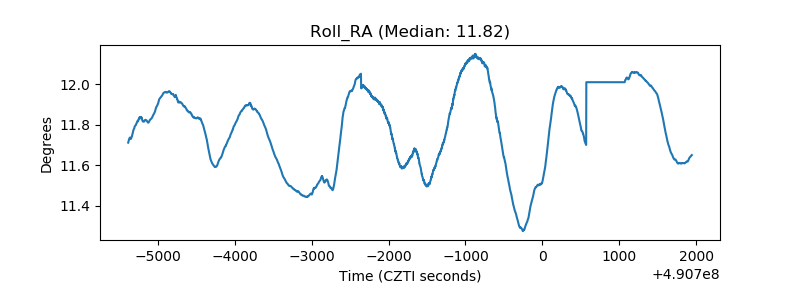 |
| Veto Counter | 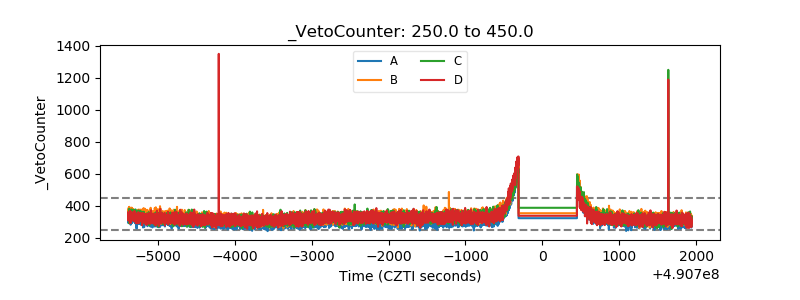 |