| Param | Original file | Final file |
|---|---|---|
| Filename | modeM0/AS1C09_011T07_9000006488_53067cztM0_level2.fits | modeM0/AS1C09_011T07_9000006488_53067cztM0_level2_quad_clean.evt |
| Size (bytes) | 842,578,560 | 90,538,560 |
| Size | 803.5 MB | 86.3 MB |
| Events in quadrant A | 9,682,413 | 525,650 |
| Events in quadrant B | 4,048,354 | 700,060 |
| Events in quadrant C | 10,662,785 | 460,473 |
| Events in quadrant D | 6,240,494 | 554,353 |
| Mode SS | |||
|---|---|---|---|
| Quadrant | BADHDUFLAG | Total packets | Discarded packets |
| A | 0 | 144 | 0 |
| B | 0 | 144 | 0 |
| C | 0 | 144 | 0 |
| D | 0 | 144 | 0 |
| Mode M0 | |||
|---|---|---|---|
| Quadrant | BADHDUFLAG | Total packets | Discarded packets |
| A | 0 | 33734 | 1 |
| B | 0 | 17398 | 5 |
| C | 0 | 36672 | 1 |
| D | 0 | 23474 | 1 |
| Quadrant | Total seconds | Saturated seconds | Saturation percentage |
|---|---|---|---|
| A | 7182 | 1980 | 27.568922% |
| B | 7181 | 384 | 5.347445% |
| C | 7181 | 2436 | 33.922852% |
| D | 7181 | 890 | 12.393817% |
Noise dominated data is calculated using 1-second bins in cleaned event files. If a bin has >2000 counts, and if more than 50% of those come from <1% of pixels, then it is considered to be noise-dominated and hence unusable.
| Quadrant | # 1 sec bins | Bins with >0 counts | Bins with >2000 counts | High rate bins dominated by noise | Noise dominated (total time) | Noise dominated (detector-on time) | Marked lightcurve |
|---|---|---|---|---|---|---|---|
| A | 7197 | 7183 | 1335 | 1335 | 18.55% | 18.59% | 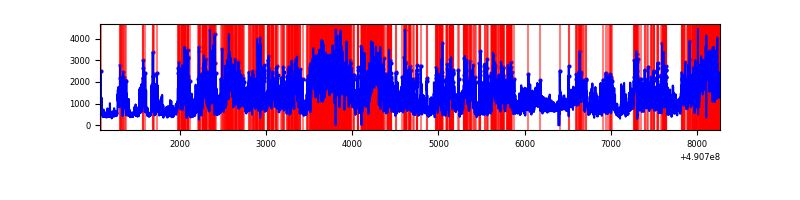 |
| B | 7196 | 7182 | 106 | 106 | 1.47% | 1.48% | 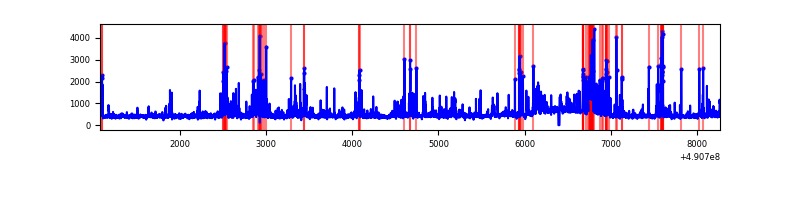 |
| C | 7196 | 7182 | 1972 | 1972 | 27.40% | 27.46% | 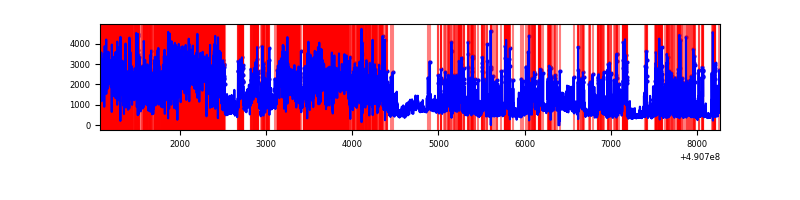 |
| D | 7196 | 7182 | 629 | 629 | 8.74% | 8.76% | 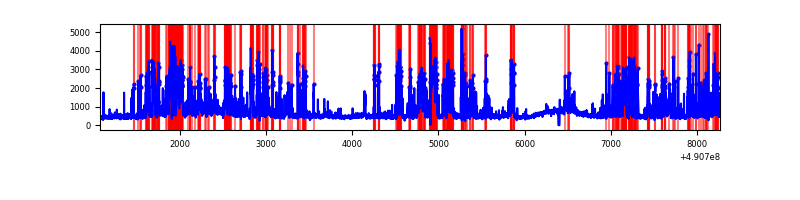 |
Top three noisy pixels from each quadrant. If the there are fewer than three noisy pixels in the level2.evt file, extra rows are filled as -1
| Pixel properties | Quadrant properties | ||||||
|---|---|---|---|---|---|---|---|
| Quadrant | DetID | PixID | Counts | Sigma | Mean | Median | Sigma |
| A | 9 | 191 | 5359661 | 30866.08 | 701 | 684 | 173.6 |
| A | 7 | 206 | 665121 | 3826.96 | 701 | 684 | 173.6 |
| A | 15 | 190 | 273528 | 1571.5 | 701 | 684 | 173.6 |
| B | 1 | 255 | 500721 | 3126.89 | 744 | 718 | 159.9 |
| B | 10 | 247 | 276460 | 1724.42 | 744 | 718 | 159.9 |
| B | 4 | 81 | 90887 | 563.89 | 744 | 718 | 159.9 |
| C | 10 | 171 | 3034348 | 17286.98 | 641 | 633 | 175.5 |
| C | 15 | 224 | 2554839 | 14554.6 | 641 | 633 | 175.5 |
| C | 1 | 241 | 1459737 | 8314.39 | 641 | 633 | 175.5 |
| D | 12 | 17 | 1498476 | 7267.19 | 719 | 686 | 206.1 |
| D | 3 | 12 | 331071 | 1603.01 | 719 | 686 | 206.1 |
| D | 15 | 78 | 315008 | 1525.07 | 719 | 686 | 206.1 |
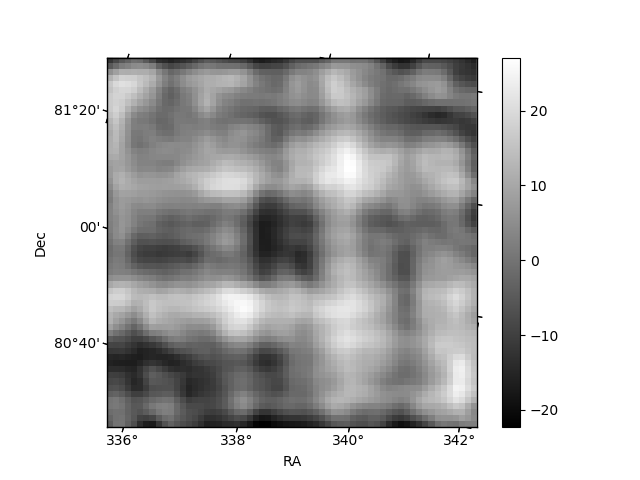
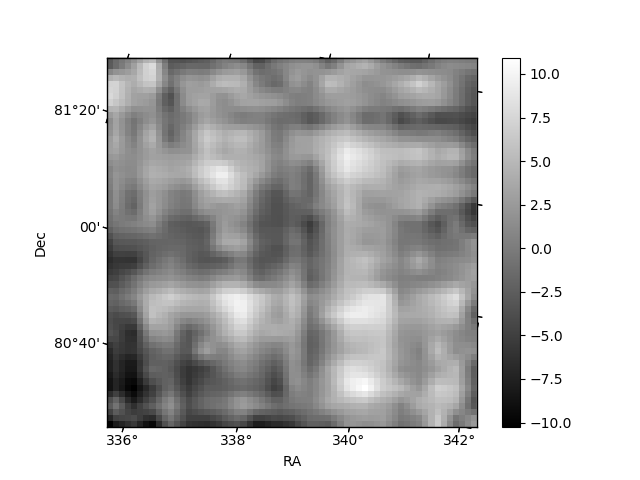
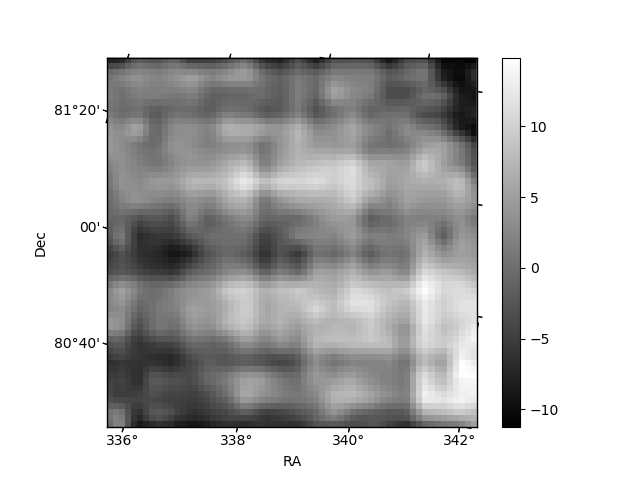
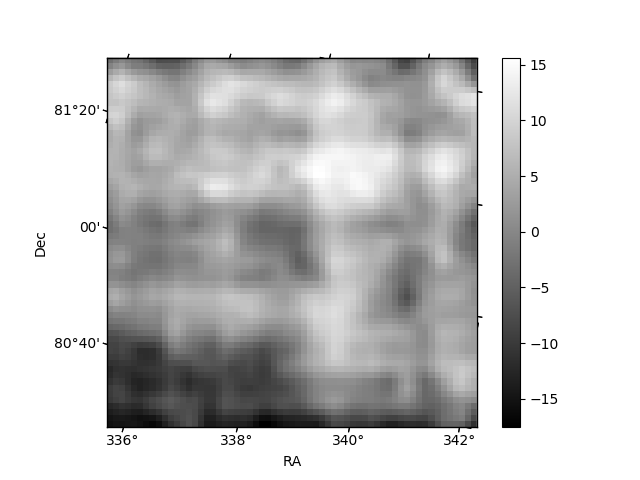
Histogram calculated using DETX and DETY for each event in the final _common_clean file
| Quadrant A | 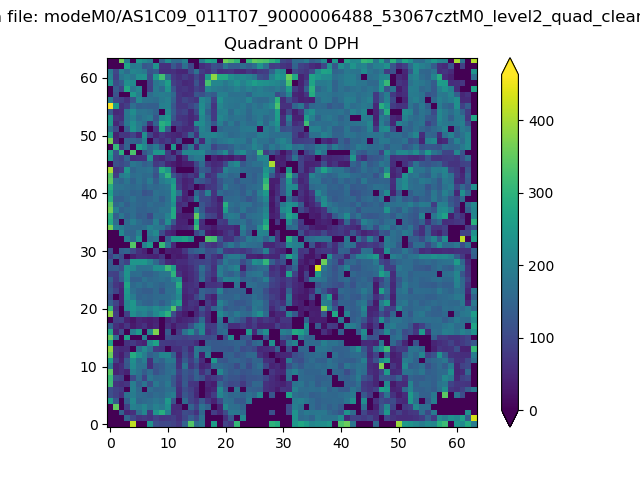 |
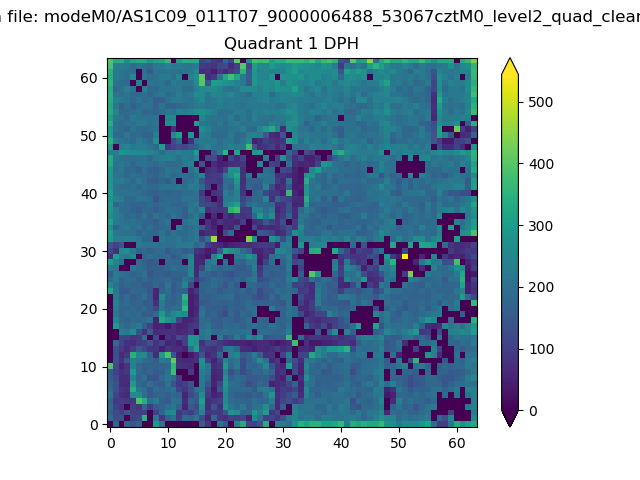 |
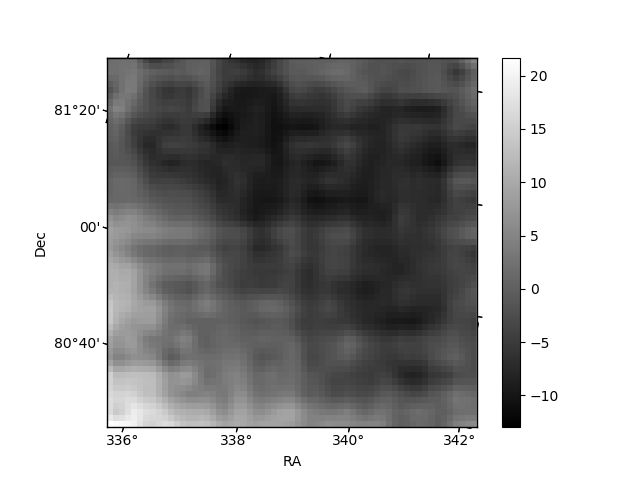
Quadrant B |
|---|---|---|---|
| Quadrant D | 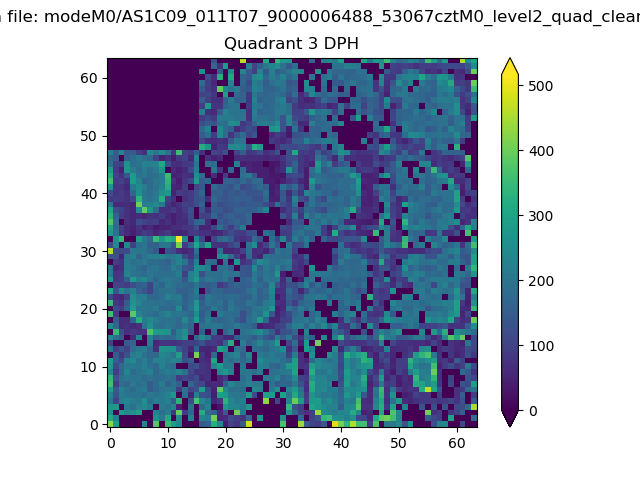 |
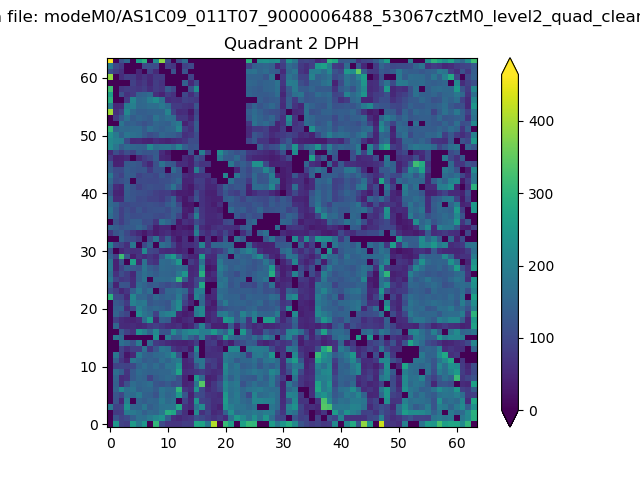 |
Quadrant C |
| Plot type | Count rate plots | Images |
|---|---|---|
| Comparison with Poisson distribution Blue bars denote a histogram of data divided into 1 sec bins. Red curve is a Poisson curve with rate = median count rate of data. |
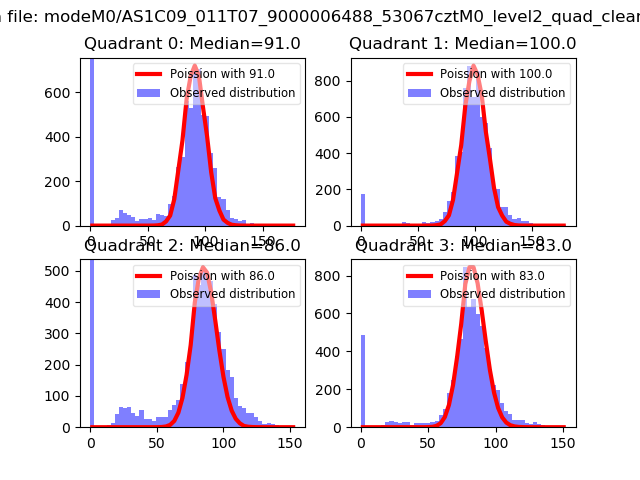 |
 |
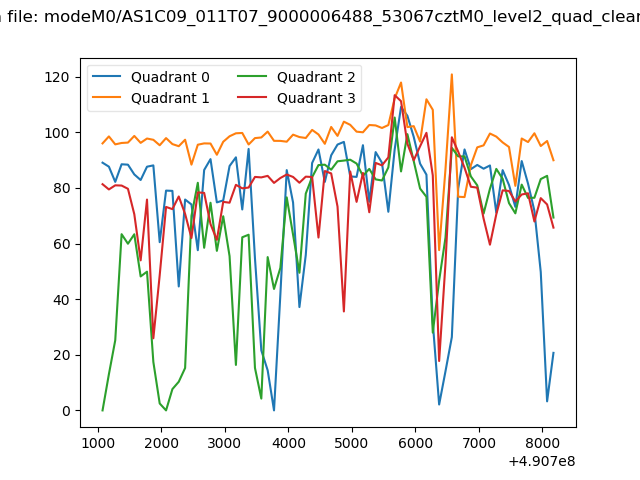
| Quadrant-wise count rates Data is divided into 100 sec bins |
 |
|
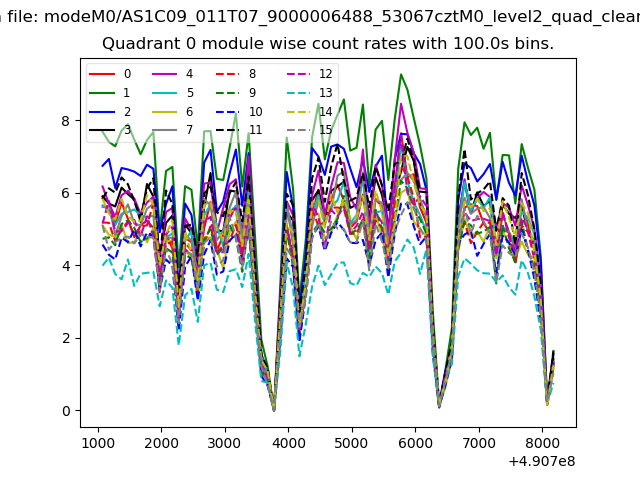
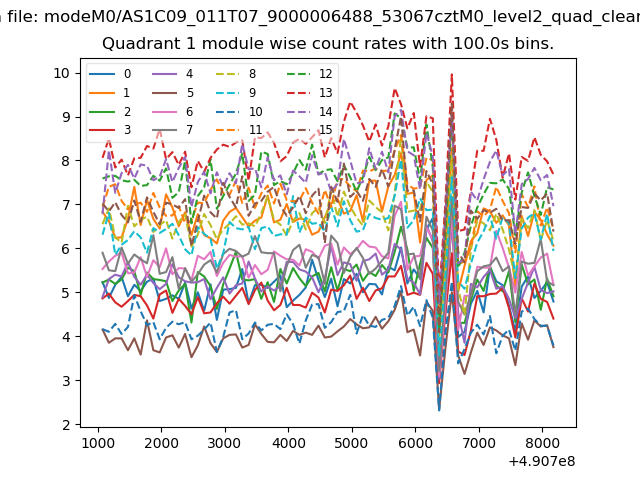
| Module-wise count rates for Quadrant A Data is divided into 100 sec bins |
 |
 |
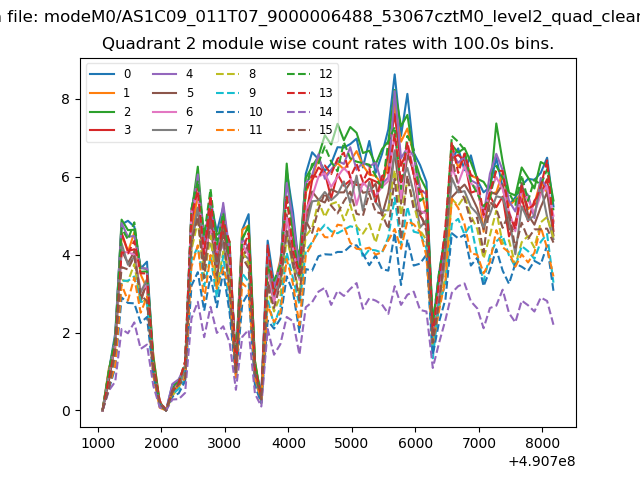
| Module-wise count rates for Quadrant B Data is divided into 100 sec bins |
 |
 |
| Module-wise count rates for Quadrant C Data is divided into 100 sec bins |
 |
 |
| Module-wise count rates for Quadrant D Data is divided into 100 sec bins |
 |
 |
| Parameter | Plot |
|---|---|
| CZT HV Monitor | 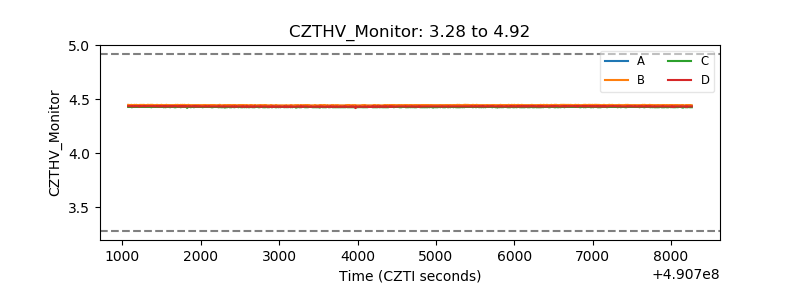 |
| D_VDD | 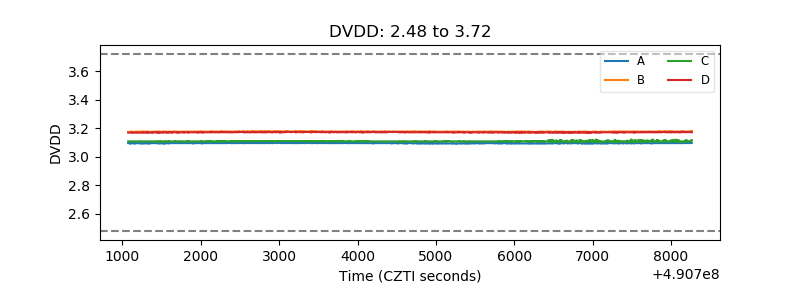 |
| Temperature 1 | 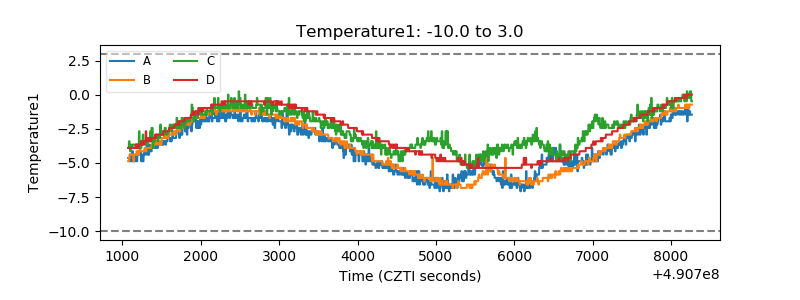 |
| Veto HV Monitor | 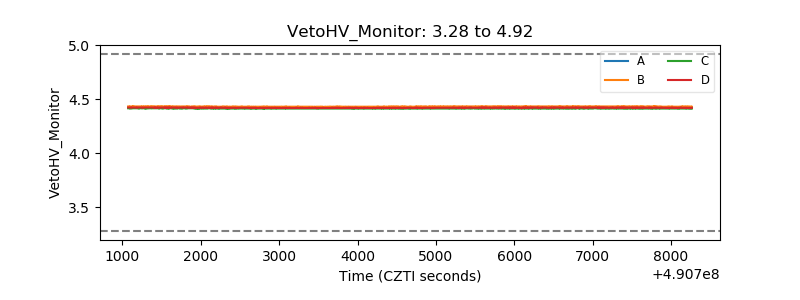 |
| Veto LLD | 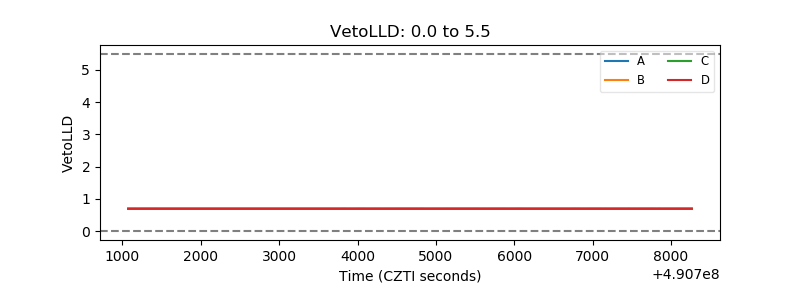 |
| Alpha Counter | 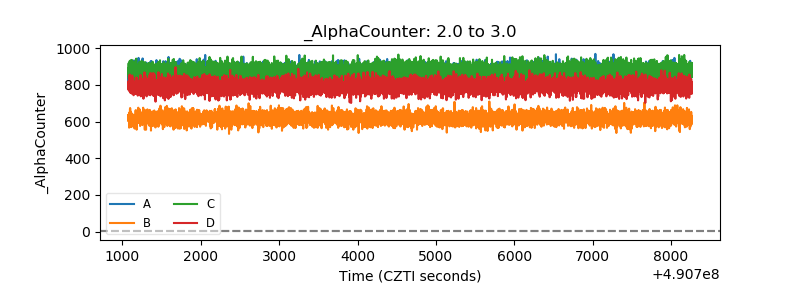 |
| _CPM_Rate | 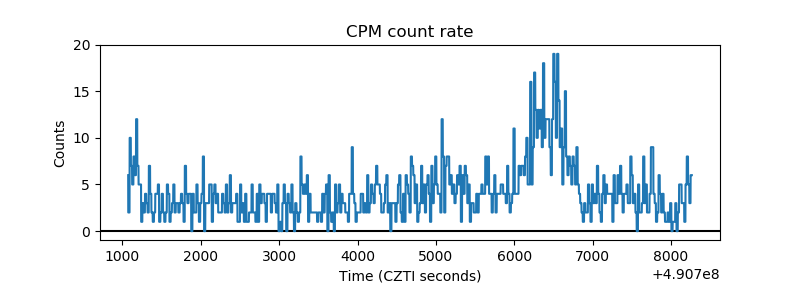 |
| CZT Counter | 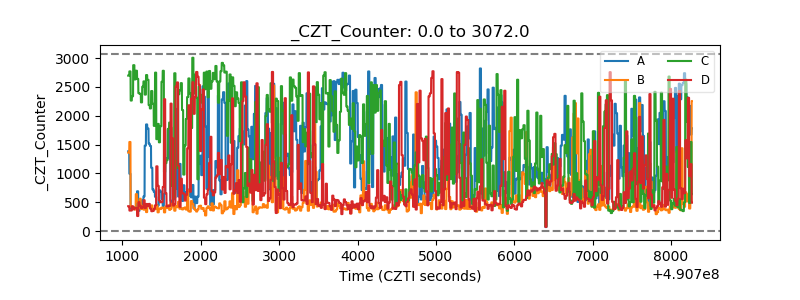 |
| +2.5 Volts monitor |  |
| +5 Volts monitor |  |
| _ROLL_ROT | 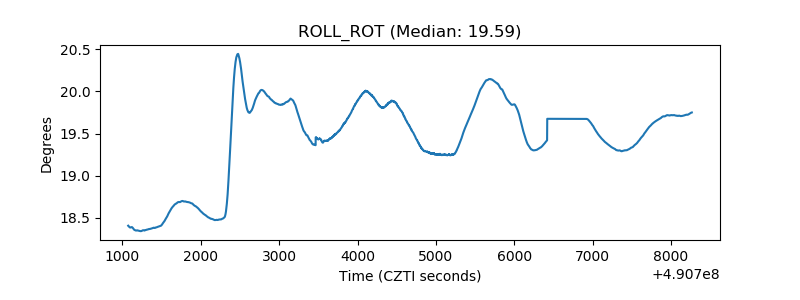 |
| _Roll_DEC | 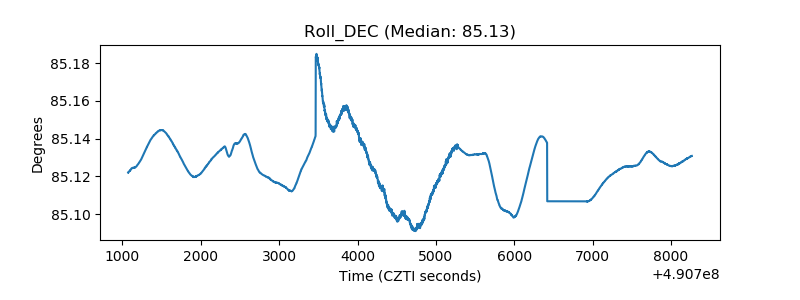 |
| _Roll_RA | 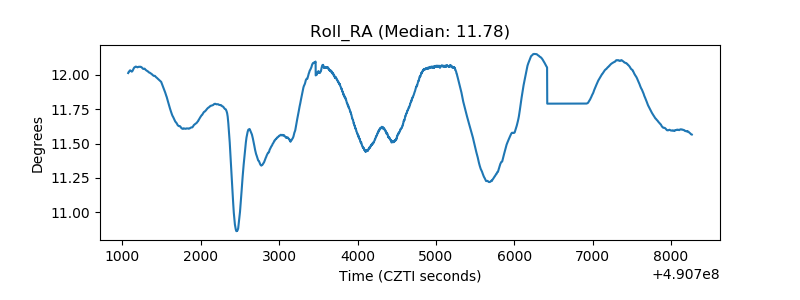 |
| Veto Counter | 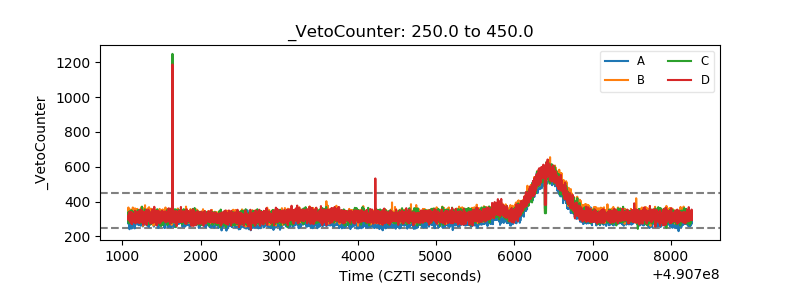 |