| Param | Original file | Final file |
|---|---|---|
| Filename | modeM0/AS1C09_011T07_9000006488_53069cztM0_level2.fits | modeM0/AS1C09_011T07_9000006488_53069cztM0_level2_quad_clean.evt |
| Size (bytes) | 1,083,430,080 | 82,149,120 |
| Size | 1.0 GB | 78.3 MB |
| Events in quadrant A | 17,320,323 | 129,454 |
| Events in quadrant B | 7,059,889 | 664,756 |
| Events in quadrant C | 8,856,801 | 570,289 |
| Events in quadrant D | 6,280,767 | 593,855 |
| Mode SS | |||
|---|---|---|---|
| Quadrant | BADHDUFLAG | Total packets | Discarded packets |
| A | 0 | 152 | 0 |
| B | 0 | 152 | 0 |
| C | 0 | 152 | 0 |
| D | 0 | 152 | 0 |
| Mode M0 | |||
|---|---|---|---|
| Quadrant | BADHDUFLAG | Total packets | Discarded packets |
| A | 0 | 56519 | 0 |
| B | 0 | 26325 | 6 |
| C | 0 | 31611 | 0 |
| D | 0 | 23839 | 0 |
| Quadrant | Total seconds | Saturated seconds | Saturation percentage |
|---|---|---|---|
| A | 7595 | 6509 | 85.701119% |
| B | 7595 | 1110 | 14.614878% |
| C | 7595 | 1474 | 19.407505% |
| D | 7595 | 735 | 9.677419% |
Noise dominated data is calculated using 1-second bins in cleaned event files. If a bin has >2000 counts, and if more than 50% of those come from <1% of pixels, then it is considered to be noise-dominated and hence unusable.
| Quadrant | # 1 sec bins | Bins with >0 counts | Bins with >2000 counts | High rate bins dominated by noise | Noise dominated (total time) | Noise dominated (detector-on time) | Marked lightcurve |
|---|---|---|---|---|---|---|---|
| A | 7595 | 7595 | 5239 | 5239 | 68.98% | 68.98% | 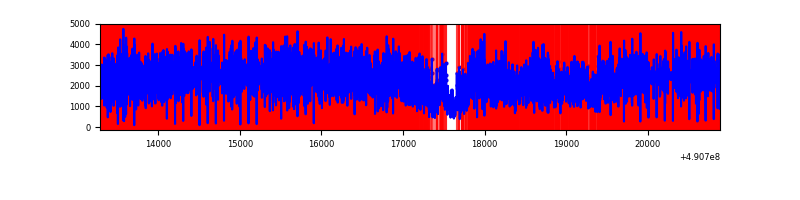 |
| B | 7595 | 7595 | 825 | 825 | 10.86% | 10.86% | 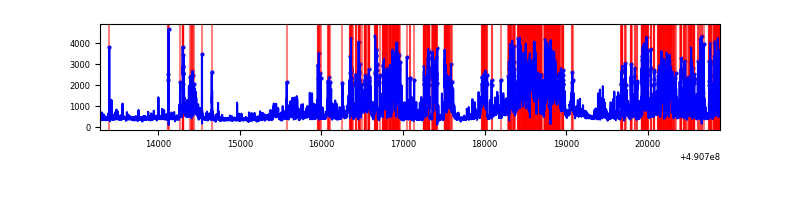 |
| C | 7595 | 7595 | 1234 | 1234 | 16.25% | 16.25% | 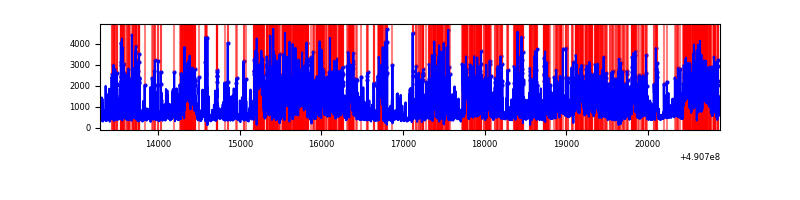 |
| D | 7595 | 7595 | 596 | 596 | 7.85% | 7.85% | 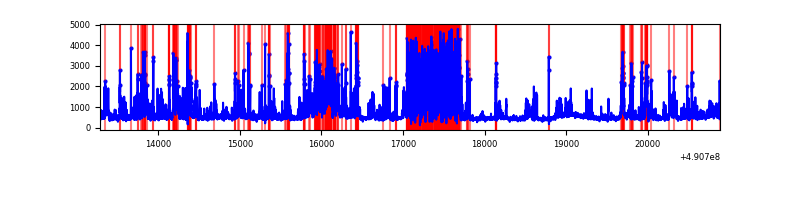 |
Top three noisy pixels from each quadrant. If the there are fewer than three noisy pixels in the level2.evt file, extra rows are filled as -1
| Pixel properties | Quadrant properties | ||||||
|---|---|---|---|---|---|---|---|
| Quadrant | DetID | PixID | Counts | Sigma | Mean | Median | Sigma |
| A | 9 | 191 | 14043182 | 125900.07 | 440 | 430 | 111.5 |
| A | 4 | 249 | 410705 | 3678.31 | 440 | 430 | 111.5 |
| A | 7 | 206 | 397759 | 3562.25 | 440 | 430 | 111.5 |
| B | 1 | 255 | 1770026 | 11195.59 | 735 | 709 | 158.0 |
| B | 10 | 128 | 713553 | 4510.62 | 735 | 709 | 158.0 |
| B | 4 | 81 | 659891 | 4171.06 | 735 | 709 | 158.0 |
| C | 15 | 224 | 2736287 | 14013.28 | 711 | 705 | 195.2 |
| C | 1 | 241 | 1164999 | 5964.2 | 711 | 705 | 195.2 |
| C | 15 | 147 | 435827 | 2228.95 | 711 | 705 | 195.2 |
| D | 15 | 78 | 1074988 | 5158.17 | 738 | 706 | 208.3 |
| D | 12 | 17 | 874436 | 4195.22 | 738 | 706 | 208.3 |
| D | 3 | 224 | 251379 | 1203.61 | 738 | 706 | 208.3 |
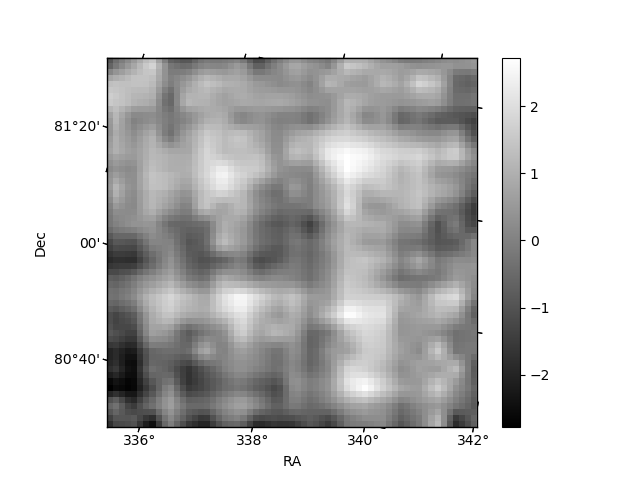
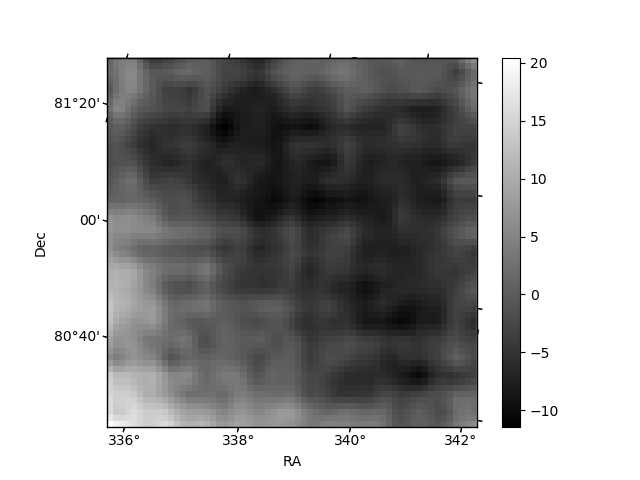
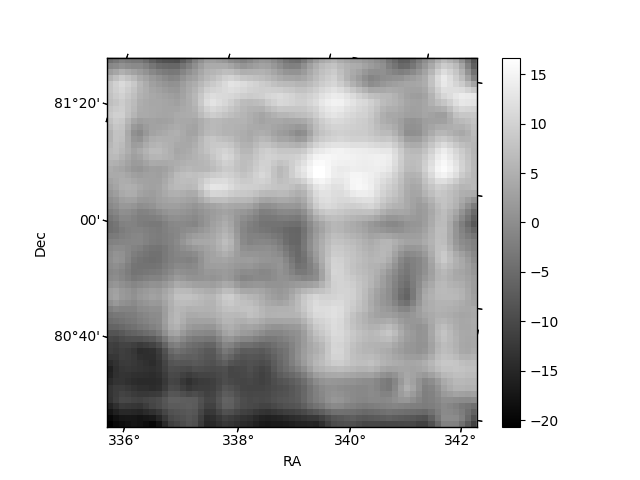
Histogram calculated using DETX and DETY for each event in the final _common_clean file
| Quadrant A | 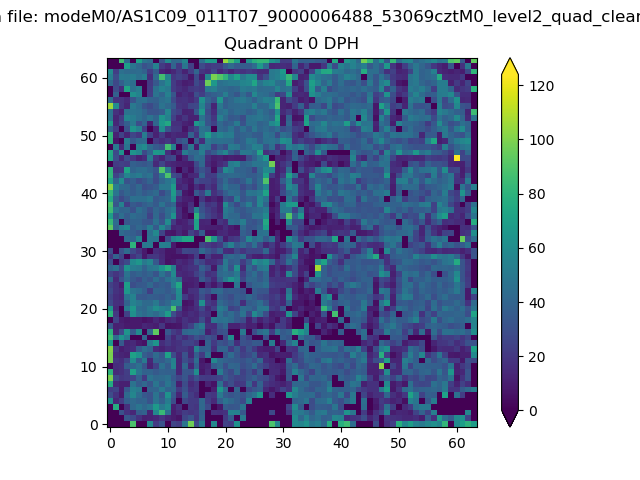 |
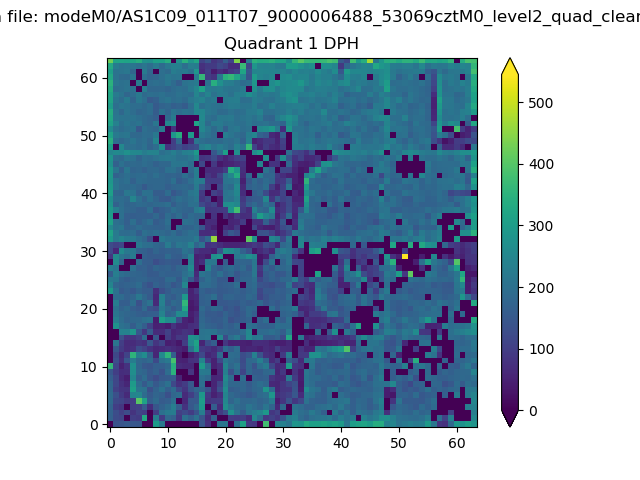 |
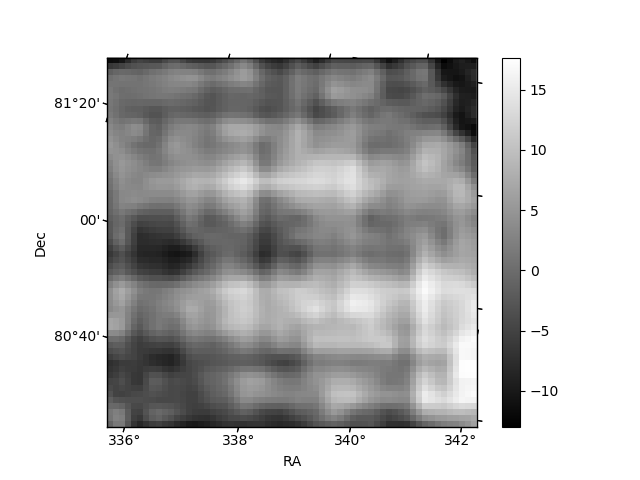
Quadrant B |
|---|---|---|---|
| Quadrant D | 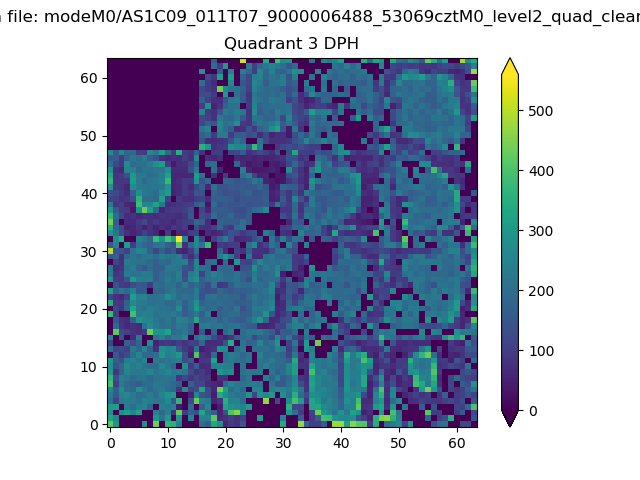 |
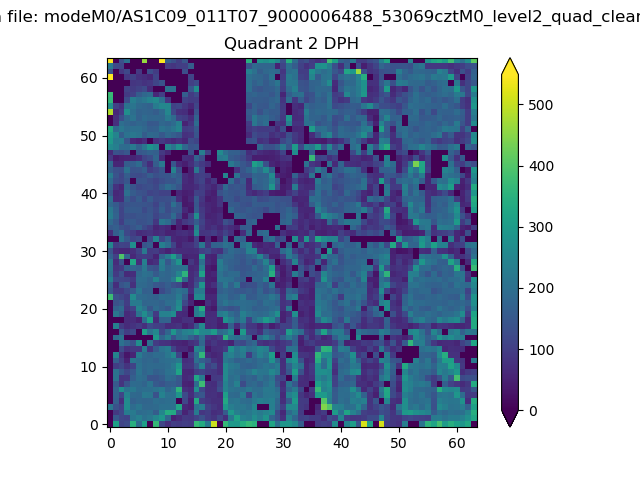 |
Quadrant C |
| Plot type | Count rate plots | Images |
|---|---|---|
| Comparison with Poisson distribution Blue bars denote a histogram of data divided into 1 sec bins. Red curve is a Poisson curve with rate = median count rate of data. |
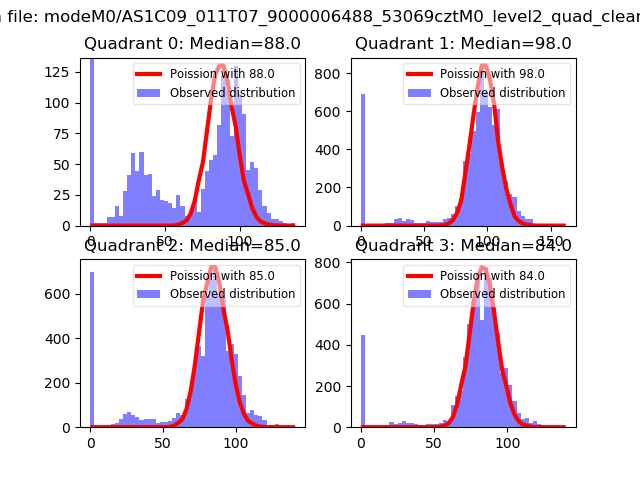 |
 |
| Quadrant-wise count rates Data is divided into 100 sec bins |
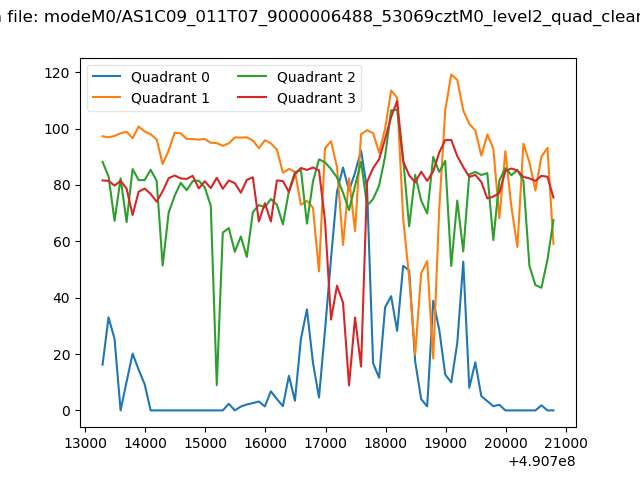 |
|
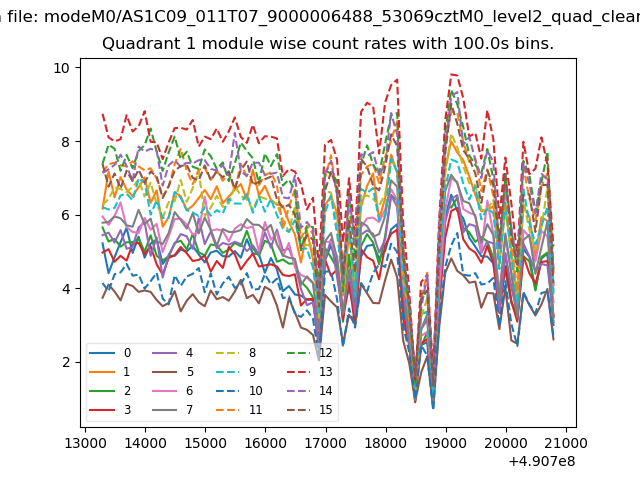
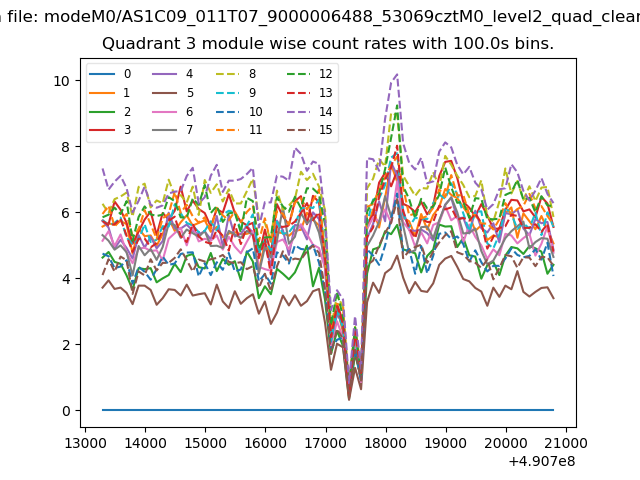
| Module-wise count rates for Quadrant A Data is divided into 100 sec bins |
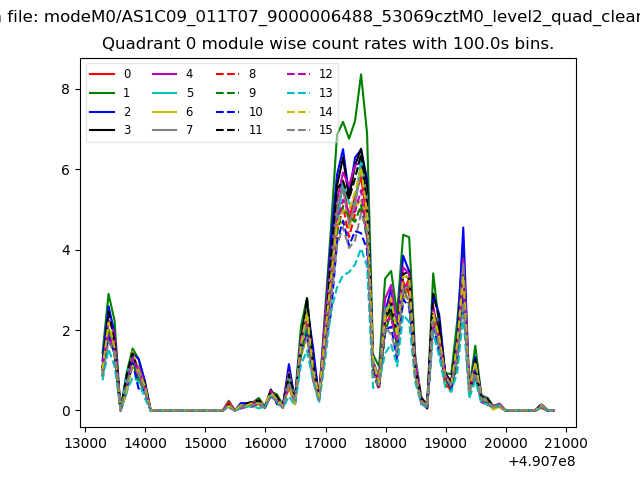 |
 |
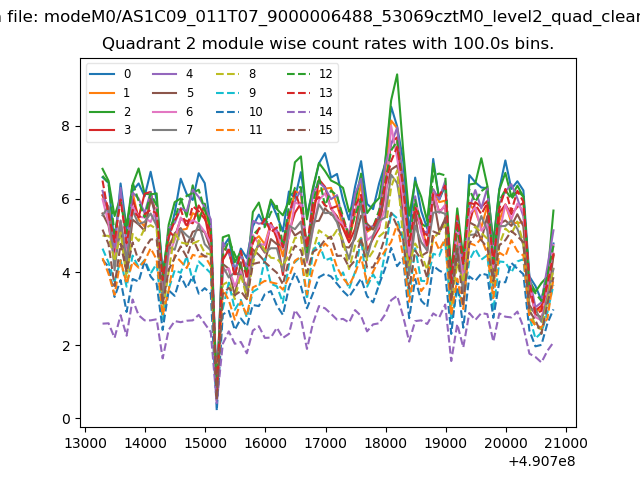
| Module-wise count rates for Quadrant B Data is divided into 100 sec bins |
 |
 |
| Module-wise count rates for Quadrant C Data is divided into 100 sec bins |
 |
 |
| Module-wise count rates for Quadrant D Data is divided into 100 sec bins |
 |
 |
| Parameter | Plot |
|---|---|
| CZT HV Monitor | 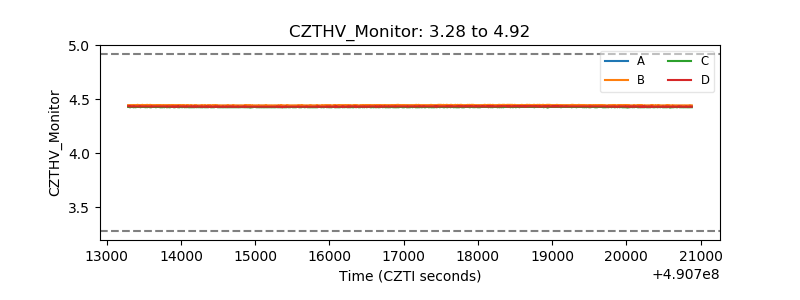 |
| D_VDD | 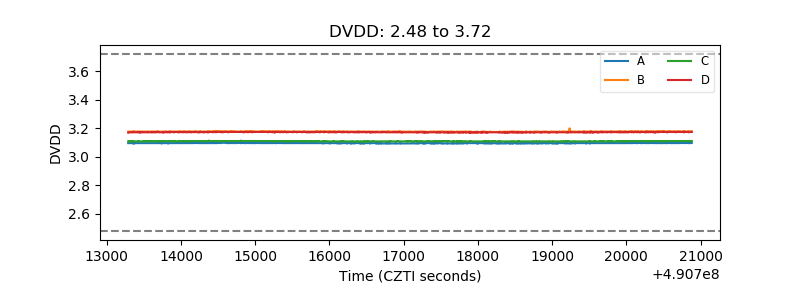 |
| Temperature 1 | 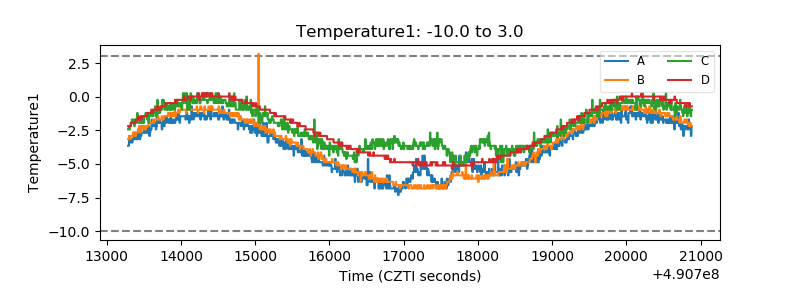 |
| Veto HV Monitor | 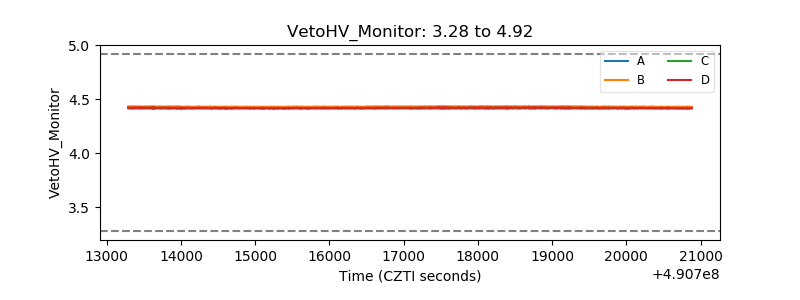 |
| Veto LLD | 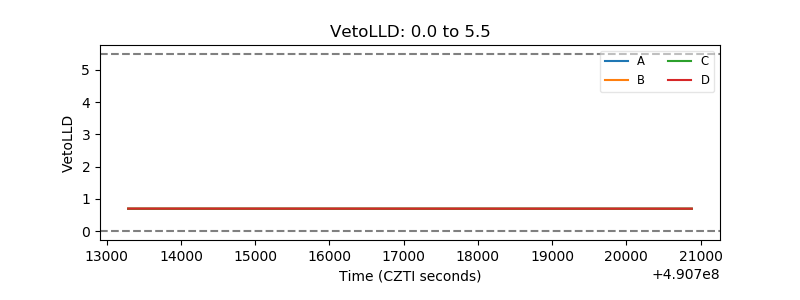 |
| Alpha Counter | 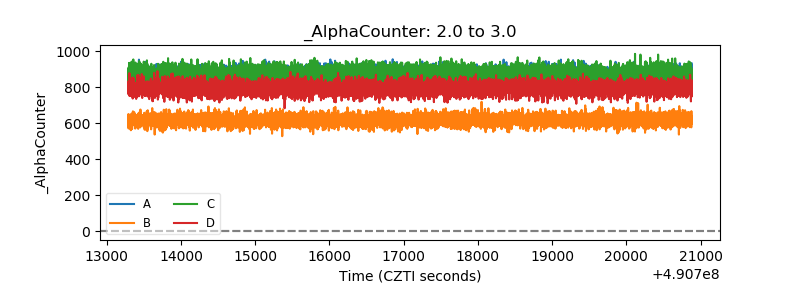 |
| _CPM_Rate | 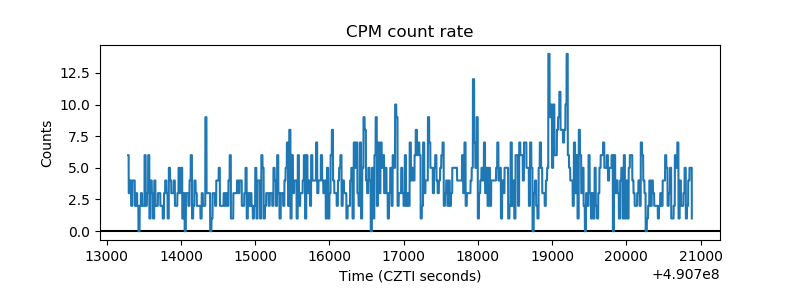 |
| CZT Counter | 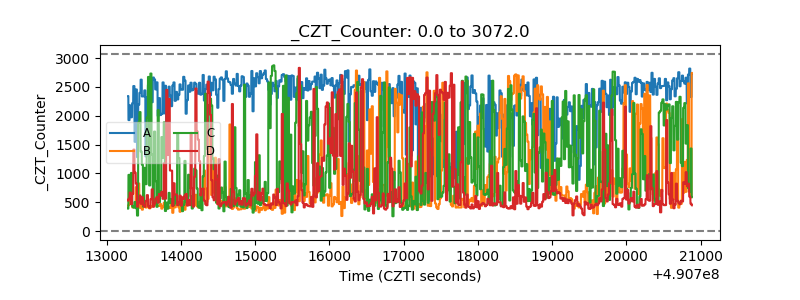 |
| +2.5 Volts monitor | 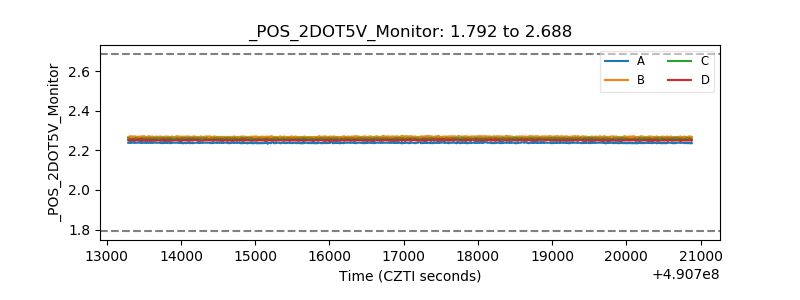 |
| +5 Volts monitor |  |
| _ROLL_ROT | 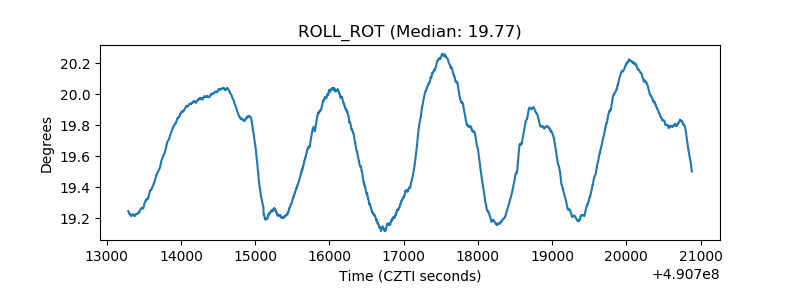 |
| _Roll_DEC | 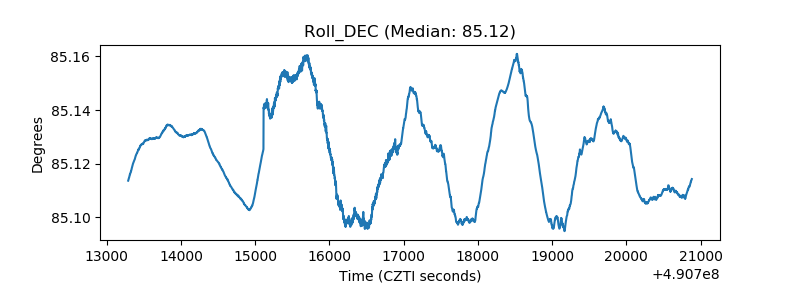 |
| _Roll_RA | 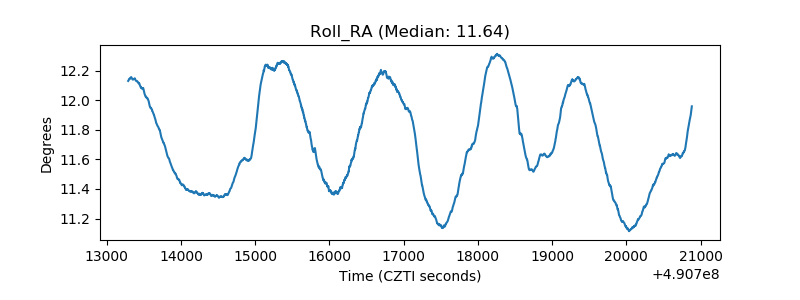 |
| Veto Counter | 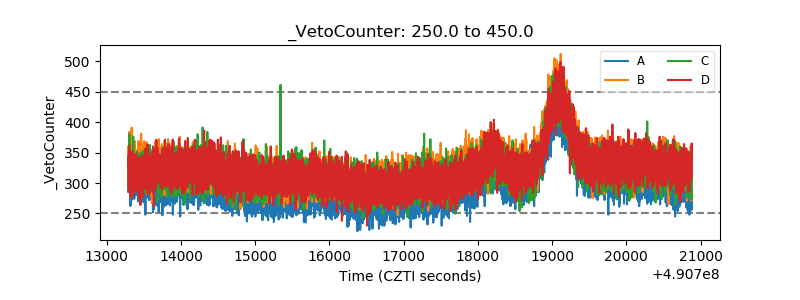 |