| Param | Original file | Final file |
|---|---|---|
| Filename | modeM0/AS1C09_011T07_9000006488_53072cztM0_level2.fits | modeM0/AS1C09_011T07_9000006488_53072cztM0_level2_quad_clean.evt |
| Size (bytes) | 2,615,411,520 | 188,409,600 |
| Size | 2.4 GB | 179.7 MB |
| Events in quadrant A | 42,234,514 | 255,664 |
| Events in quadrant B | 18,666,288 | 1,470,609 |
| Events in quadrant C | 20,670,441 | 1,316,541 |
| Events in quadrant D | 13,855,780 | 1,417,953 |
| Mode SS | |||
|---|---|---|---|
| Quadrant | BADHDUFLAG | Total packets | Discarded packets |
| A | 0 | 366 | 0 |
| B | 0 | 366 | 0 |
| C | 0 | 366 | 0 |
| D | 0 | 366 | 0 |
| Mode M9 | |||
|---|---|---|---|
| Quadrant | BADHDUFLAG | Total packets | Discarded packets |
| A | 0 | 14 | 0 |
| B | 0 | 14 | 0 |
| C | 0 | 14 | 0 |
| D | 0 | 14 | 0 |
| Mode M0 | |||
|---|---|---|---|
| Quadrant | BADHDUFLAG | Total packets | Discarded packets |
| A | 0 | 137412 | 4 |
| B | 0 | 68106 | 4 |
| C | 0 | 73999 | 4 |
| D | 0 | 53913 | 4 |
| Quadrant | Total seconds | Saturated seconds | Saturation percentage |
|---|---|---|---|
| A | 18020 | 15810 | 87.735849% |
| B | 18021 | 3231 | 17.929083% |
| C | 18021 | 3434 | 19.055546% |
| D | 18021 | 1253 | 6.952999% |
Noise dominated data is calculated using 1-second bins in cleaned event files. If a bin has >2000 counts, and if more than 50% of those come from <1% of pixels, then it is considered to be noise-dominated and hence unusable.
| Quadrant | # 1 sec bins | Bins with >0 counts | Bins with >2000 counts | High rate bins dominated by noise | Noise dominated (total time) | Noise dominated (detector-on time) | Marked lightcurve |
|---|---|---|---|---|---|---|---|
| A | 19434 | 18022 | 13529 | 13529 | 69.62% | 75.07% | 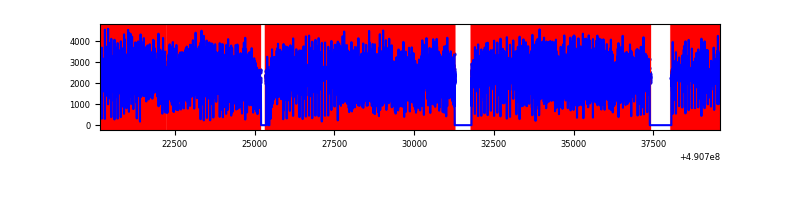 |
| B | 19436 | 18025 | 2347 | 2347 | 12.08% | 13.02% | 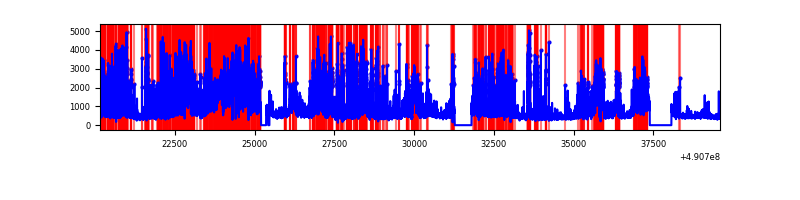 |
| C | 19436 | 18025 | 2765 | 2765 | 14.23% | 15.34% | 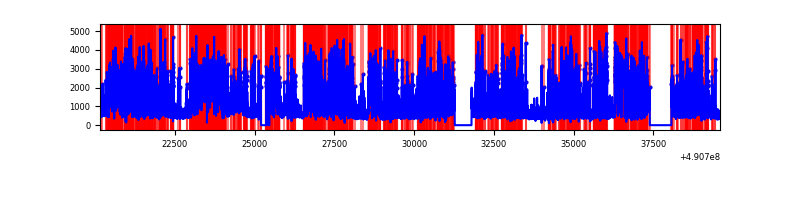 |
| D | 19436 | 18025 | 995 | 995 | 5.12% | 5.52% | 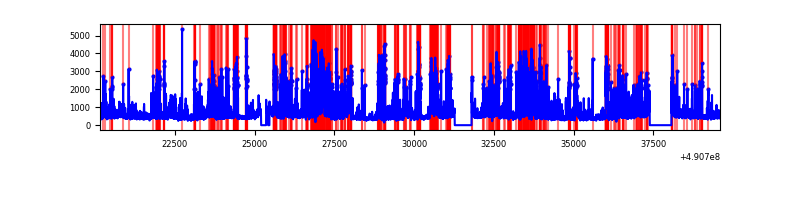 |
Top three noisy pixels from each quadrant. If the there are fewer than three noisy pixels in the level2.evt file, extra rows are filled as -1
| Pixel properties | Quadrant properties | ||||||
|---|---|---|---|---|---|---|---|
| Quadrant | DetID | PixID | Counts | Sigma | Mean | Median | Sigma |
| A | 9 | 191 | 33851428 | 140894.4 | 936 | 914 | 240.3 |
| A | 13 | 248 | 2088819 | 8690.39 | 936 | 914 | 240.3 |
| A | 7 | 206 | 1344563 | 5592.61 | 936 | 914 | 240.3 |
| B | 1 | 255 | 3639930 | 10036.8 | 1720 | 1659 | 362.5 |
| B | 4 | 81 | 2676748 | 7379.7 | 1720 | 1659 | 362.5 |
| B | 10 | 63 | 2007183 | 5532.59 | 1720 | 1659 | 362.5 |
| C | 15 | 224 | 7543901 | 16122.17 | 1690 | 1669 | 467.8 |
| C | 9 | 38 | 1738120 | 3711.81 | 1690 | 1669 | 467.8 |
| C | 12 | 254 | 1090442 | 2327.34 | 1690 | 1669 | 467.8 |
| D | 12 | 17 | 2652964 | 5191.0 | 1785 | 1704 | 510.7 |
| D | 3 | 144 | 670328 | 1309.12 | 1785 | 1704 | 510.7 |
| D | 1 | 241 | 596360 | 1164.3 | 1785 | 1704 | 510.7 |
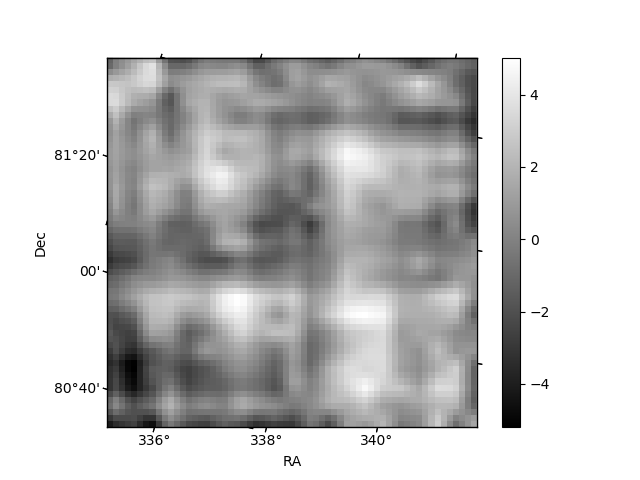
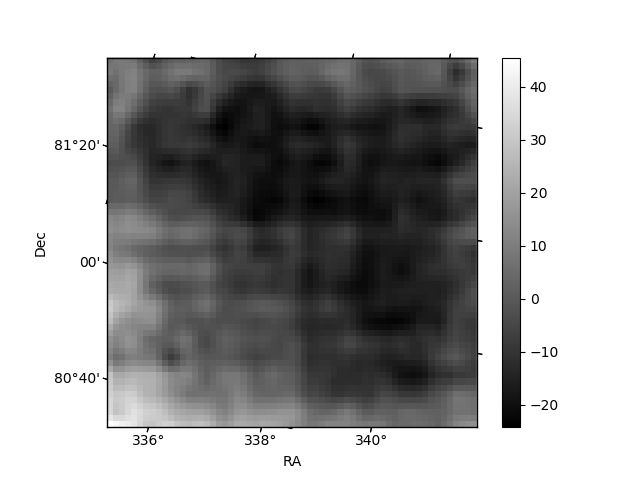
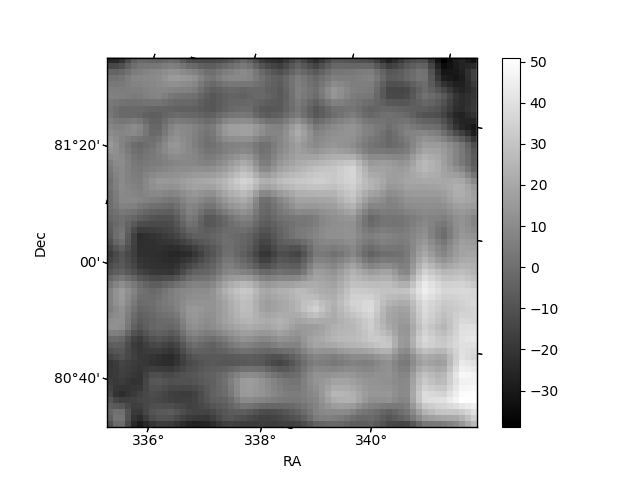
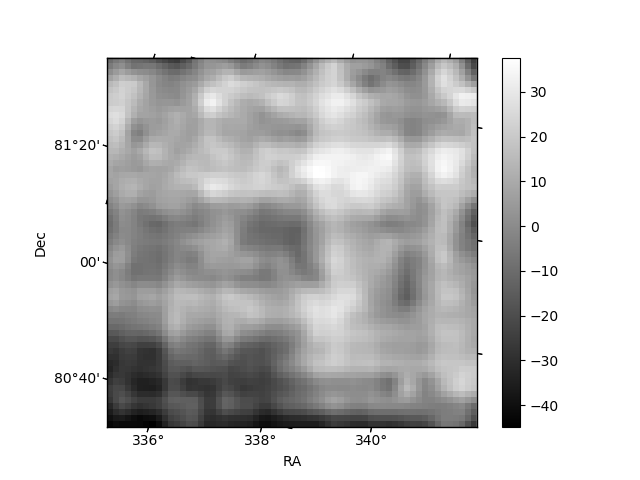
Histogram calculated using DETX and DETY for each event in the final _common_clean file
| Quadrant A | 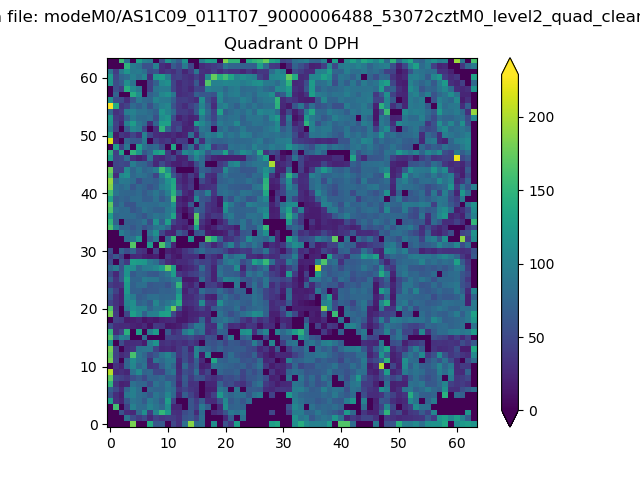 |
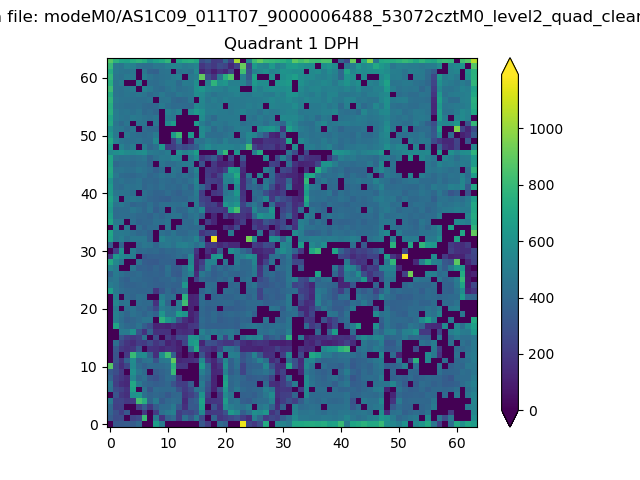 |
Quadrant B |
|---|---|---|---|
| Quadrant D | 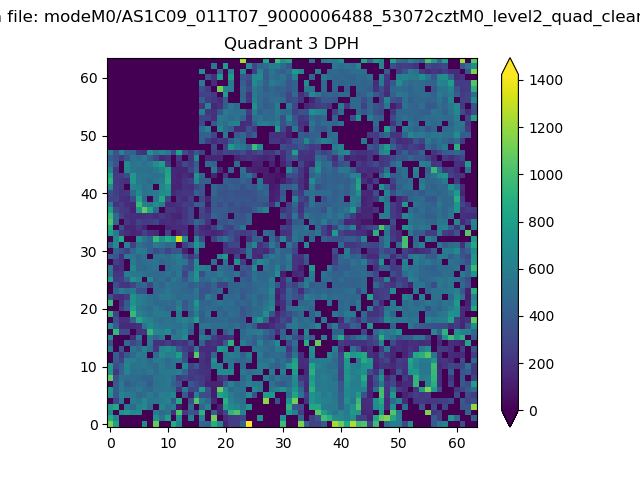 |
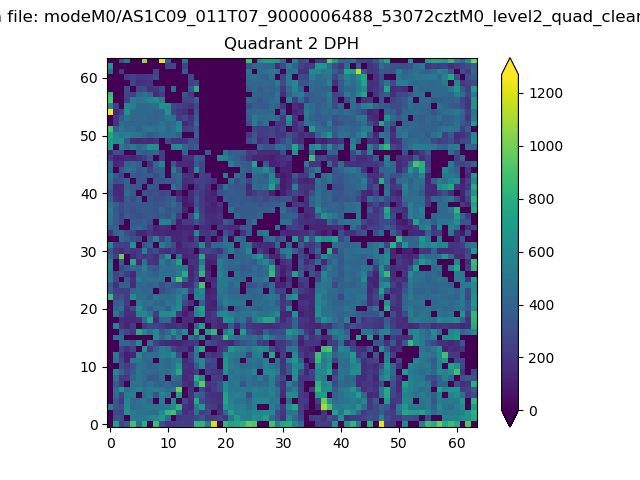 |
Quadrant C |
| Plot type | Count rate plots | Images |
|---|---|---|
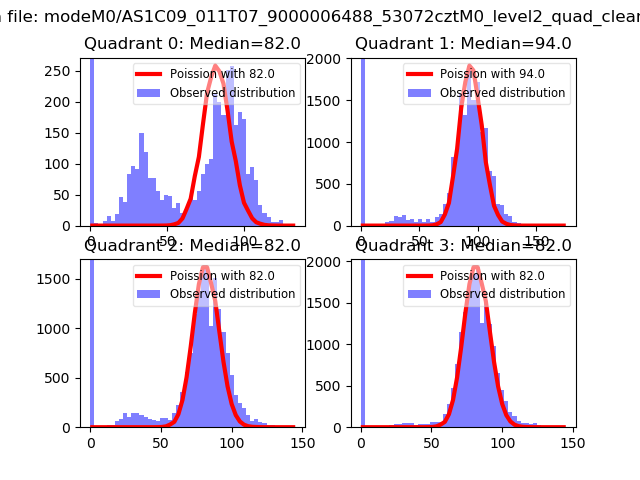
| Comparison with Poisson distribution Blue bars denote a histogram of data divided into 1 sec bins. Red curve is a Poisson curve with rate = median count rate of data. |
 |
 |
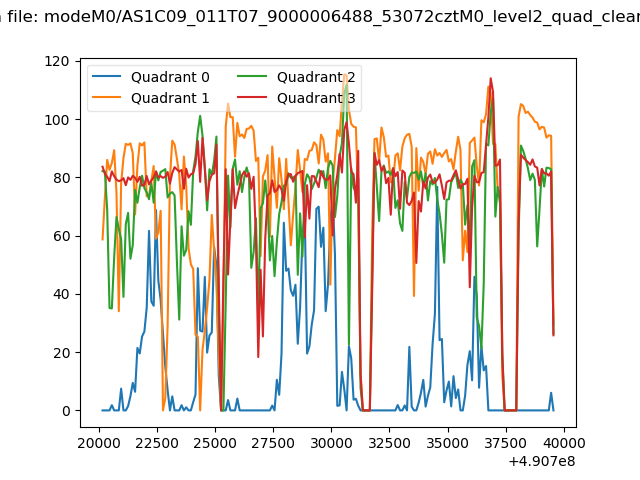
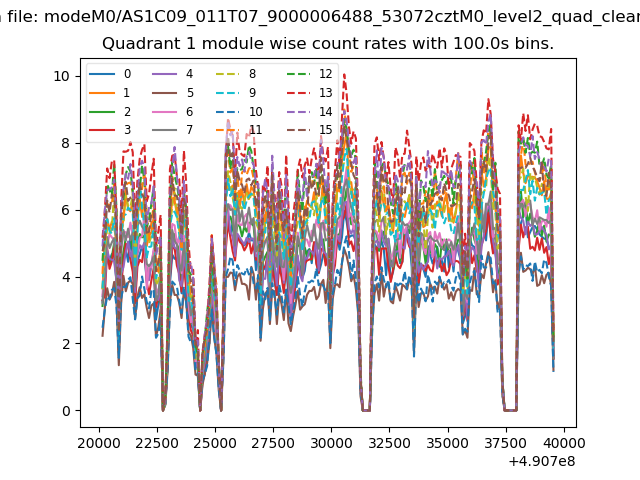
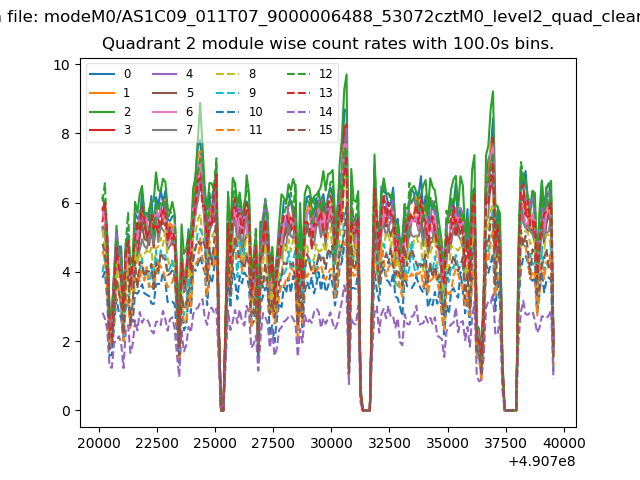
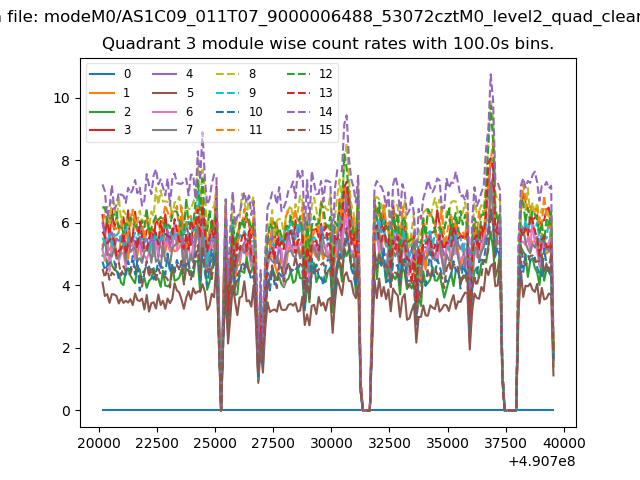
| Quadrant-wise count rates Data is divided into 100 sec bins |
 |
|
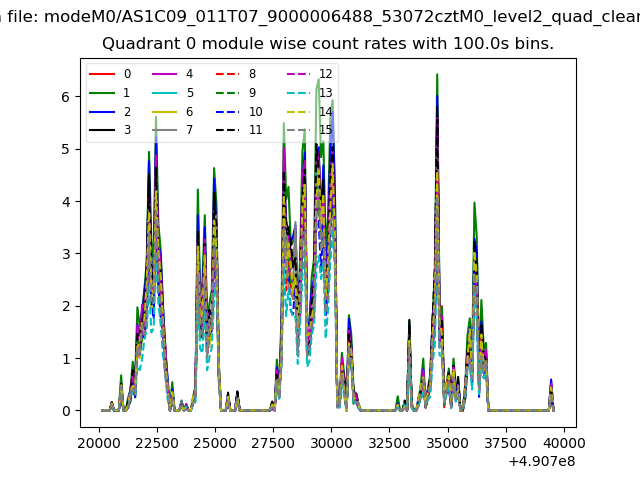
| Module-wise count rates for Quadrant A Data is divided into 100 sec bins |
 |
 |
| Module-wise count rates for Quadrant B Data is divided into 100 sec bins |
 |
 |
| Module-wise count rates for Quadrant C Data is divided into 100 sec bins |
 |
 |
| Module-wise count rates for Quadrant D Data is divided into 100 sec bins |
 |
 |
| Parameter | Plot |
|---|---|
| CZT HV Monitor | 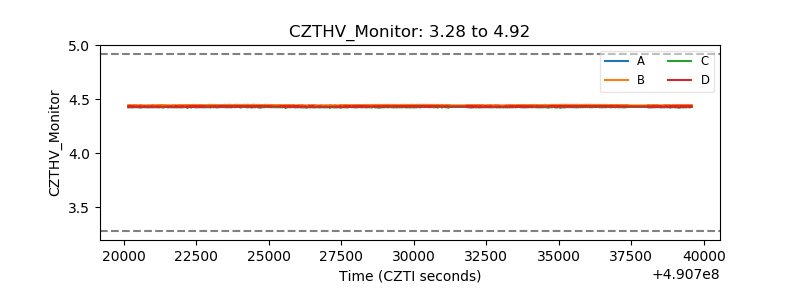 |
| D_VDD | 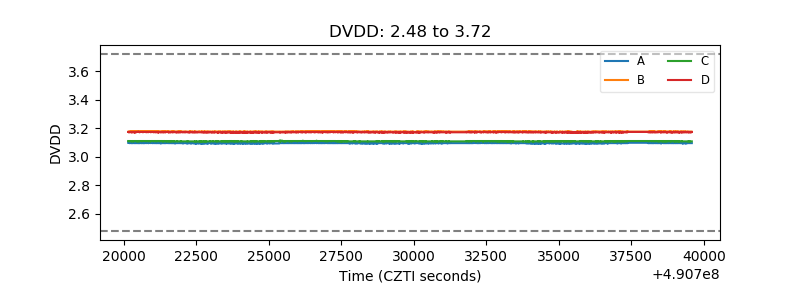 |
| Temperature 1 | 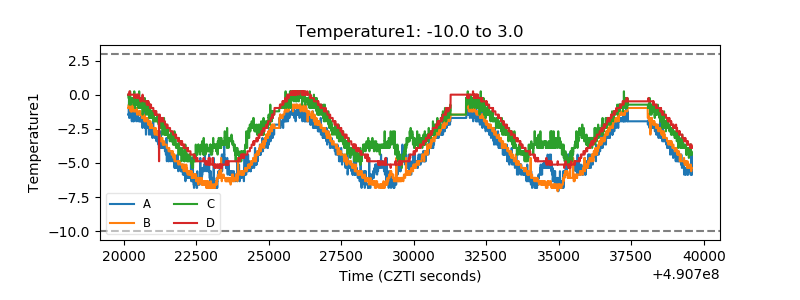 |
| Veto HV Monitor | 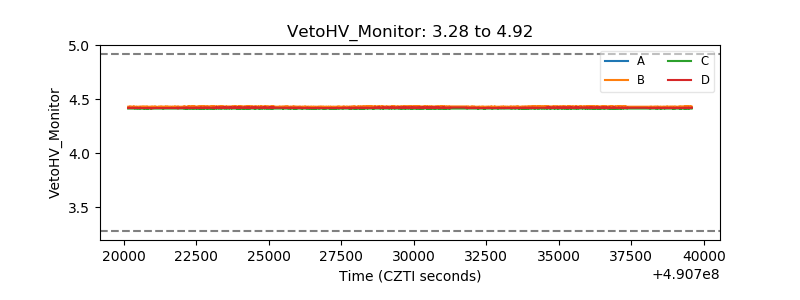 |
| Veto LLD | 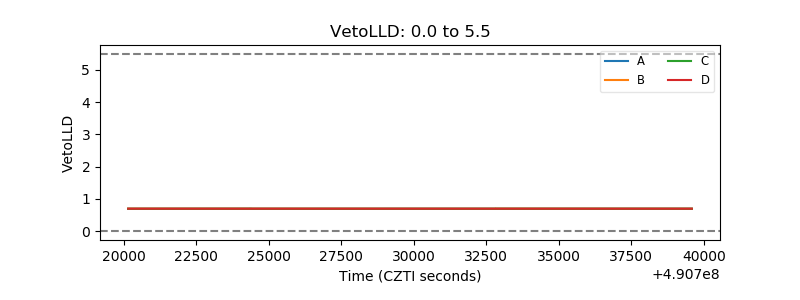 |
| Alpha Counter |  |
| _CPM_Rate | 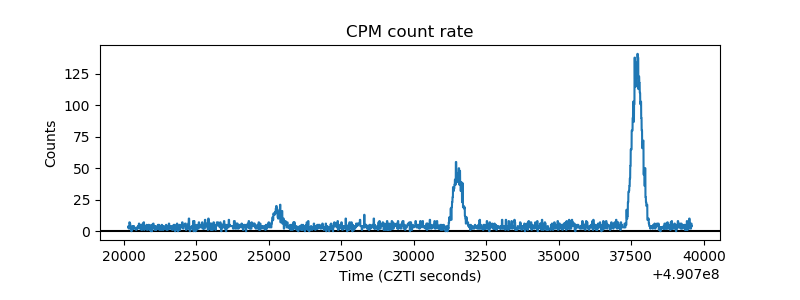 |
| CZT Counter | 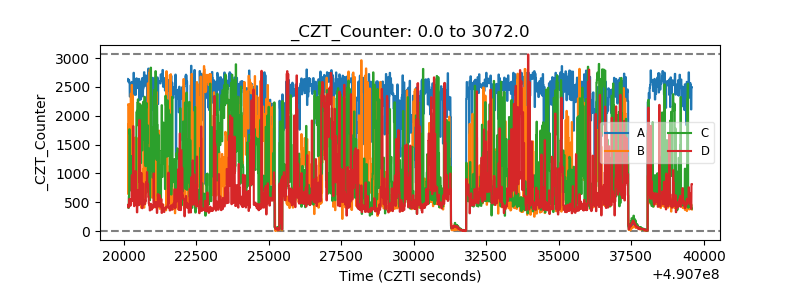 |
| +2.5 Volts monitor |  |
| +5 Volts monitor |  |
| _ROLL_ROT | 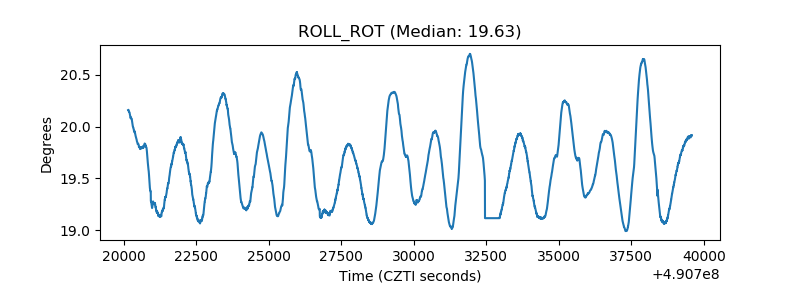 |
| _Roll_DEC | 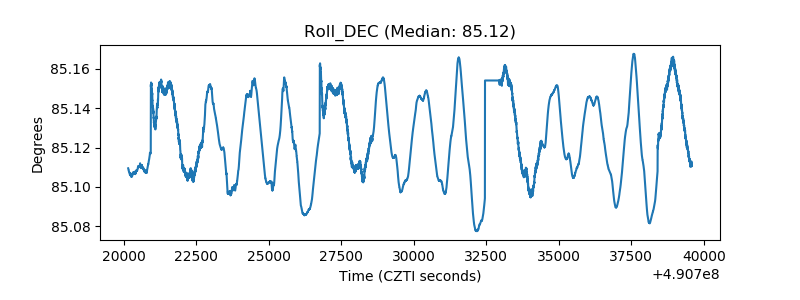 |
| _Roll_RA | 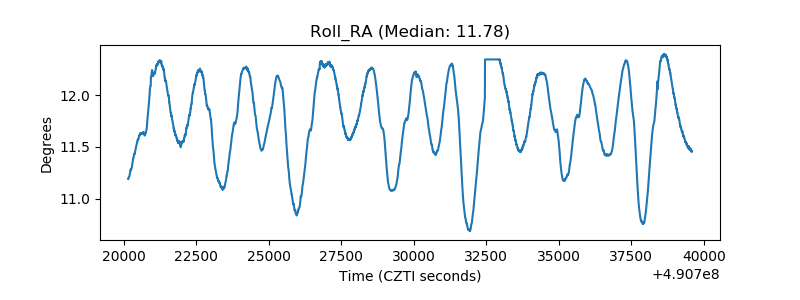 |
| Veto Counter | 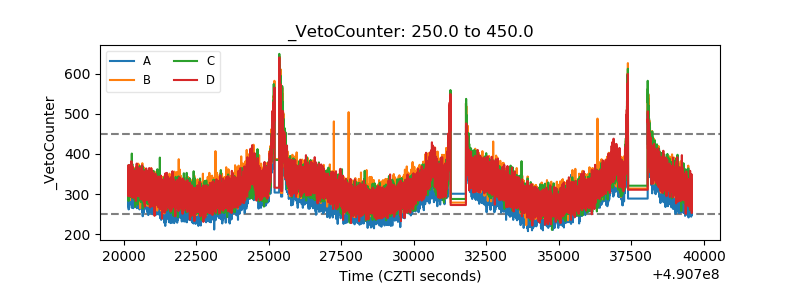 |