| Param | Original file | Final file |
|---|---|---|
| Filename | modeM0/AS1C09_011T07_9000006488_53073cztM0_level2.fits | modeM0/AS1C09_011T07_9000006488_53073cztM0_level2_quad_clean.evt |
| Size (bytes) | 900,967,680 | 78,217,920 |
| Size | 859.2 MB | 74.6 MB |
| Events in quadrant A | 16,458,332 | 85,681 |
| Events in quadrant B | 3,624,976 | 697,670 |
| Events in quadrant C | 7,667,170 | 525,941 |
| Events in quadrant D | 5,065,024 | 577,325 |
| Mode SS | |||
|---|---|---|---|
| Quadrant | BADHDUFLAG | Total packets | Discarded packets |
| A | 0 | 140 | 0 |
| B | 0 | 140 | 0 |
| C | 0 | 140 | 0 |
| D | 0 | 140 | 0 |
| Mode M9 | |||
|---|---|---|---|
| Quadrant | BADHDUFLAG | Total packets | Discarded packets |
| A | 0 | 13 | 0 |
| B | 0 | 13 | 0 |
| C | 0 | 14 | 0 |
| D | 0 | 14 | 0 |
| Mode M0 | |||
|---|---|---|---|
| Quadrant | BADHDUFLAG | Total packets | Discarded packets |
| A | 0 | 53475 | 2 |
| B | 0 | 15790 | 2 |
| C | 0 | 27667 | 8 |
| D | 0 | 19928 | 2 |
| Quadrant | Total seconds | Saturated seconds | Saturation percentage |
|---|---|---|---|
| A | 6909 | 6164 | 89.216963% |
| B | 6909 | 85 | 1.230279% |
| C | 6908 | 1341 | 19.412276% |
| D | 6908 | 441 | 6.383903% |
Noise dominated data is calculated using 1-second bins in cleaned event files. If a bin has >2000 counts, and if more than 50% of those come from <1% of pixels, then it is considered to be noise-dominated and hence unusable.
| Quadrant | # 1 sec bins | Bins with >0 counts | Bins with >2000 counts | High rate bins dominated by noise | Noise dominated (total time) | Noise dominated (detector-on time) | Marked lightcurve |
|---|---|---|---|---|---|---|---|
| A | 7774 | 6909 | 5456 | 5456 | 70.18% | 78.97% | 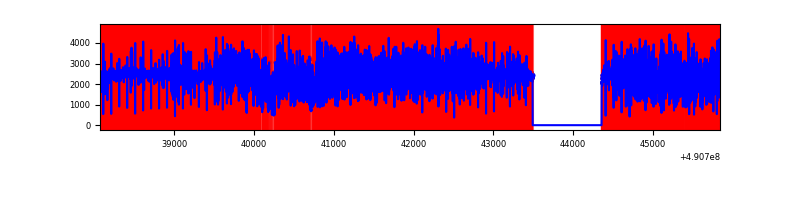 |
| B | 7774 | 6910 | 30 | 30 | 0.39% | 0.43% | 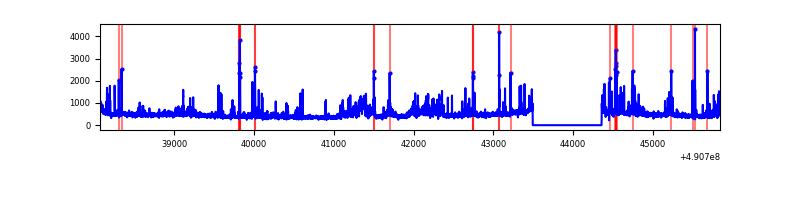 |
| C | 7773 | 6909 | 1153 | 1153 | 14.83% | 16.69% | 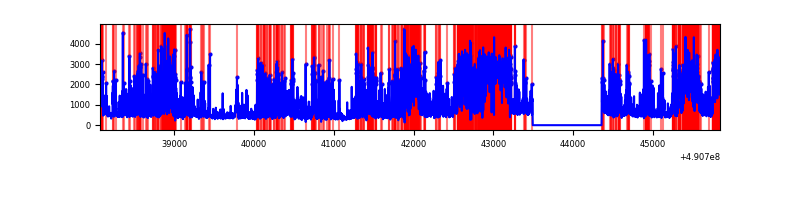 |
| D | 7773 | 6909 | 322 | 322 | 4.14% | 4.66% | 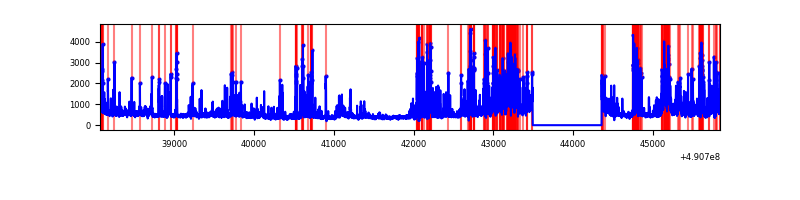 |
Top three noisy pixels from each quadrant. If the there are fewer than three noisy pixels in the level2.evt file, extra rows are filled as -1
| Pixel properties | Quadrant properties | ||||||
|---|---|---|---|---|---|---|---|
| Quadrant | DetID | PixID | Counts | Sigma | Mean | Median | Sigma |
| A | 9 | 191 | 14582351 | 170764.17 | 337 | 330 | 85.4 |
| A | 7 | 206 | 186245 | 2177.18 | 337 | 330 | 85.4 |
| A | 0 | 8 | 71906 | 838.2 | 337 | 330 | 85.4 |
| B | 4 | 81 | 364074 | 2387.77 | 714 | 689 | 152.2 |
| B | 10 | 247 | 156717 | 1025.25 | 714 | 689 | 152.2 |
| B | 10 | 128 | 72131 | 469.44 | 714 | 689 | 152.2 |
| C | 15 | 224 | 2514668 | 14101.07 | 648 | 641 | 178.3 |
| C | 1 | 241 | 1895354 | 10627.36 | 648 | 641 | 178.3 |
| C | 13 | 3 | 153259 | 856.03 | 648 | 641 | 178.3 |
| D | 12 | 17 | 1212606 | 6111.73 | 690 | 660 | 198.3 |
| D | 11 | 245 | 214115 | 1076.43 | 690 | 660 | 198.3 |
| D | 3 | 224 | 106668 | 534.59 | 690 | 660 | 198.3 |
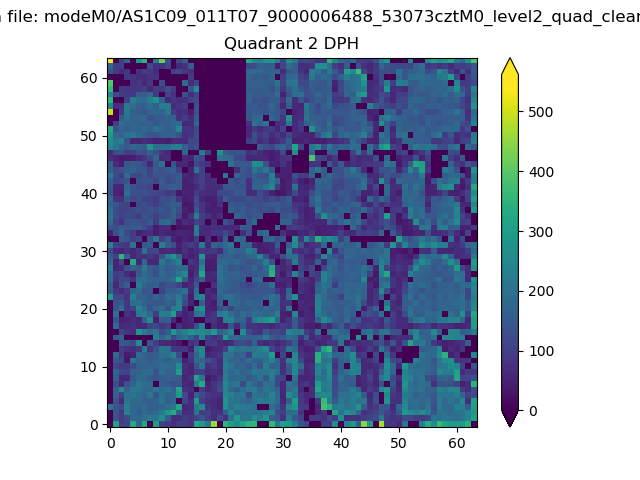
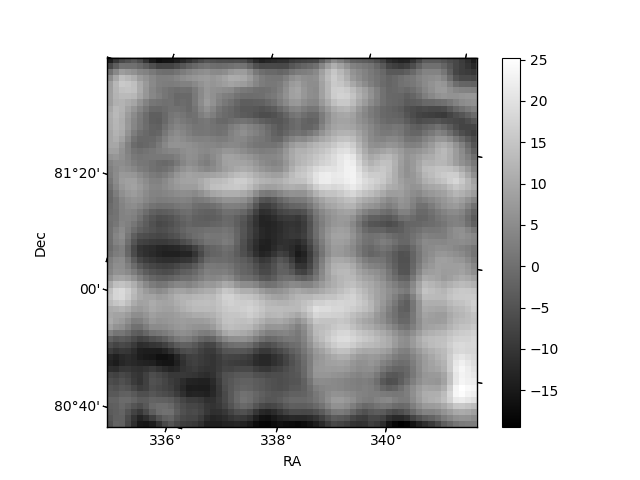
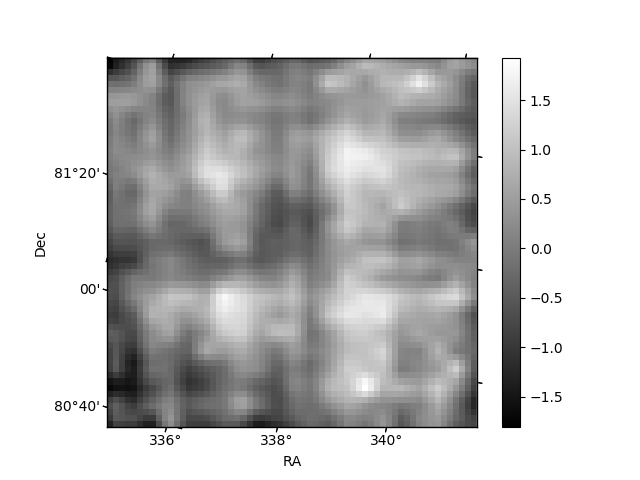
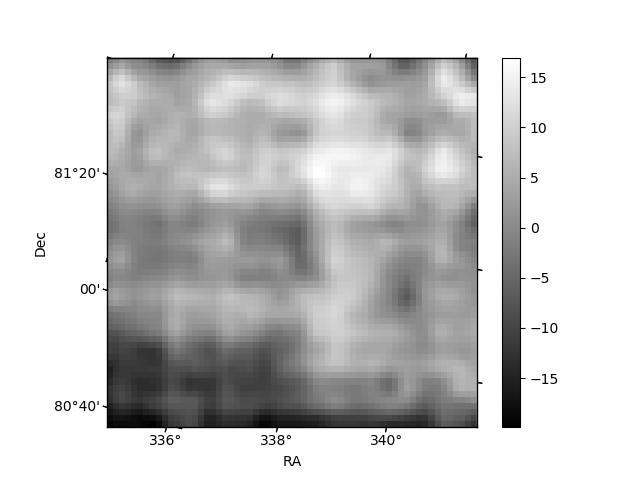
Histogram calculated using DETX and DETY for each event in the final _common_clean file
| Quadrant A | 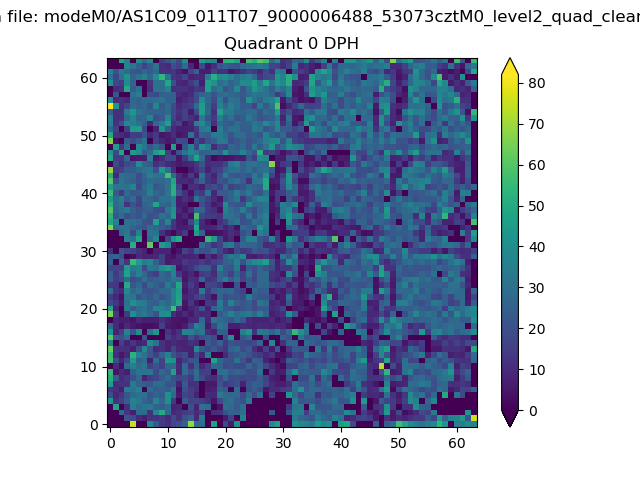 |
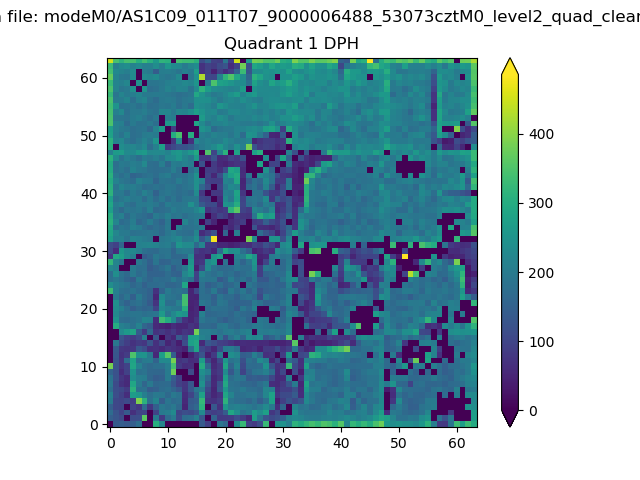 |
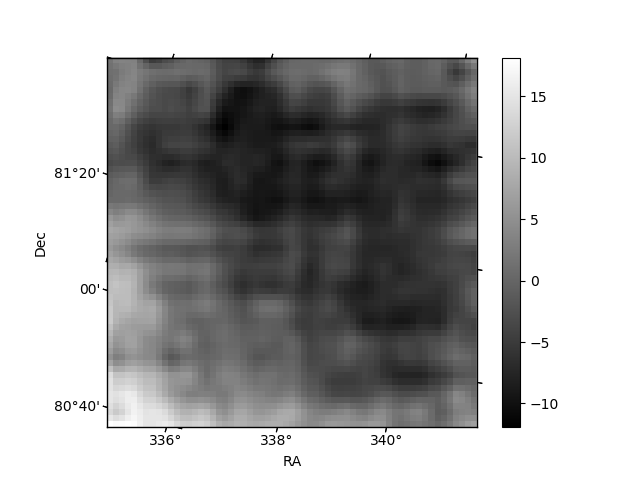
Quadrant B |
|---|---|---|---|
| Quadrant D | 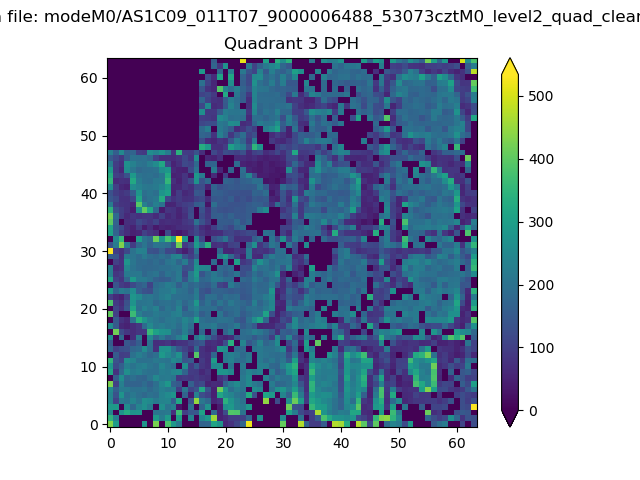 |
 |
Quadrant C |
| Plot type | Count rate plots | Images |
|---|---|---|
| Comparison with Poisson distribution Blue bars denote a histogram of data divided into 1 sec bins. Red curve is a Poisson curve with rate = median count rate of data. |
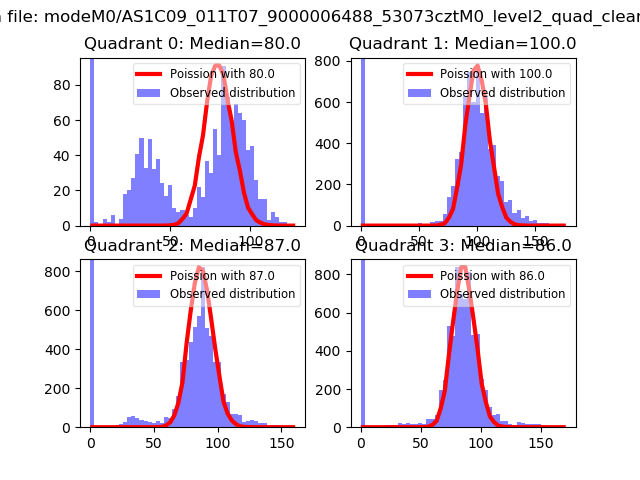 |
 |
| Quadrant-wise count rates Data is divided into 100 sec bins |
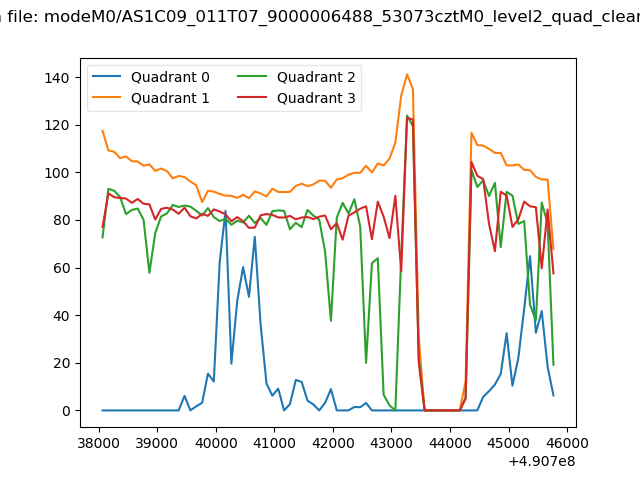 |
|
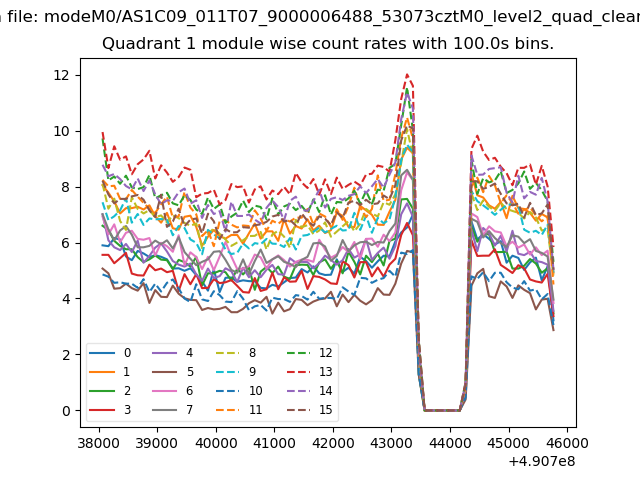
| Module-wise count rates for Quadrant A Data is divided into 100 sec bins |
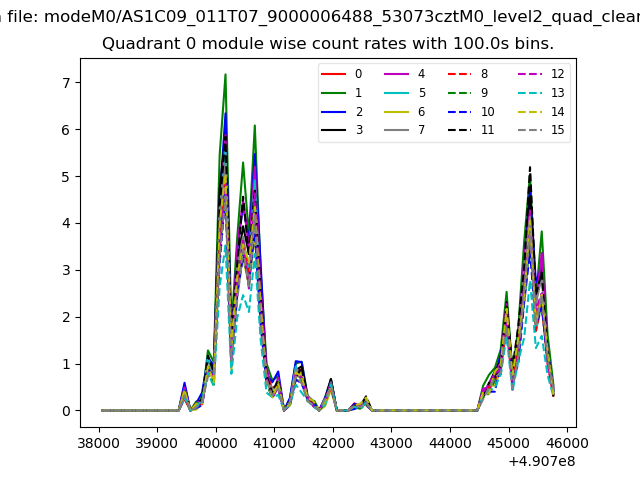 |
 |
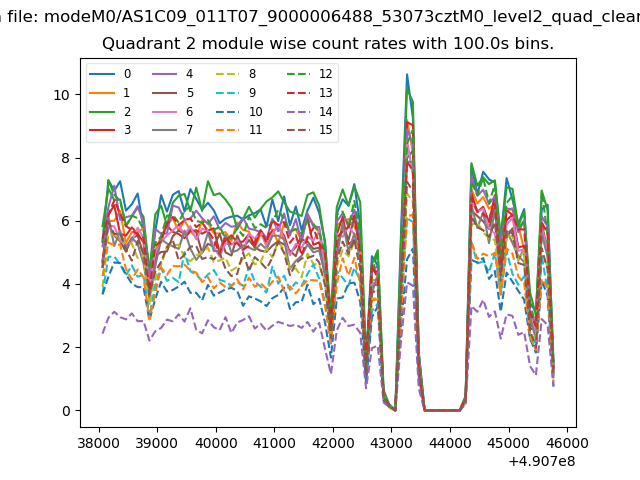
| Module-wise count rates for Quadrant B Data is divided into 100 sec bins |
 |
 |
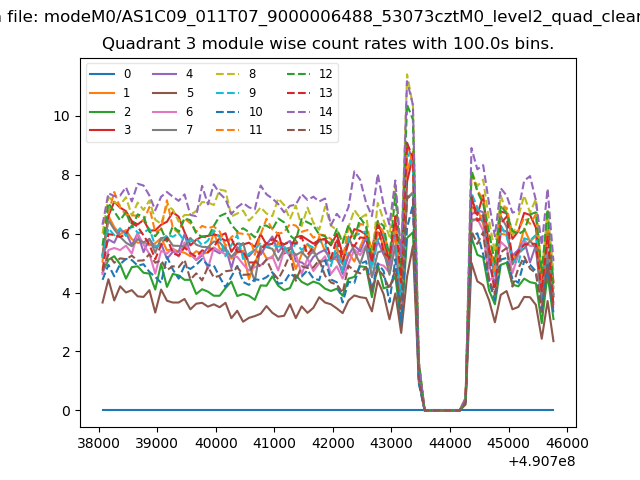
| Module-wise count rates for Quadrant C Data is divided into 100 sec bins |
 |
 |
| Module-wise count rates for Quadrant D Data is divided into 100 sec bins |
 |
 |
| Parameter | Plot |
|---|---|
| CZT HV Monitor | 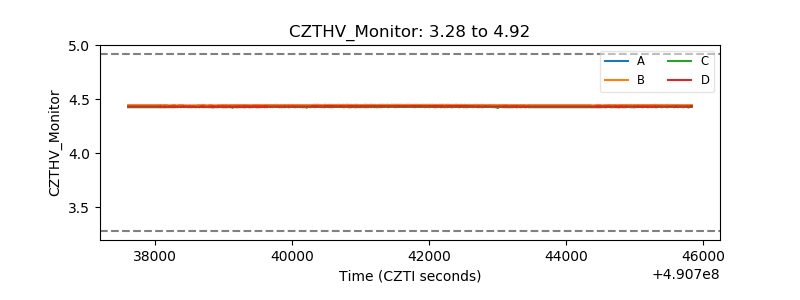 |
| D_VDD | 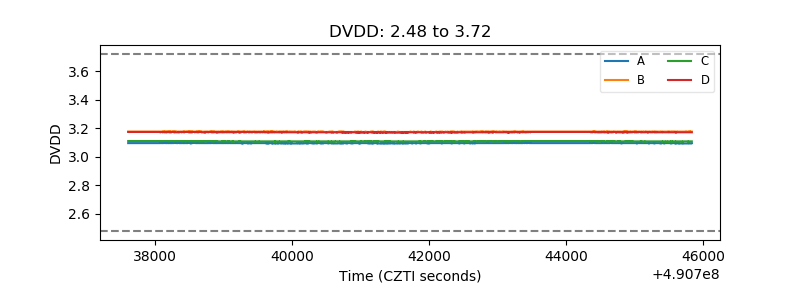 |
| Temperature 1 | 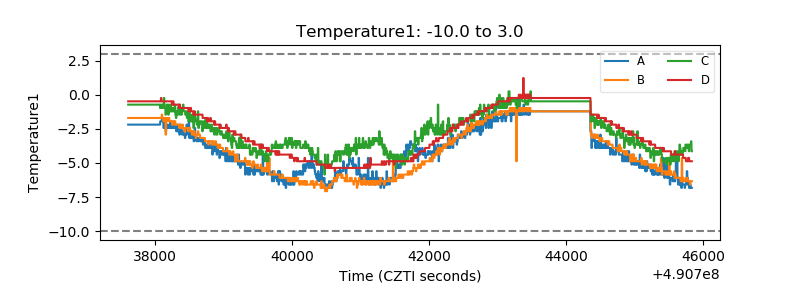 |
| Veto HV Monitor | 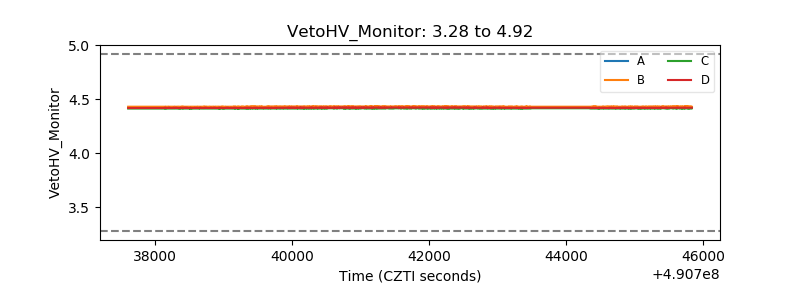 |
| Veto LLD | 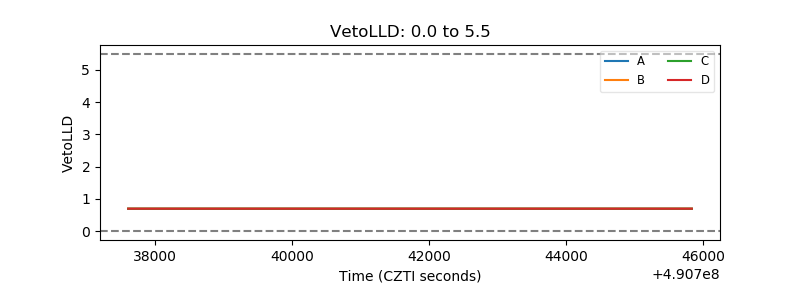 |
| Alpha Counter | 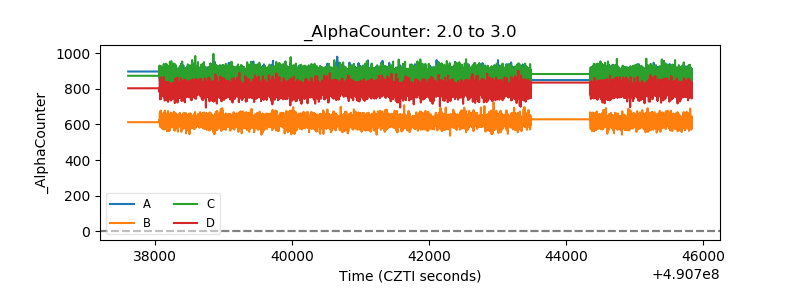 |
| _CPM_Rate | 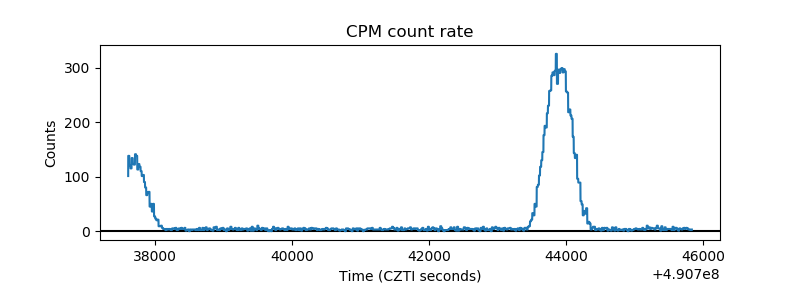 |
| CZT Counter | 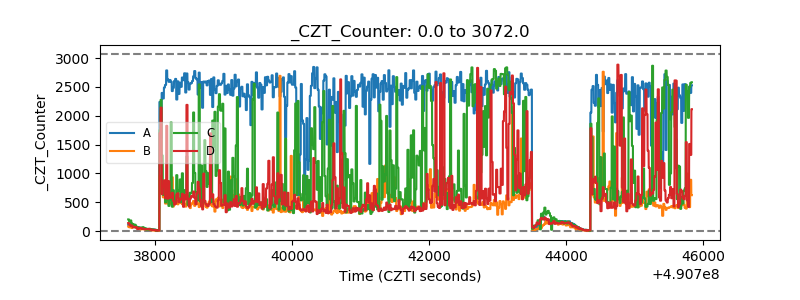 |
| +2.5 Volts monitor |  |
| +5 Volts monitor |  |
| _ROLL_ROT | 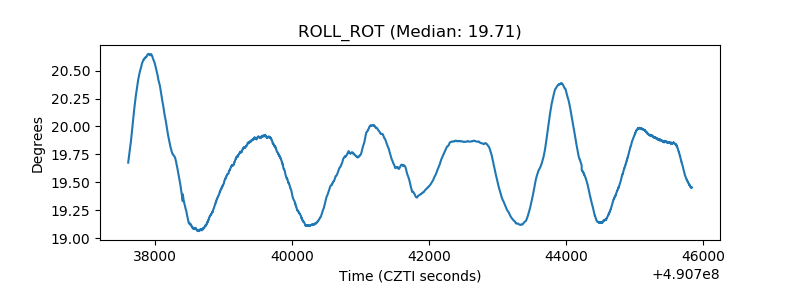 |
| _Roll_DEC | 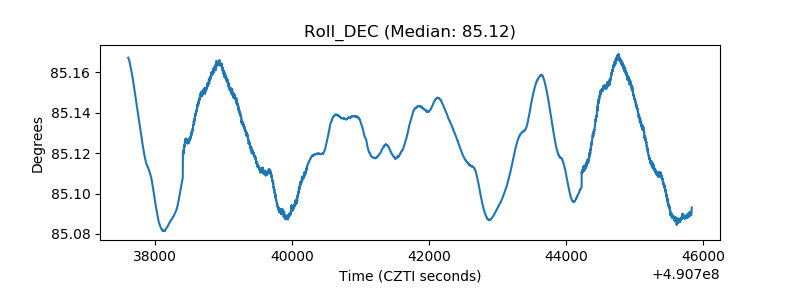 |
| _Roll_RA | 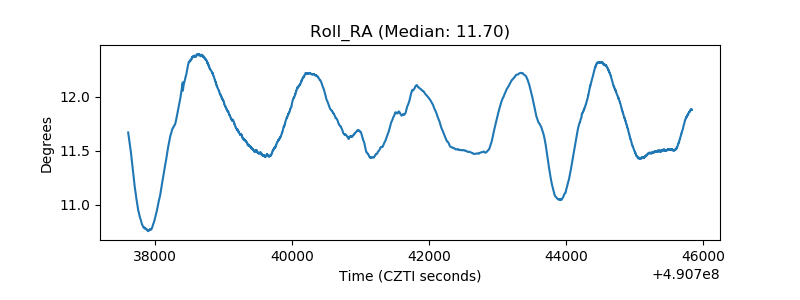 |
| Veto Counter | 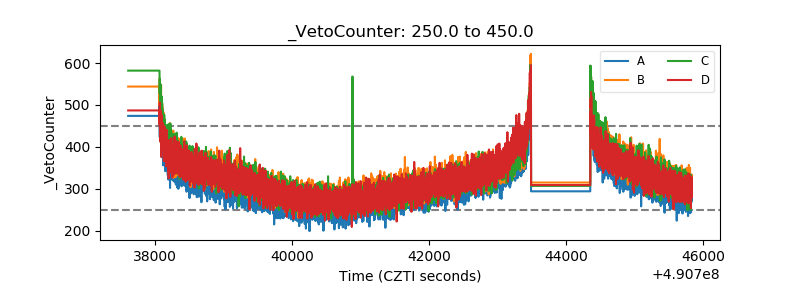 |