| Param | Original file | Final file |
|---|---|---|
| Filename | modeM0/AS1C09_011T07_9000006488_53075cztM0_level2.fits | modeM0/AS1C09_011T07_9000006488_53075cztM0_level2_quad_clean.evt |
| Size (bytes) | 903,288,960 | 67,446,720 |
| Size | 861.4 MB | 64.3 MB |
| Events in quadrant A | 14,830,853 | 90,690 |
| Events in quadrant B | 3,452,254 | 624,930 |
| Events in quadrant C | 9,936,322 | 371,884 |
| Events in quadrant D | 4,735,057 | 519,489 |
| Mode SS | |||
|---|---|---|---|
| Quadrant | BADHDUFLAG | Total packets | Discarded packets |
| A | 0 | 126 | 0 |
| B | 0 | 126 | 0 |
| C | 0 | 126 | 0 |
| D | 0 | 126 | 0 |
| Mode M9 | |||
|---|---|---|---|
| Quadrant | BADHDUFLAG | Total packets | Discarded packets |
| A | 0 | 11 | 0 |
| B | 0 | 11 | 0 |
| C | 0 | 11 | 0 |
| D | 0 | 11 | 0 |
| Mode M0 | |||
|---|---|---|---|
| Quadrant | BADHDUFLAG | Total packets | Discarded packets |
| A | 0 | 48241 | 1 |
| B | 0 | 14769 | 1 |
| C | 0 | 33680 | 1 |
| D | 0 | 18548 | 1 |
| Quadrant | Total seconds | Saturated seconds | Saturation percentage |
|---|---|---|---|
| A | 6231 | 5523 | 88.637458% |
| B | 6231 | 89 | 1.428342% |
| C | 6232 | 2437 | 39.104621% |
| D | 6232 | 361 | 5.792683% |
Noise dominated data is calculated using 1-second bins in cleaned event files. If a bin has >2000 counts, and if more than 50% of those come from <1% of pixels, then it is considered to be noise-dominated and hence unusable.
| Quadrant | # 1 sec bins | Bins with >0 counts | Bins with >2000 counts | High rate bins dominated by noise | Noise dominated (total time) | Noise dominated (detector-on time) | Marked lightcurve |
|---|---|---|---|---|---|---|---|
| A | 7261 | 6231 | 4745 | 4745 | 65.35% | 76.15% | 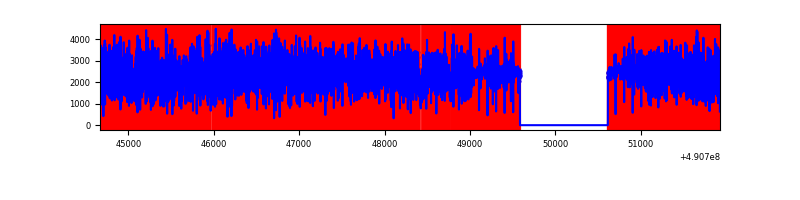 |
| B | 7261 | 6232 | 60 | 60 | 0.83% | 0.96% | 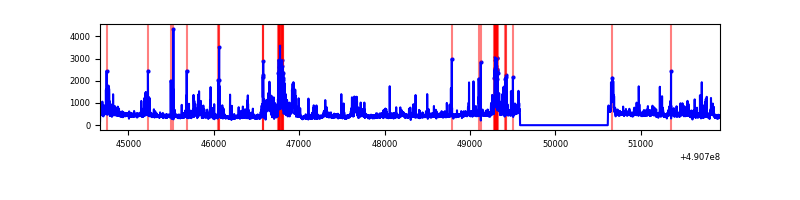 |
| C | 7262 | 6233 | 2253 | 2253 | 31.02% | 36.15% | 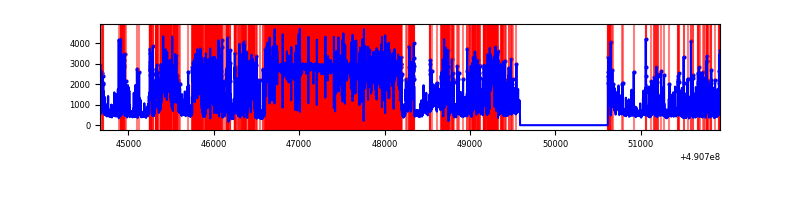 |
| D | 7262 | 6233 | 322 | 322 | 4.43% | 5.17% | 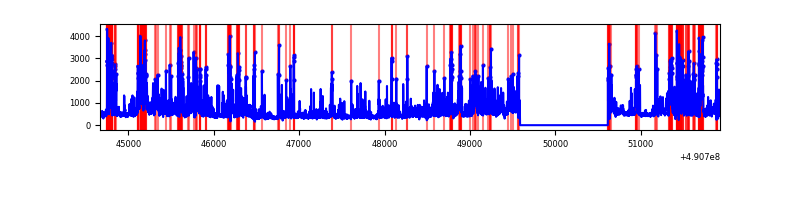 |
Top three noisy pixels from each quadrant. If the there are fewer than three noisy pixels in the level2.evt file, extra rows are filled as -1
| Pixel properties | Quadrant properties | ||||||
|---|---|---|---|---|---|---|---|
| Quadrant | DetID | PixID | Counts | Sigma | Mean | Median | Sigma |
| A | 9 | 191 | 12638965 | 138908.72 | 356 | 346 | 91.0 |
| A | 3 | 62 | 357483 | 3925.23 | 356 | 346 | 91.0 |
| A | 7 | 206 | 233549 | 2563.09 | 356 | 346 | 91.0 |
| B | 4 | 81 | 456809 | 3425.44 | 630 | 610 | 133.2 |
| B | 10 | 247 | 199765 | 1495.39 | 630 | 610 | 133.2 |
| B | 1 | 255 | 85534 | 637.66 | 630 | 610 | 133.2 |
| C | 1 | 241 | 5563006 | 40303.15 | 499 | 494 | 138.0 |
| C | 15 | 224 | 1827289 | 13236.03 | 499 | 494 | 138.0 |
| C | 13 | 3 | 130737 | 943.67 | 499 | 494 | 138.0 |
| D | 12 | 17 | 1215408 | 6915.63 | 608 | 579 | 175.7 |
| D | 3 | 12 | 283672 | 1611.55 | 608 | 579 | 175.7 |
| D | 3 | 224 | 254662 | 1446.41 | 608 | 579 | 175.7 |
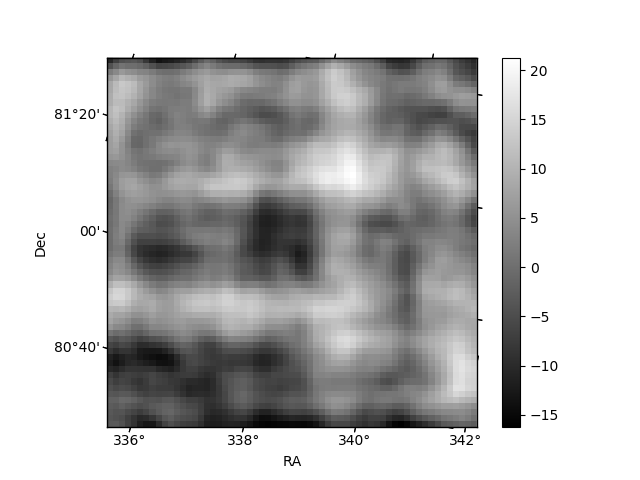
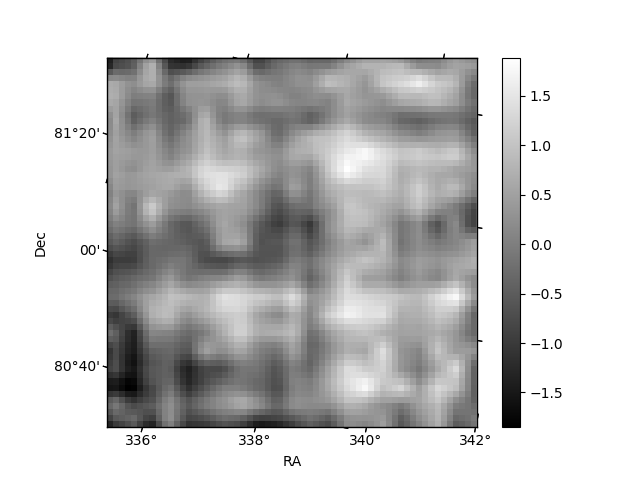
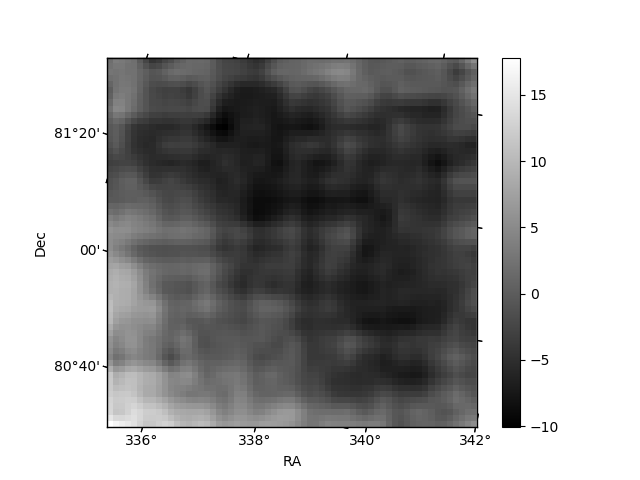
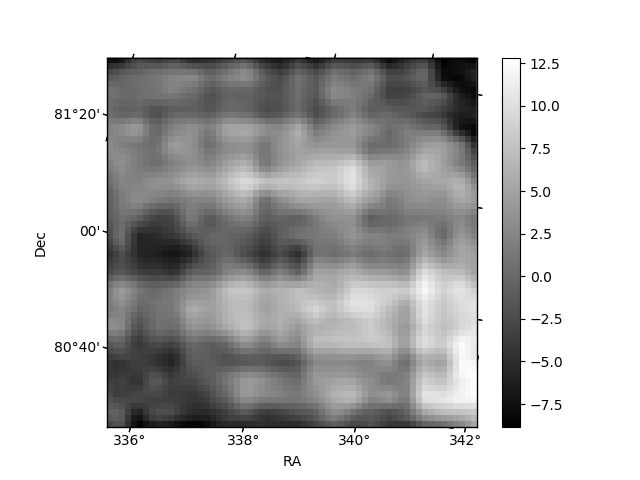
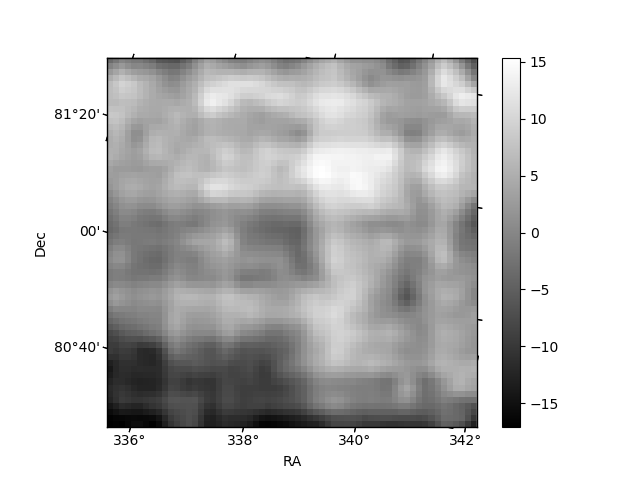
Histogram calculated using DETX and DETY for each event in the final _common_clean file
| Quadrant A | 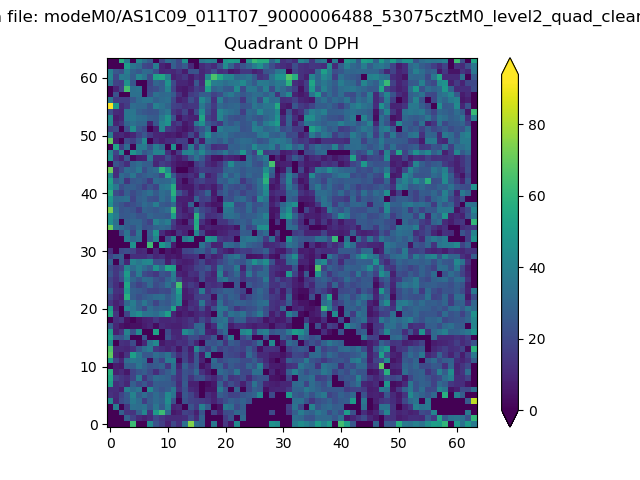 |
 |
Quadrant B |
|---|---|---|---|
| Quadrant D | 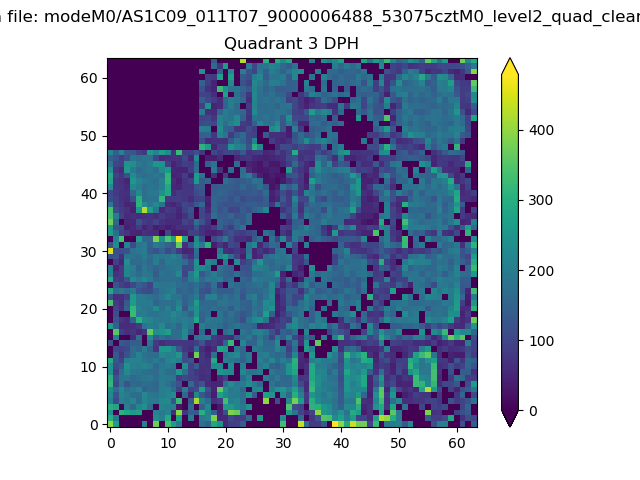 |
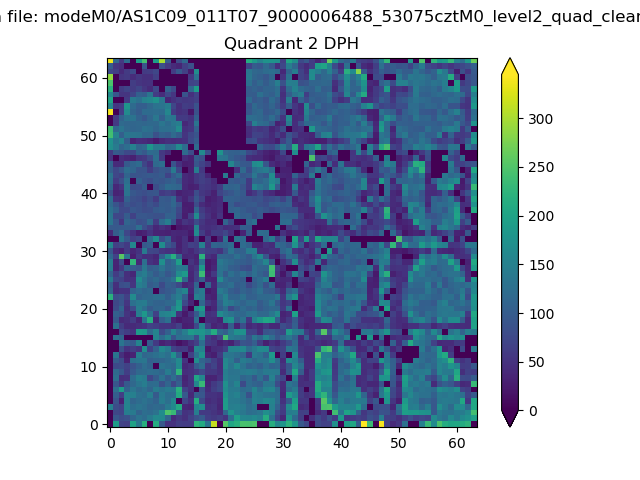 |
Quadrant C |
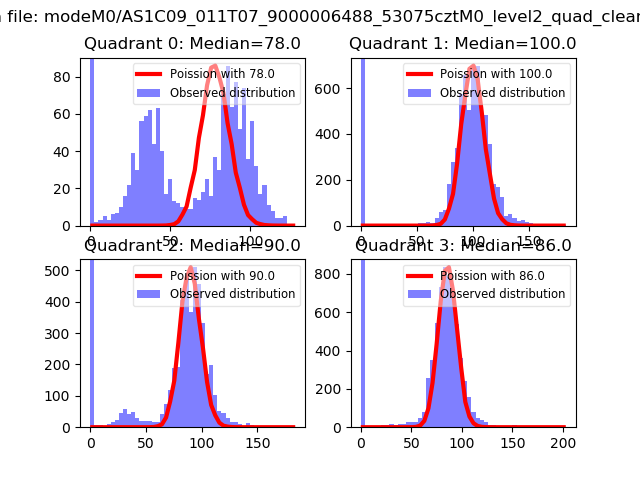
| Plot type | Count rate plots | Images |
|---|---|---|
| Comparison with Poisson distribution Blue bars denote a histogram of data divided into 1 sec bins. Red curve is a Poisson curve with rate = median count rate of data. |
 |
 |
| Quadrant-wise count rates Data is divided into 100 sec bins |
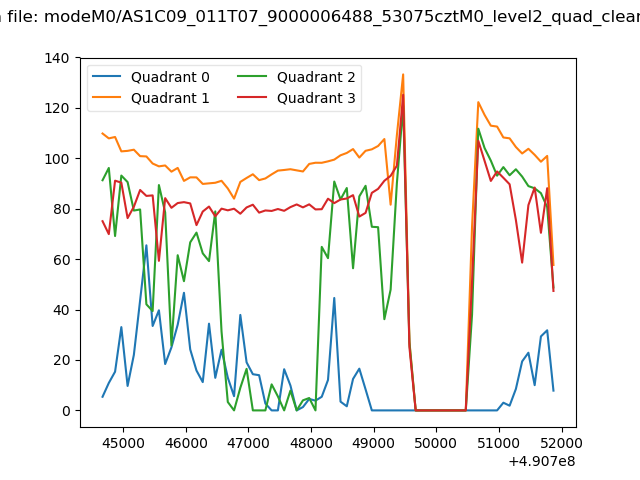 |
|
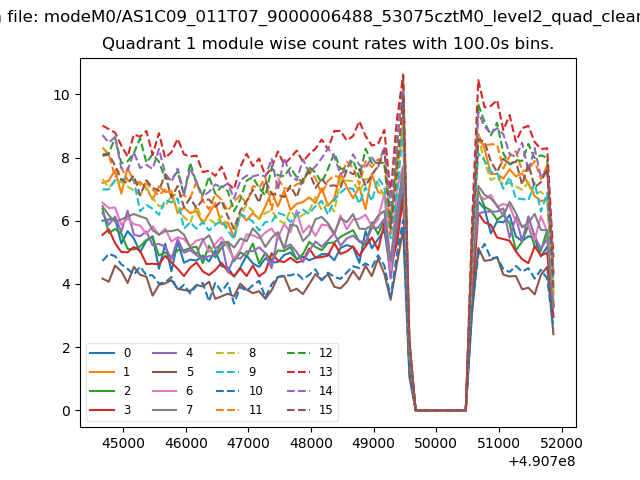
| Module-wise count rates for Quadrant A Data is divided into 100 sec bins |
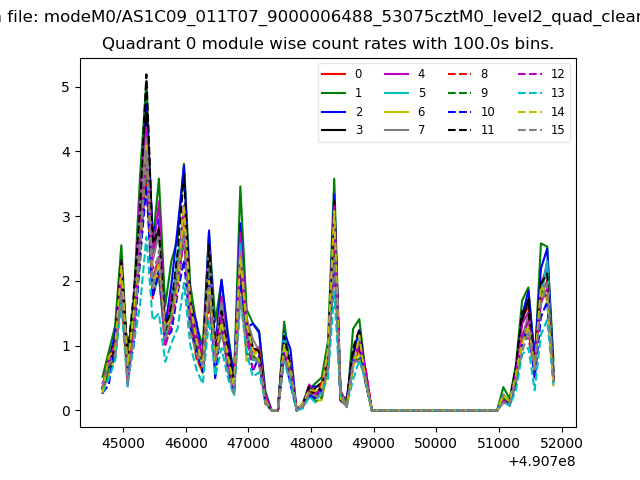 |
 |
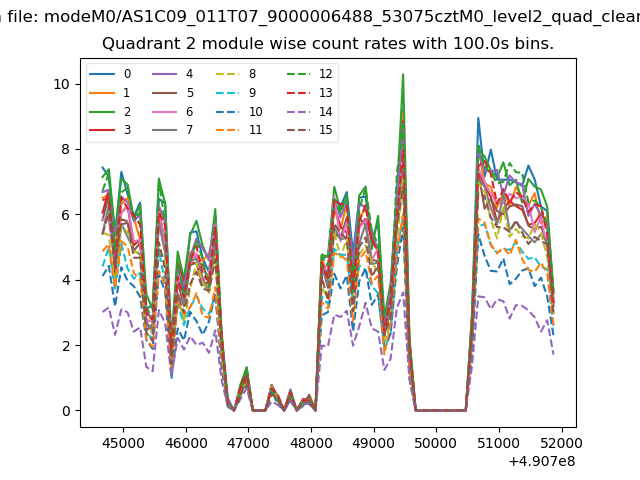
| Module-wise count rates for Quadrant B Data is divided into 100 sec bins |
 |
 |
| Module-wise count rates for Quadrant C Data is divided into 100 sec bins |
 |
 |
| Module-wise count rates for Quadrant D Data is divided into 100 sec bins |
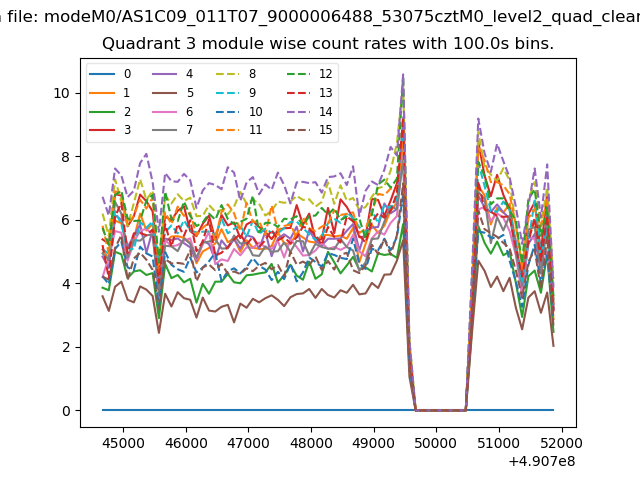 |
 |
| Parameter | Plot |
|---|---|
| CZT HV Monitor | 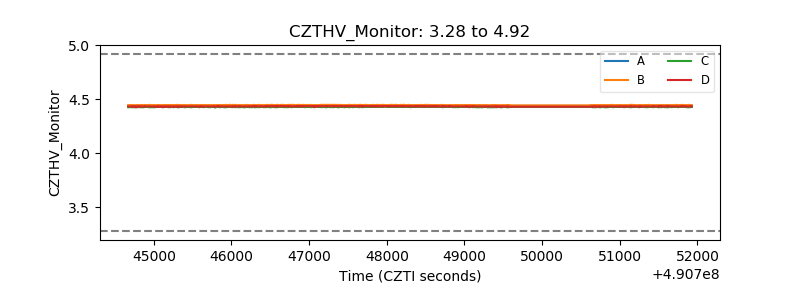 |
| D_VDD | 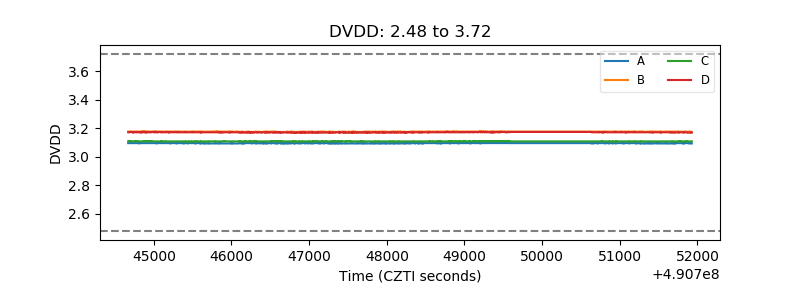 |
| Temperature 1 | 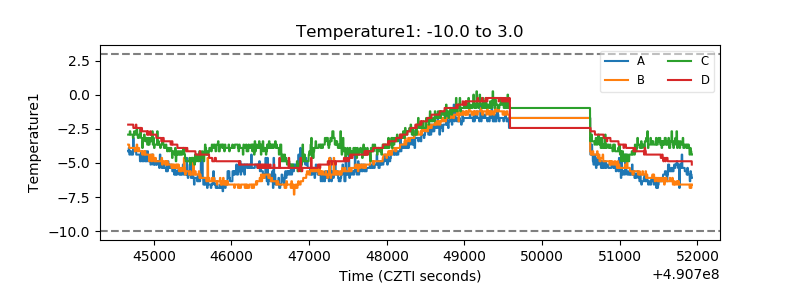 |
| Veto HV Monitor |  |
| Veto LLD | 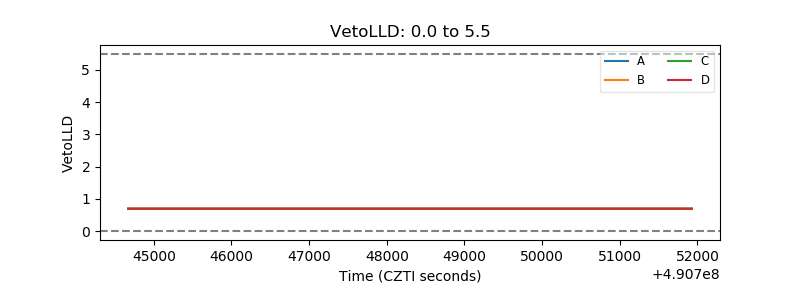 |
| Alpha Counter | 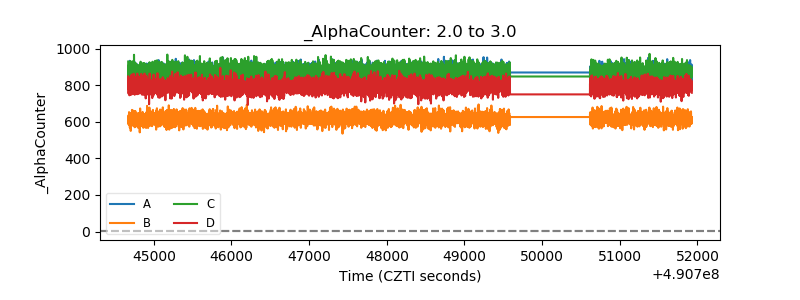 |
| _CPM_Rate | 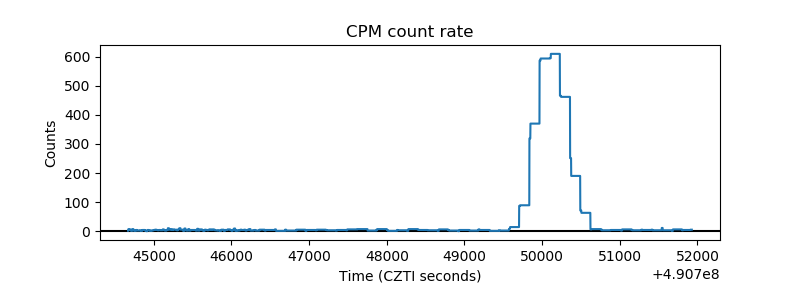 |
| CZT Counter | 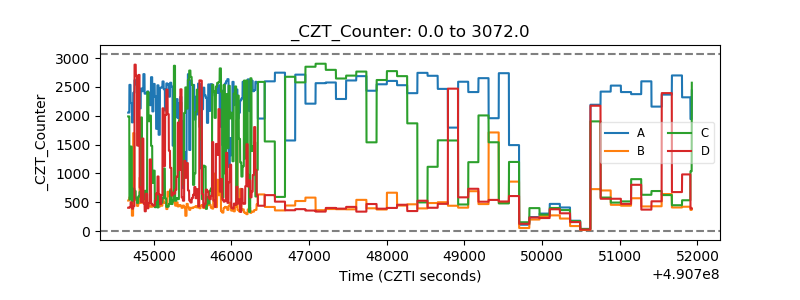 |
| +2.5 Volts monitor | 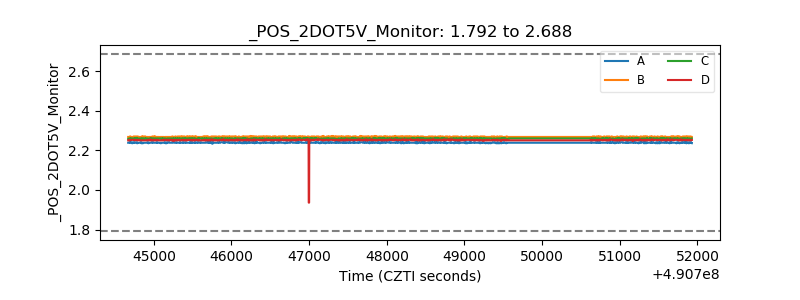 |
| +5 Volts monitor | 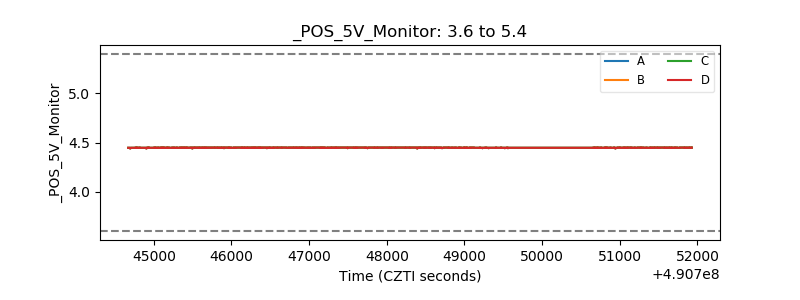 |
| _ROLL_ROT | 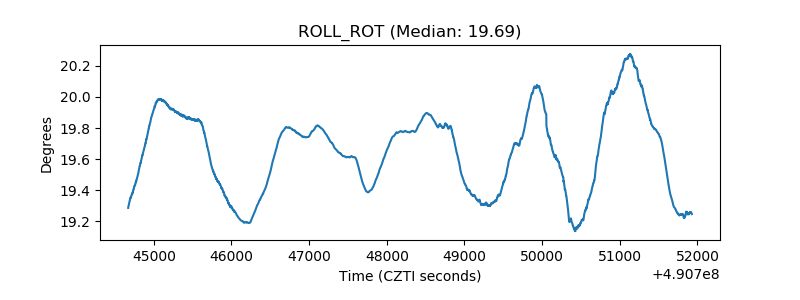 |
| _Roll_DEC | 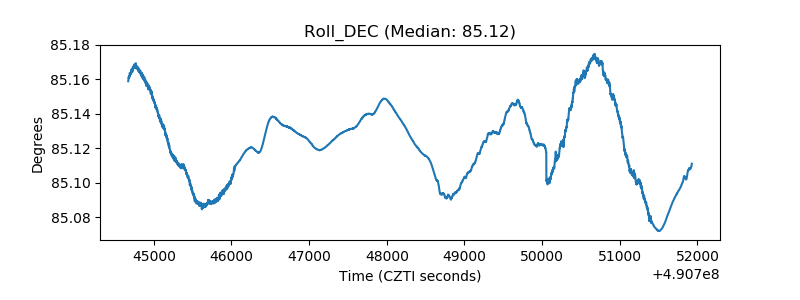 |
| _Roll_RA | 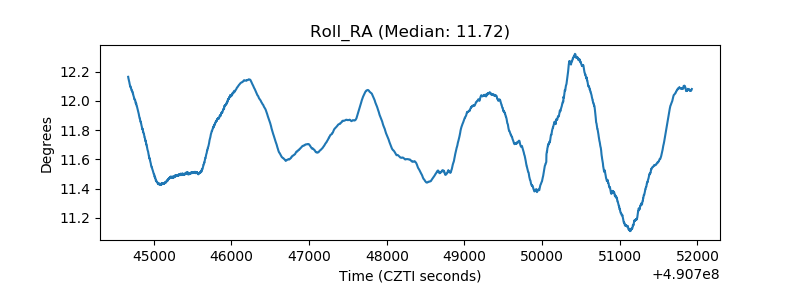 |
| Veto Counter | 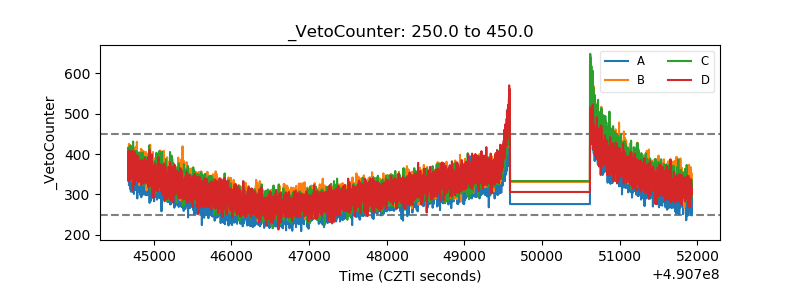 |