| Param | Original file | Final file |
|---|---|---|
| Filename | modeM0/AS1C09_011T07_9000006488_53076cztM0_level2.fits | modeM0/AS1C09_011T07_9000006488_53076cztM0_level2_quad_clean.evt |
| Size (bytes) | 834,027,840 | 79,770,240 |
| Size | 795.4 MB | 76.1 MB |
| Events in quadrant A | 15,643,925 | 125,863 |
| Events in quadrant B | 3,617,340 | 678,263 |
| Events in quadrant C | 6,002,343 | 579,562 |
| Events in quadrant D | 5,090,469 | 564,789 |
| Mode SS | |||
|---|---|---|---|
| Quadrant | BADHDUFLAG | Total packets | Discarded packets |
| A | 0 | 136 | 0 |
| B | 0 | 136 | 0 |
| C | 0 | 136 | 0 |
| D | 0 | 136 | 0 |
| Mode M9 | |||
|---|---|---|---|
| Quadrant | BADHDUFLAG | Total packets | Discarded packets |
| A | 0 | 15 | 0 |
| B | 0 | 16 | 0 |
| C | 0 | 16 | 0 |
| D | 0 | 16 | 0 |
| Mode M0 | |||
|---|---|---|---|
| Quadrant | BADHDUFLAG | Total packets | Discarded packets |
| A | 0 | 50998 | 9 |
| B | 0 | 15758 | 2 |
| C | 0 | 22683 | 2 |
| D | 0 | 19860 | 2 |
| Quadrant | Total seconds | Saturated seconds | Saturation percentage |
|---|---|---|---|
| A | 6693 | 5678 | 84.834902% |
| B | 6693 | 139 | 2.076797% |
| C | 6693 | 588 | 8.785298% |
| D | 6693 | 368 | 5.498282% |
Noise dominated data is calculated using 1-second bins in cleaned event files. If a bin has >2000 counts, and if more than 50% of those come from <1% of pixels, then it is considered to be noise-dominated and hence unusable.
| Quadrant | # 1 sec bins | Bins with >0 counts | Bins with >2000 counts | High rate bins dominated by noise | Noise dominated (total time) | Noise dominated (detector-on time) | Marked lightcurve |
|---|---|---|---|---|---|---|---|
| A | 7813 | 6693 | 4927 | 4927 | 63.06% | 73.61% | 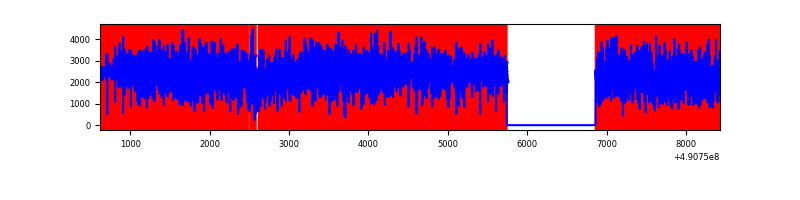 |
| B | 7813 | 6694 | 95 | 95 | 1.22% | 1.42% | 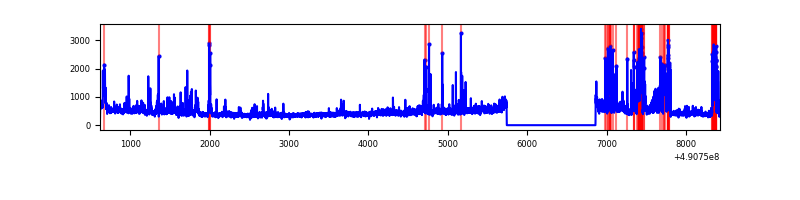 |
| C | 7813 | 6694 | 473 | 473 | 6.05% | 7.07% | 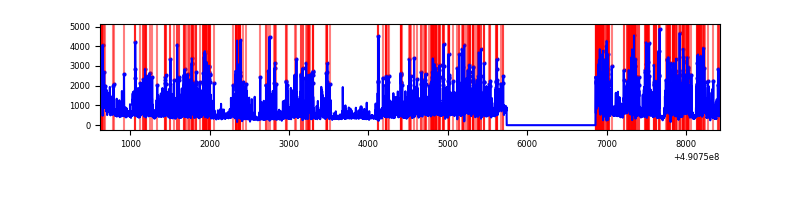 |
| D | 7813 | 6694 | 343 | 343 | 4.39% | 5.12% | 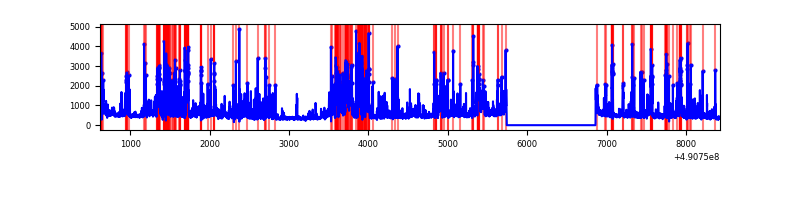 |
Top three noisy pixels from each quadrant. If the there are fewer than three noisy pixels in the level2.evt file, extra rows are filled as -1
| Pixel properties | Quadrant properties | ||||||
|---|---|---|---|---|---|---|---|
| Quadrant | DetID | PixID | Counts | Sigma | Mean | Median | Sigma |
| A | 9 | 191 | 13661047 | 132383.8 | 404 | 393 | 103.2 |
| A | 3 | 14 | 116427 | 1124.47 | 404 | 393 | 103.2 |
| A | 7 | 206 | 103005 | 994.4 | 404 | 393 | 103.2 |
| B | 1 | 255 | 510050 | 3478.21 | 684 | 660 | 146.5 |
| B | 4 | 81 | 127637 | 867.02 | 684 | 660 | 146.5 |
| B | 10 | 128 | 79049 | 535.26 | 684 | 660 | 146.5 |
| C | 15 | 224 | 2497805 | 13901.4 | 650 | 643 | 179.6 |
| C | 9 | 38 | 300095 | 1667.01 | 650 | 643 | 179.6 |
| C | 13 | 3 | 148704 | 824.23 | 650 | 643 | 179.6 |
| D | 12 | 17 | 733001 | 3904.63 | 654 | 626 | 187.6 |
| D | 1 | 241 | 633754 | 3375.5 | 654 | 626 | 187.6 |
| D | 3 | 12 | 467866 | 2491.07 | 654 | 626 | 187.6 |
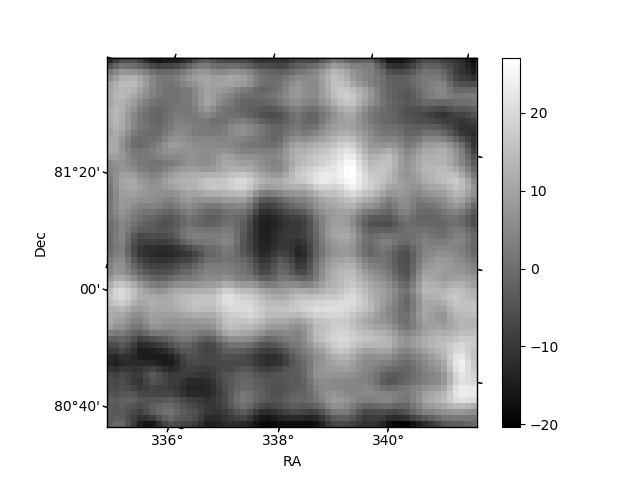
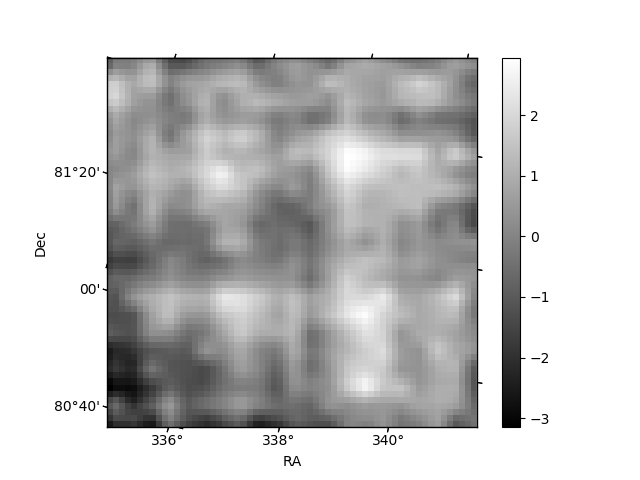
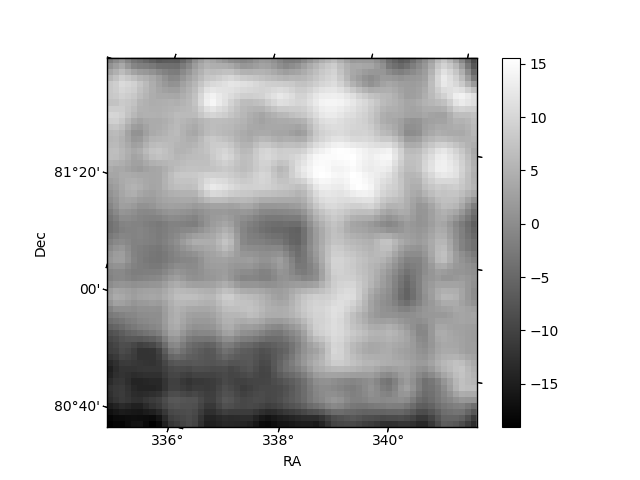
Histogram calculated using DETX and DETY for each event in the final _common_clean file
| Quadrant A | 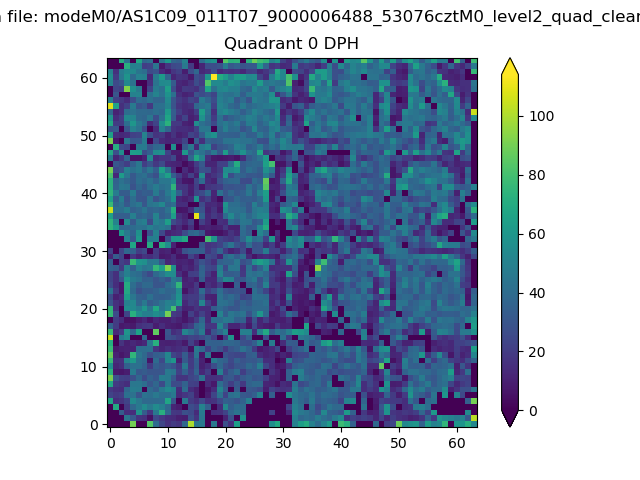 |
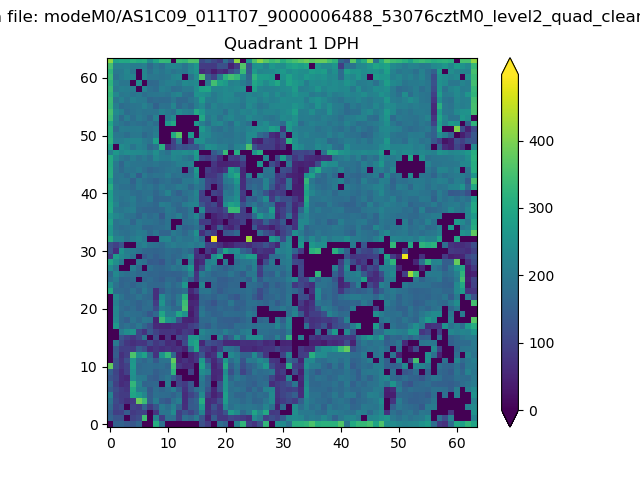 |
Quadrant B |
|---|---|---|---|
| Quadrant D | 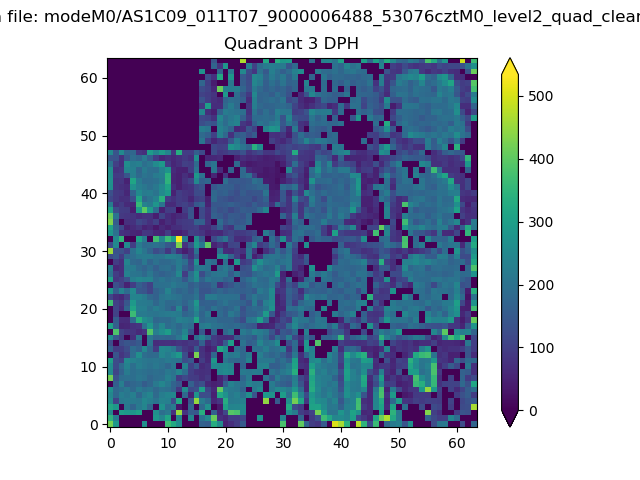 |
 |
Quadrant C |
| Plot type | Count rate plots | Images |
|---|---|---|
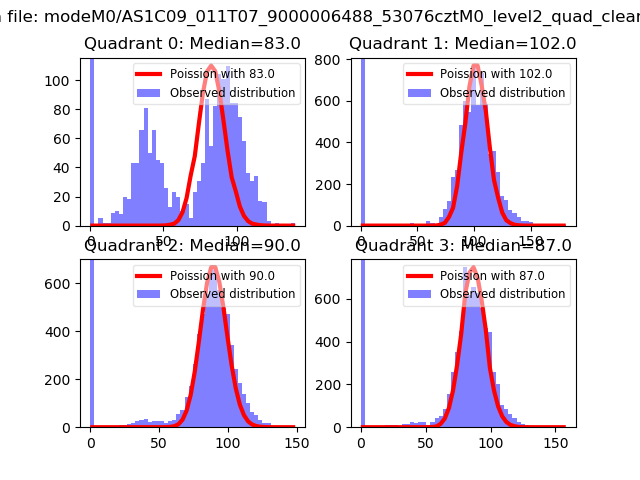
| Comparison with Poisson distribution Blue bars denote a histogram of data divided into 1 sec bins. Red curve is a Poisson curve with rate = median count rate of data. |
 |
 |
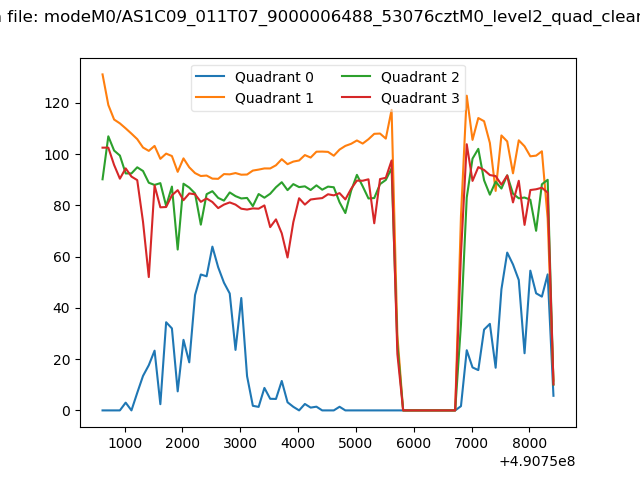
| Quadrant-wise count rates Data is divided into 100 sec bins |
 |
|
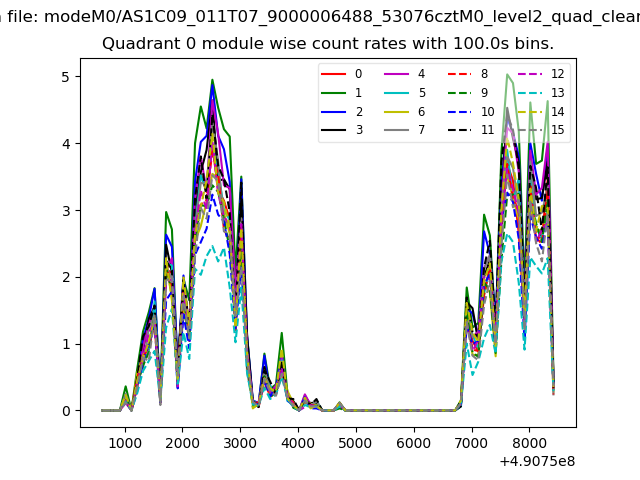
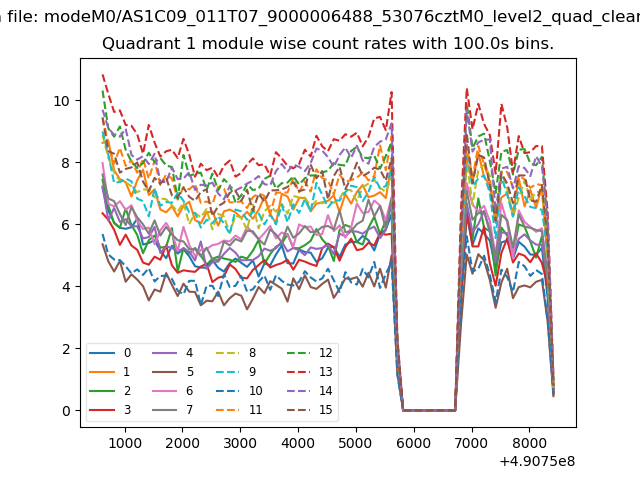
| Module-wise count rates for Quadrant A Data is divided into 100 sec bins |
 |
 |
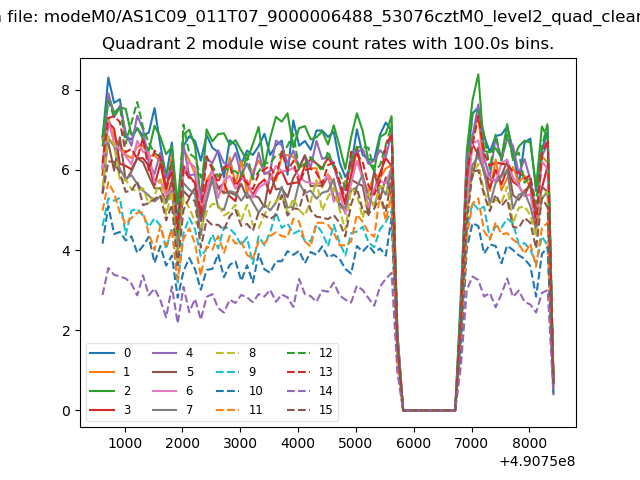
| Module-wise count rates for Quadrant B Data is divided into 100 sec bins |
 |
 |
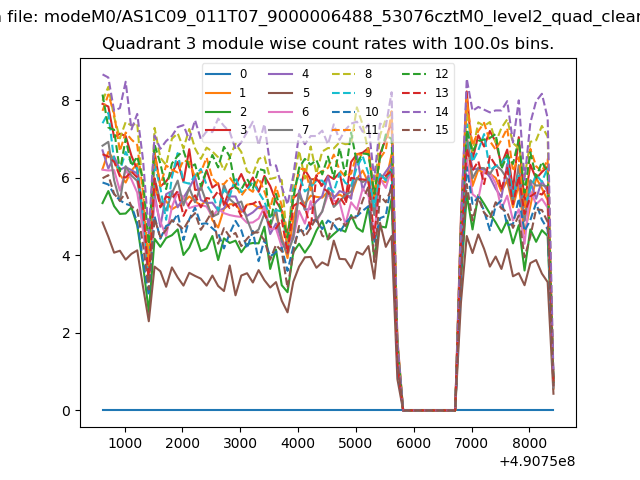
| Module-wise count rates for Quadrant C Data is divided into 100 sec bins |
 |
 |
| Module-wise count rates for Quadrant D Data is divided into 100 sec bins |
 |
 |
| Parameter | Plot |
|---|---|
| CZT HV Monitor | 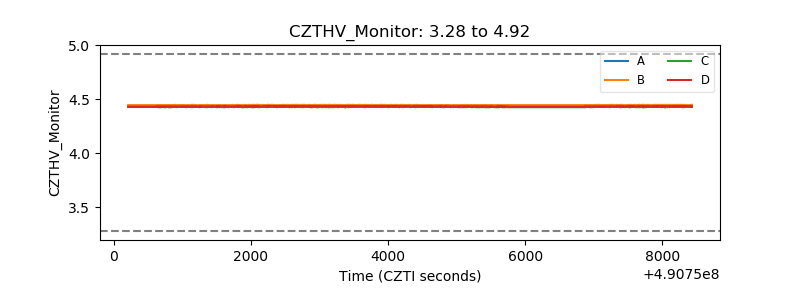 |
| D_VDD | 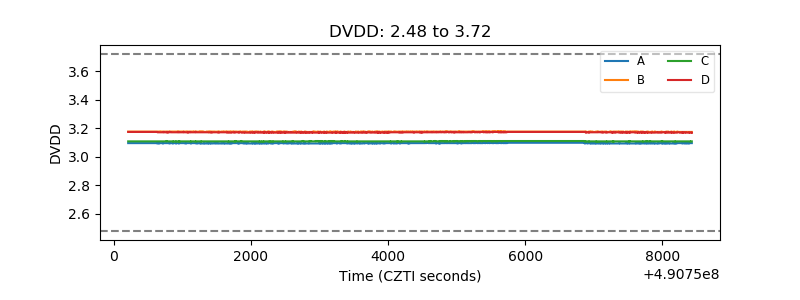 |
| Temperature 1 | 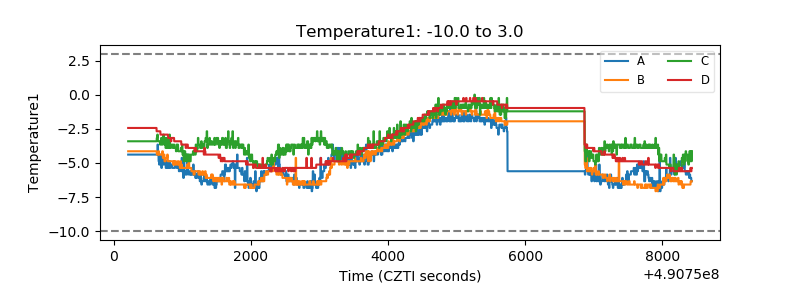 |
| Veto HV Monitor | 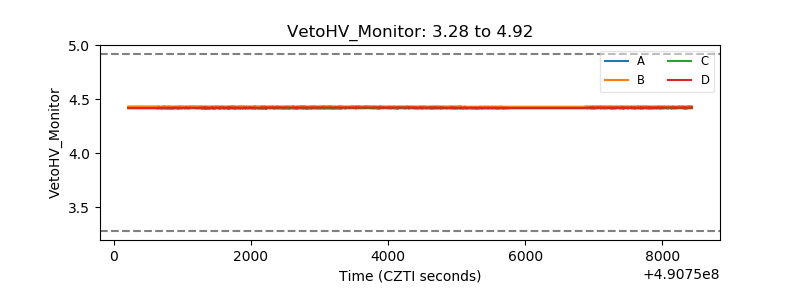 |
| Veto LLD | 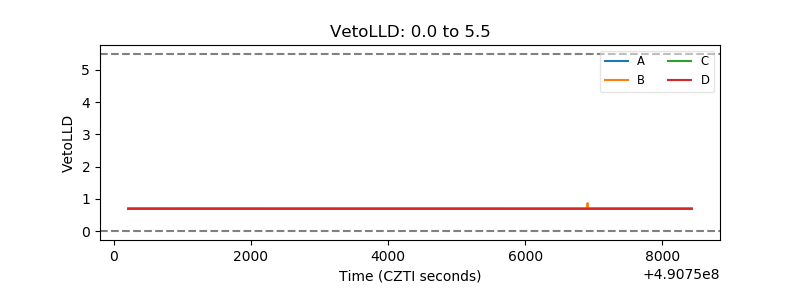 |
| Alpha Counter | 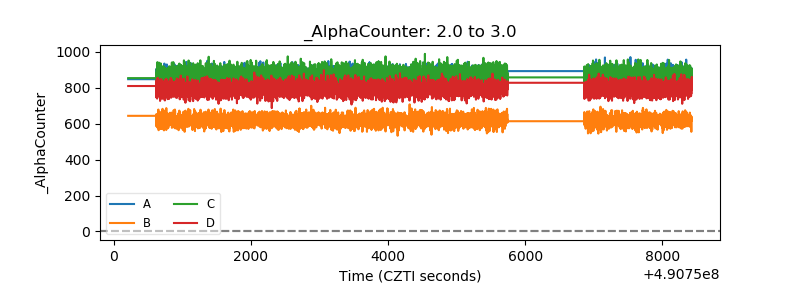 |
| _CPM_Rate |  |
| CZT Counter | 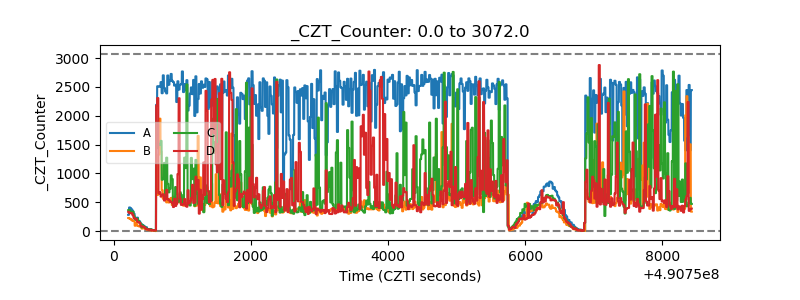 |
| +2.5 Volts monitor |  |
| +5 Volts monitor |  |
| _ROLL_ROT | 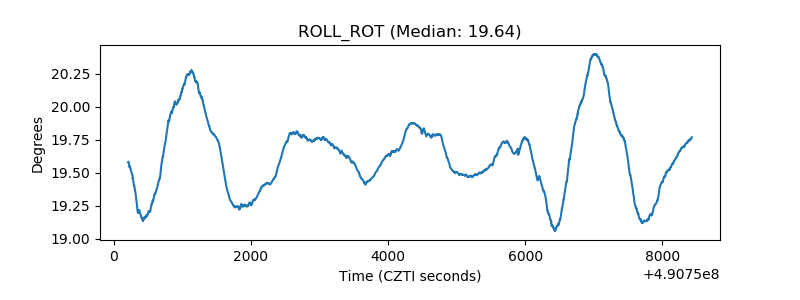 |
| _Roll_DEC | 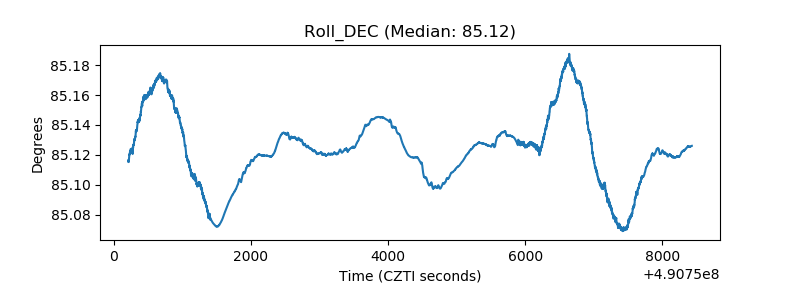 |
| _Roll_RA | 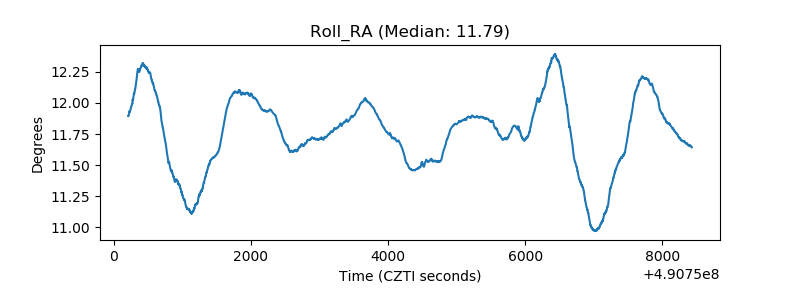 |
| Veto Counter | 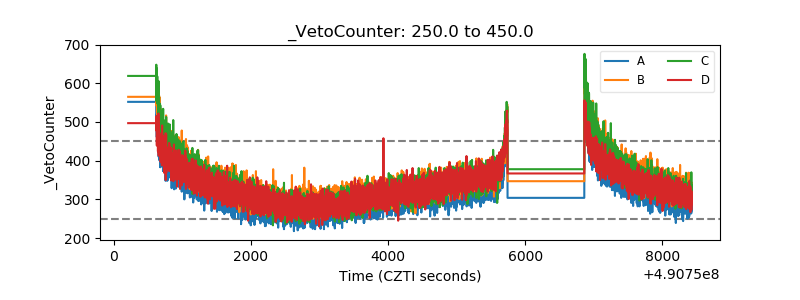 |