| Param | Original file | Final file |
|---|---|---|
| Filename | modeM0/AS1C09_011T07_9000006488_53077cztM0_level2.fits | modeM0/AS1C09_011T07_9000006488_53077cztM0_level2_quad_clean.evt |
| Size (bytes) | 915,929,280 | 75,980,160 |
| Size | 873.5 MB | 72.5 MB |
| Events in quadrant A | 15,600,090 | 112,650 |
| Events in quadrant B | 5,076,805 | 646,611 |
| Events in quadrant C | 7,528,825 | 517,330 |
| Events in quadrant D | 5,187,589 | 562,833 |
| Mode SS | |||
|---|---|---|---|
| Quadrant | BADHDUFLAG | Total packets | Discarded packets |
| A | 0 | 134 | 0 |
| B | 0 | 134 | 0 |
| C | 0 | 134 | 0 |
| D | 0 | 134 | 0 |
| Mode M9 | |||
|---|---|---|---|
| Quadrant | BADHDUFLAG | Total packets | Discarded packets |
| A | 0 | 16 | 0 |
| B | 0 | 17 | 0 |
| C | 0 | 17 | 0 |
| D | 0 | 17 | 0 |
| Mode M0 | |||
|---|---|---|---|
| Quadrant | BADHDUFLAG | Total packets | Discarded packets |
| A | 0 | 50797 | 2 |
| B | 0 | 19729 | 2 |
| C | 0 | 27026 | 2 |
| D | 0 | 20068 | 2 |
| Quadrant | Total seconds | Saturated seconds | Saturation percentage |
|---|---|---|---|
| A | 6609 | 5725 | 86.624300% |
| B | 6609 | 608 | 9.199576% |
| C | 6609 | 1334 | 20.184597% |
| D | 6609 | 401 | 6.067484% |
Noise dominated data is calculated using 1-second bins in cleaned event files. If a bin has >2000 counts, and if more than 50% of those come from <1% of pixels, then it is considered to be noise-dominated and hence unusable.
| Quadrant | # 1 sec bins | Bins with >0 counts | Bins with >2000 counts | High rate bins dominated by noise | Noise dominated (total time) | Noise dominated (detector-on time) | Marked lightcurve |
|---|---|---|---|---|---|---|---|
| A | 7799 | 6609 | 5009 | 5009 | 64.23% | 75.79% | 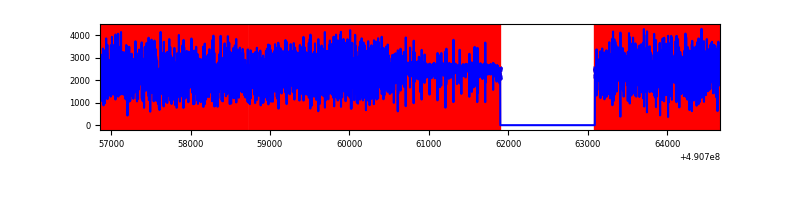 |
| B | 7799 | 6610 | 460 | 460 | 5.90% | 6.96% | 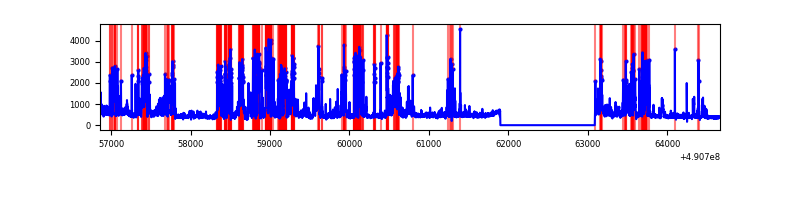 |
| C | 7799 | 6610 | 1095 | 1095 | 14.04% | 16.57% | 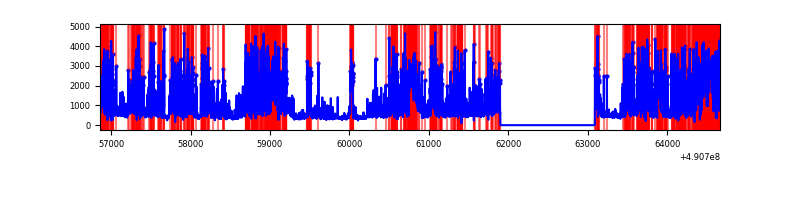 |
| D | 7799 | 6610 | 348 | 348 | 4.46% | 5.26% | 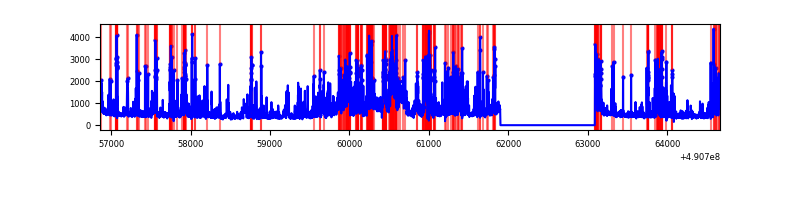 |
Top three noisy pixels from each quadrant. If the there are fewer than three noisy pixels in the level2.evt file, extra rows are filled as -1
| Pixel properties | Quadrant properties | ||||||
|---|---|---|---|---|---|---|---|
| Quadrant | DetID | PixID | Counts | Sigma | Mean | Median | Sigma |
| A | 9 | 191 | 13729370 | 146663.47 | 373 | 365 | 93.6 |
| A | 7 | 206 | 133797 | 1425.42 | 373 | 365 | 93.6 |
| A | 3 | 14 | 108464 | 1154.79 | 373 | 365 | 93.6 |
| B | 1 | 255 | 2147413 | 15240.42 | 661 | 640 | 140.9 |
| B | 4 | 81 | 97318 | 686.34 | 661 | 640 | 140.9 |
| B | 10 | 247 | 60748 | 426.72 | 661 | 640 | 140.9 |
| C | 15 | 224 | 3475972 | 20676.28 | 612 | 605 | 168.1 |
| C | 1 | 241 | 742927 | 4416.36 | 612 | 605 | 168.1 |
| C | 9 | 38 | 383186 | 2276.12 | 612 | 605 | 168.1 |
| D | 1 | 241 | 697012 | 3747.36 | 645 | 615 | 185.8 |
| D | 2 | 62 | 683301 | 3673.59 | 645 | 615 | 185.8 |
| D | 12 | 17 | 439596 | 2362.19 | 645 | 615 | 185.8 |
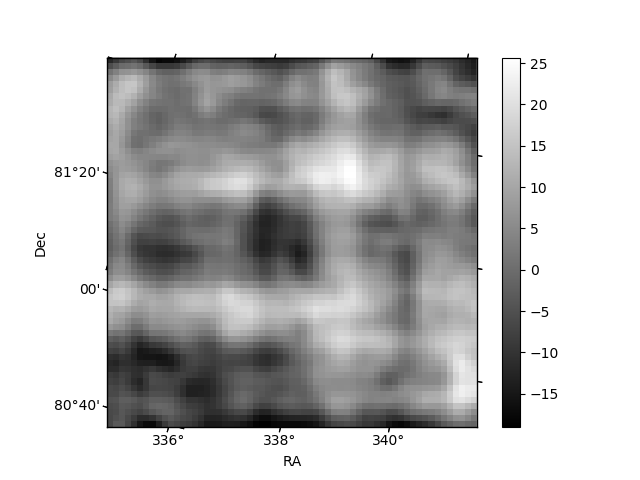
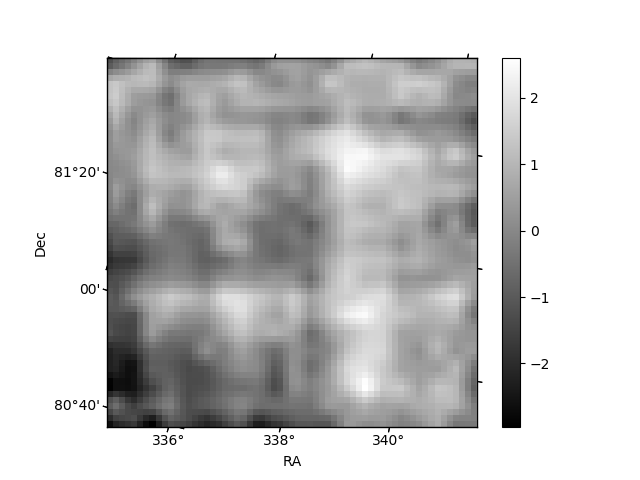
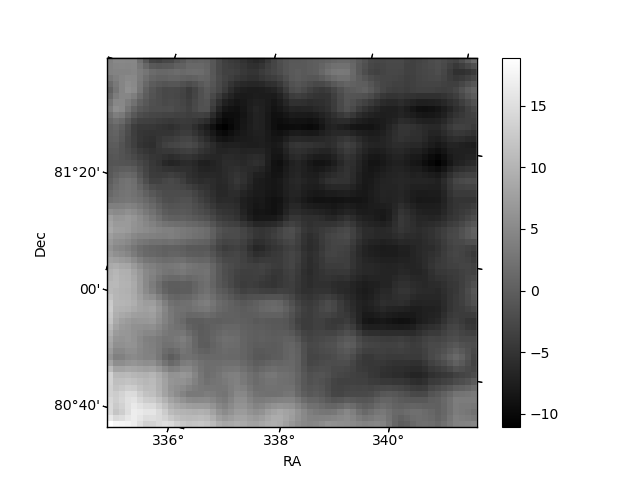
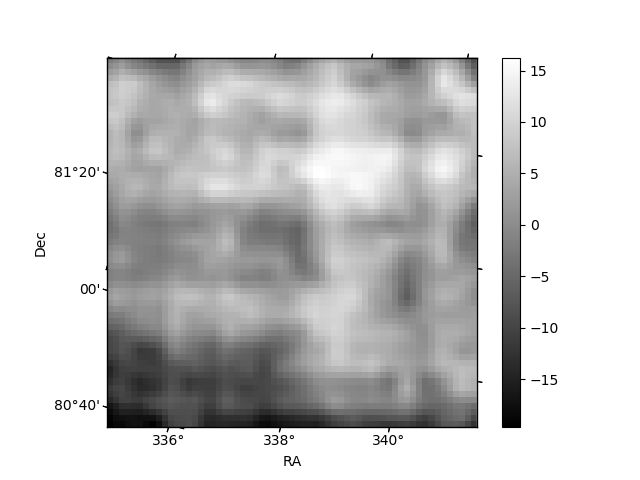
Histogram calculated using DETX and DETY for each event in the final _common_clean file
| Quadrant A | 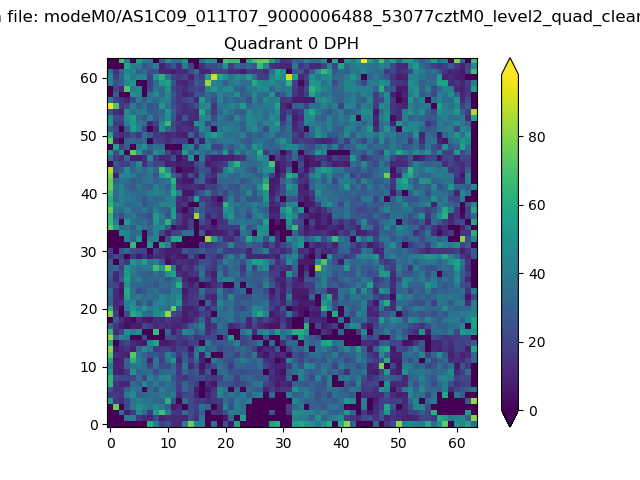 |
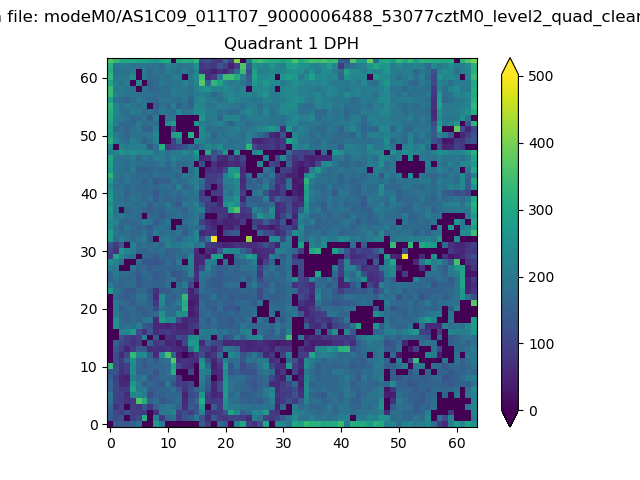 |
Quadrant B |
|---|---|---|---|
| Quadrant D | 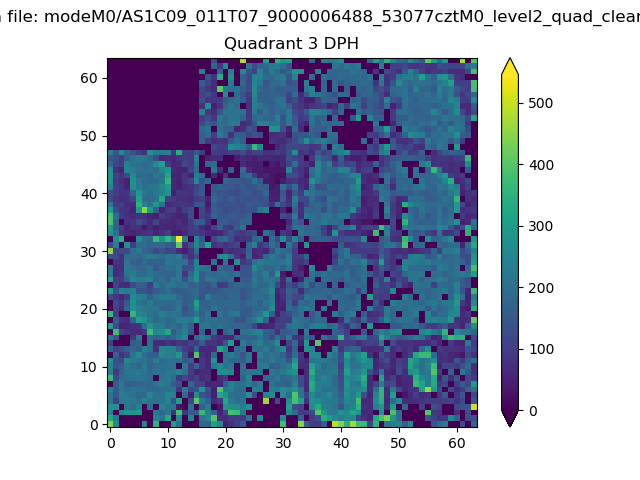 |
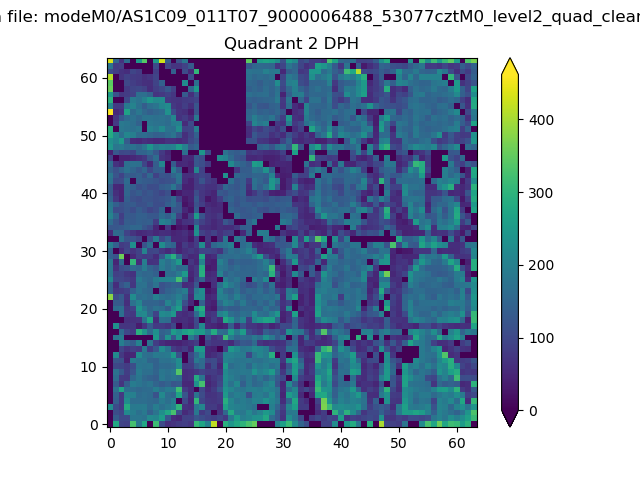 |
Quadrant C |
| Plot type | Count rate plots | Images |
|---|---|---|
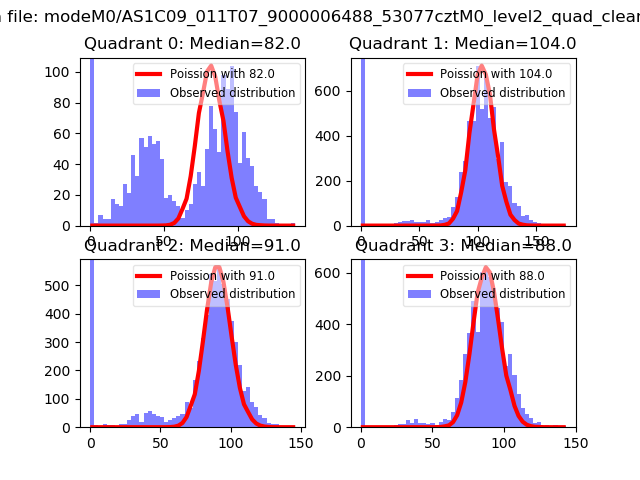
| Comparison with Poisson distribution Blue bars denote a histogram of data divided into 1 sec bins. Red curve is a Poisson curve with rate = median count rate of data. |
 |
 |
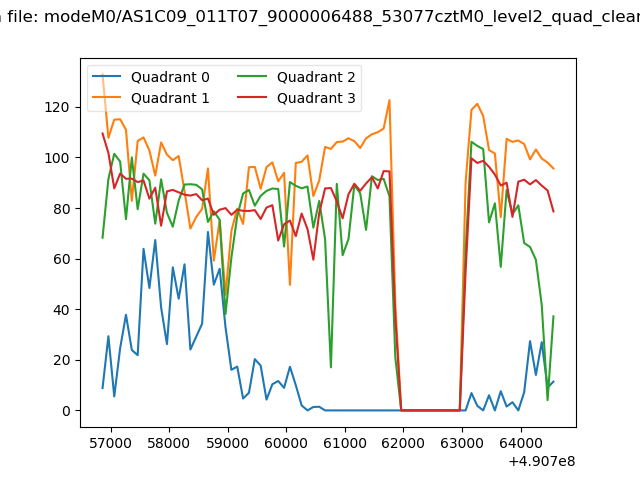
| Quadrant-wise count rates Data is divided into 100 sec bins |
 |
|
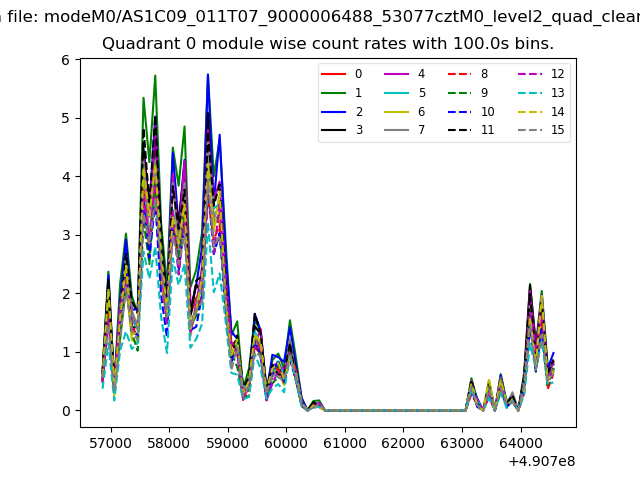
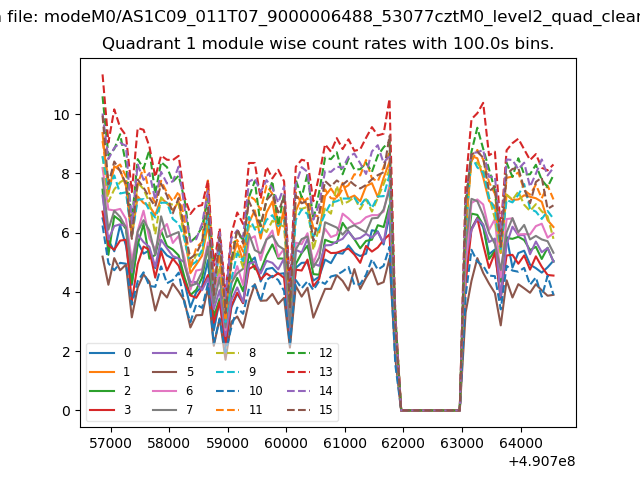
| Module-wise count rates for Quadrant A Data is divided into 100 sec bins |
 |
 |
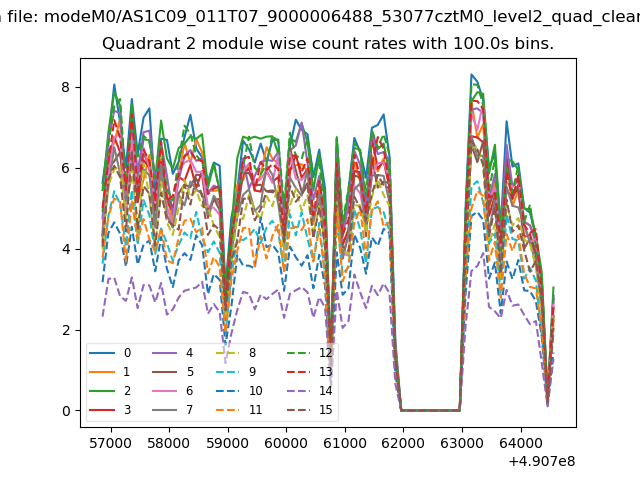
| Module-wise count rates for Quadrant B Data is divided into 100 sec bins |
 |
 |
| Module-wise count rates for Quadrant C Data is divided into 100 sec bins |
 |
 |
| Module-wise count rates for Quadrant D Data is divided into 100 sec bins |
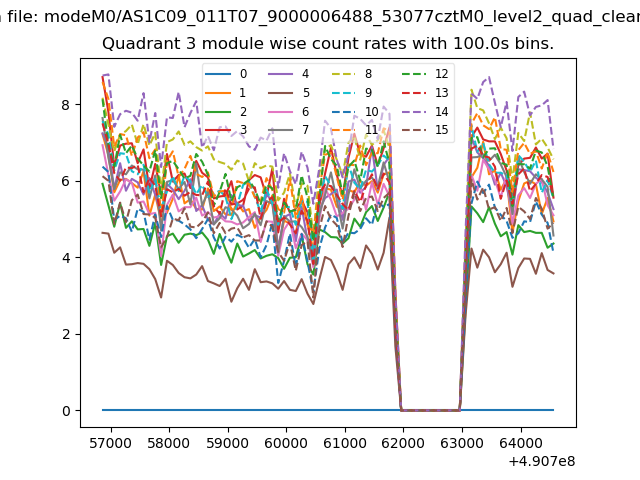 |
 |
| Parameter | Plot |
|---|---|
| CZT HV Monitor | 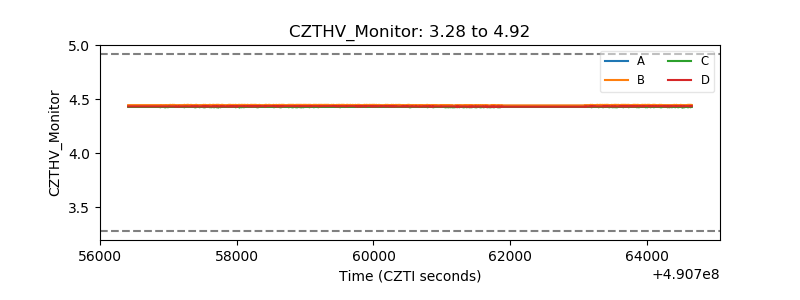 |
| D_VDD | 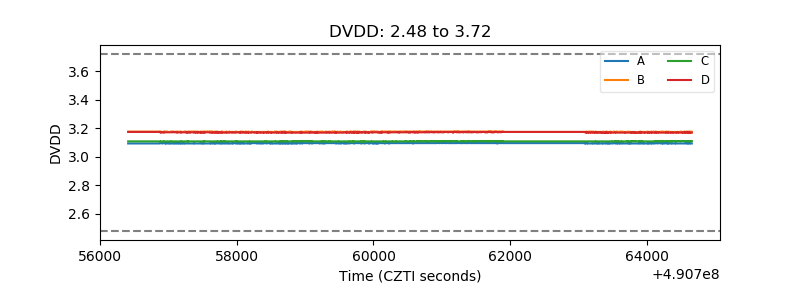 |
| Temperature 1 | 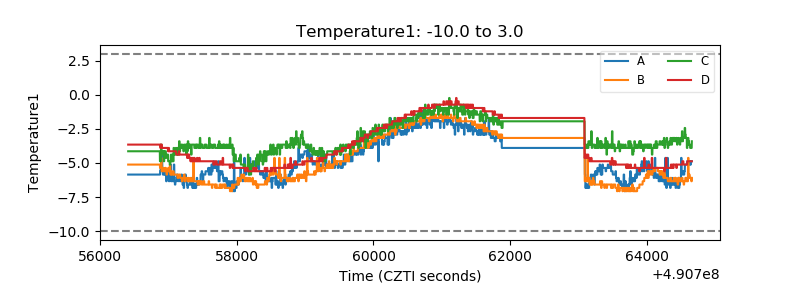 |
| Veto HV Monitor | 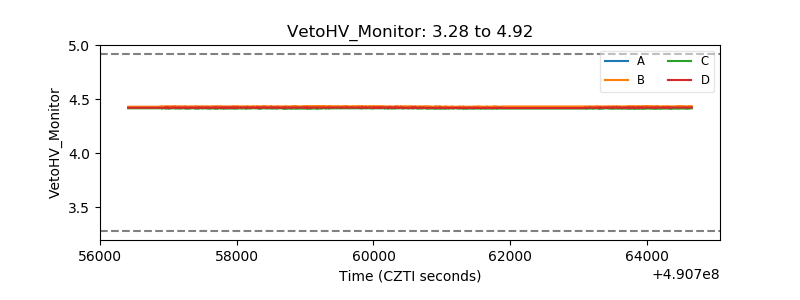 |
| Veto LLD | 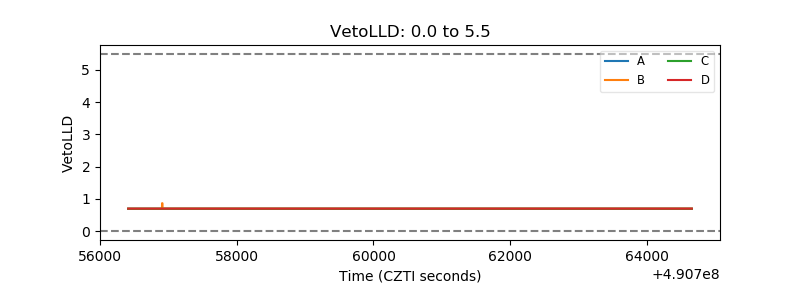 |
| Alpha Counter | 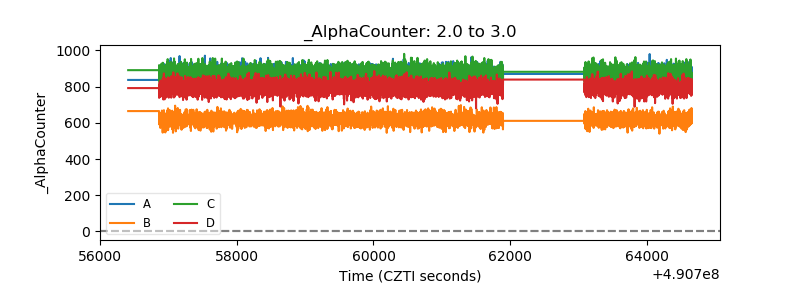 |
| _CPM_Rate | 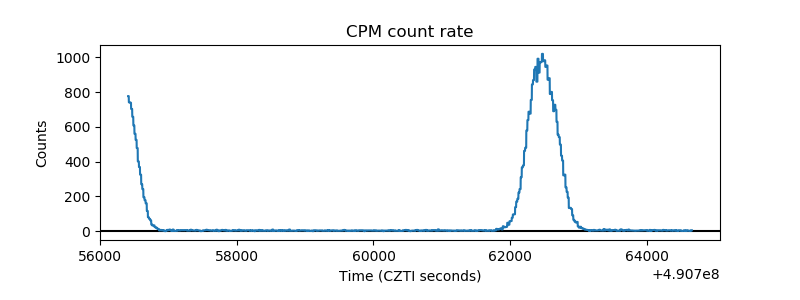 |
| CZT Counter | 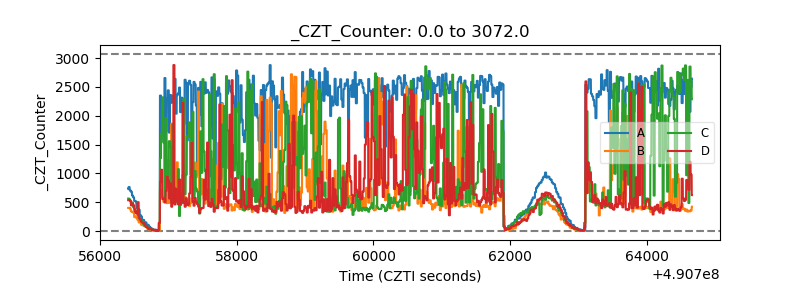 |
| +2.5 Volts monitor |  |
| +5 Volts monitor |  |
| _ROLL_ROT | 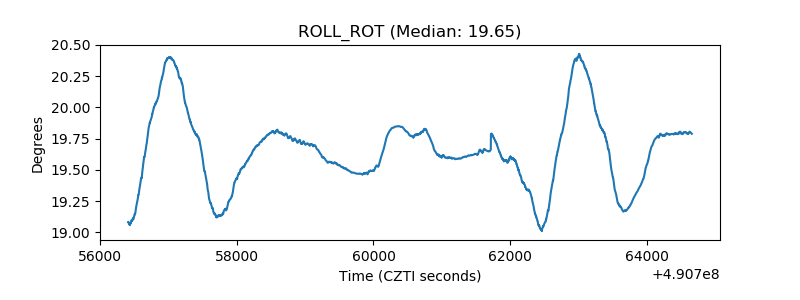 |
| _Roll_DEC | 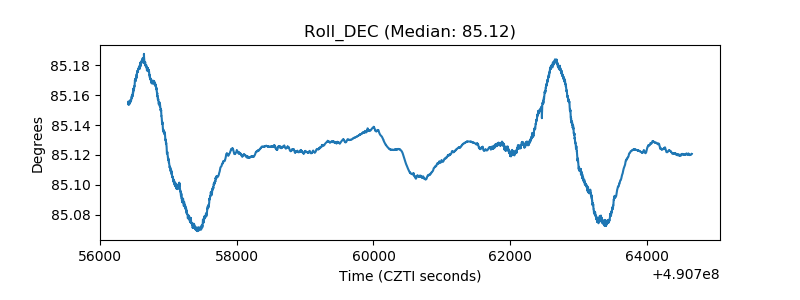 |
| _Roll_RA | 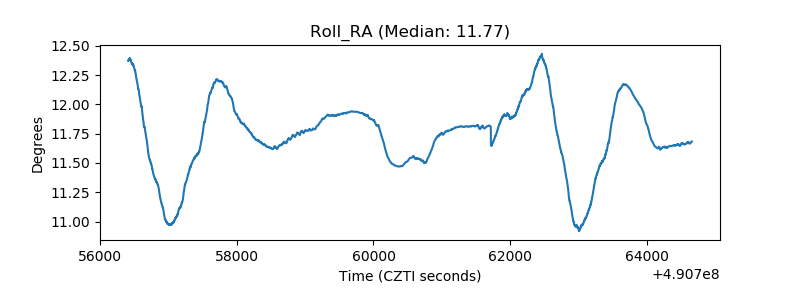 |
| Veto Counter | 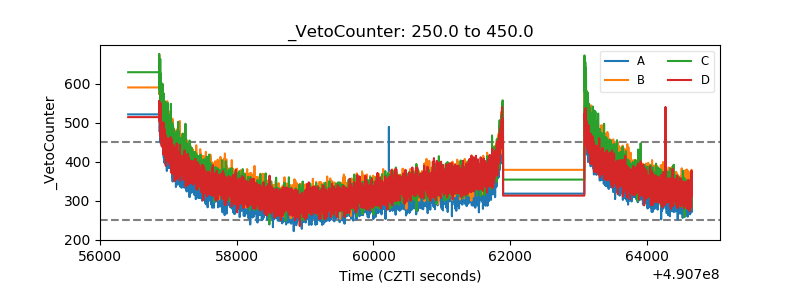 |