| Param | Original file | Final file |
|---|---|---|
| Filename | modeM0/AS1C09_011T07_9000006488_53080cztM0_level2.fits | modeM0/AS1C09_011T07_9000006488_53080cztM0_level2_quad_clean.evt |
| Size (bytes) | 1,425,919,680 | 122,869,440 |
| Size | 1.3 GB | 117.2 MB |
| Events in quadrant A | 27,700,215 | 22,584 |
| Events in quadrant B | 5,720,377 | 1,120,674 |
| Events in quadrant C | 11,378,487 | 900,166 |
| Events in quadrant D | 7,122,862 | 906,832 |
| Mode SS | |||
|---|---|---|---|
| Quadrant | BADHDUFLAG | Total packets | Discarded packets |
| A | 0 | 226 | 0 |
| B | 0 | 226 | 0 |
| C | 0 | 226 | 0 |
| D | 0 | 226 | 0 |
| Mode M9 | |||
|---|---|---|---|
| Quadrant | BADHDUFLAG | Total packets | Discarded packets |
| A | 0 | 20 | 0 |
| B | 0 | 20 | 0 |
| C | 0 | 20 | 0 |
| D | 0 | 20 | 0 |
| Mode M0 | |||
|---|---|---|---|
| Quadrant | BADHDUFLAG | Total packets | Discarded packets |
| A | 0 | 89686 | 2 |
| B | 0 | 25119 | 2 |
| C | 0 | 41769 | 2 |
| D | 0 | 29102 | 2 |
| Quadrant | Total seconds | Saturated seconds | Saturation percentage |
|---|---|---|---|
| A | 11122 | 10955 | 98.498471% |
| B | 11122 | 248 | 2.229815% |
| C | 11122 | 1600 | 14.385902% |
| D | 11122 | 597 | 5.367740% |
Noise dominated data is calculated using 1-second bins in cleaned event files. If a bin has >2000 counts, and if more than 50% of those come from <1% of pixels, then it is considered to be noise-dominated and hence unusable.
| Quadrant | # 1 sec bins | Bins with >0 counts | Bins with >2000 counts | High rate bins dominated by noise | Noise dominated (total time) | Noise dominated (detector-on time) | Marked lightcurve |
|---|---|---|---|---|---|---|---|
| A | 13132 | 11122 | 9908 | 9908 | 75.45% | 89.08% | 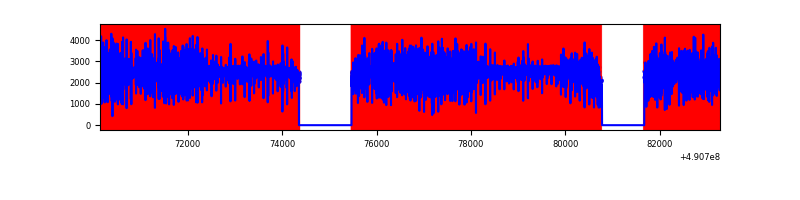 |
| B | 13132 | 11124 | 48 | 48 | 0.37% | 0.43% | 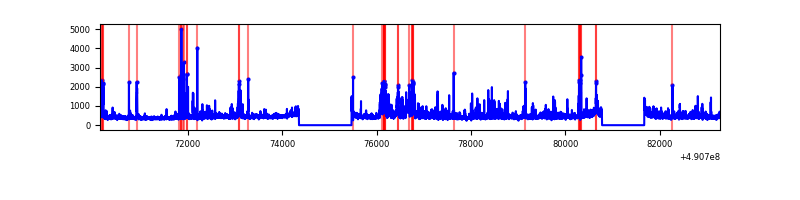 |
| C | 13132 | 11124 | 1233 | 1233 | 9.39% | 11.08% | 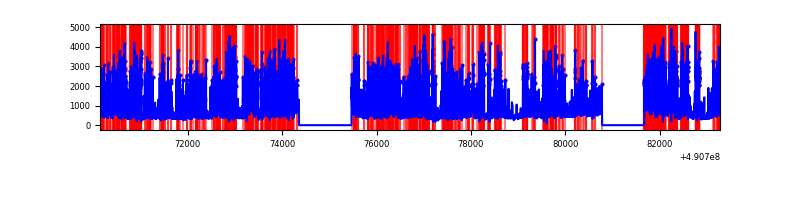 |
| D | 13132 | 11124 | 427 | 427 | 3.25% | 3.84% | 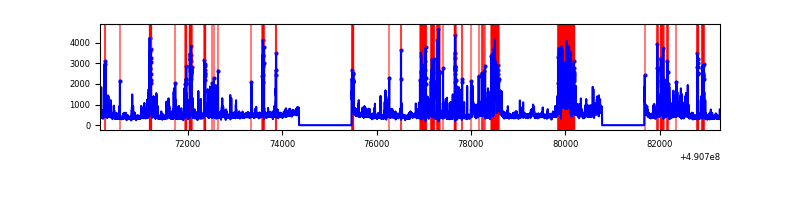 |
Top three noisy pixels from each quadrant. If the there are fewer than three noisy pixels in the level2.evt file, extra rows are filled as -1
| Pixel properties | Quadrant properties | ||||||
|---|---|---|---|---|---|---|---|
| Quadrant | DetID | PixID | Counts | Sigma | Mean | Median | Sigma |
| A | 9 | 191 | 24987331 | 214828.67 | 454 | 443 | 116.3 |
| A | 15 | 174 | 204716 | 1756.27 | 454 | 443 | 116.3 |
| A | 12 | 115 | 201525 | 1728.83 | 454 | 443 | 116.3 |
| B | 4 | 81 | 618296 | 2597.83 | 1134 | 1094 | 237.6 |
| B | 1 | 255 | 141465 | 590.83 | 1134 | 1094 | 237.6 |
| B | 10 | 247 | 130364 | 544.1 | 1134 | 1094 | 237.6 |
| C | 15 | 224 | 5290609 | 18438.08 | 1048 | 1038 | 286.9 |
| C | 9 | 38 | 491128 | 1708.33 | 1048 | 1038 | 286.9 |
| C | 13 | 3 | 294265 | 1022.11 | 1048 | 1038 | 286.9 |
| D | 12 | 17 | 1237454 | 4051.05 | 1091 | 1044 | 305.2 |
| D | 2 | 172 | 297978 | 972.89 | 1091 | 1044 | 305.2 |
| D | 8 | 176 | 196775 | 641.31 | 1091 | 1044 | 305.2 |
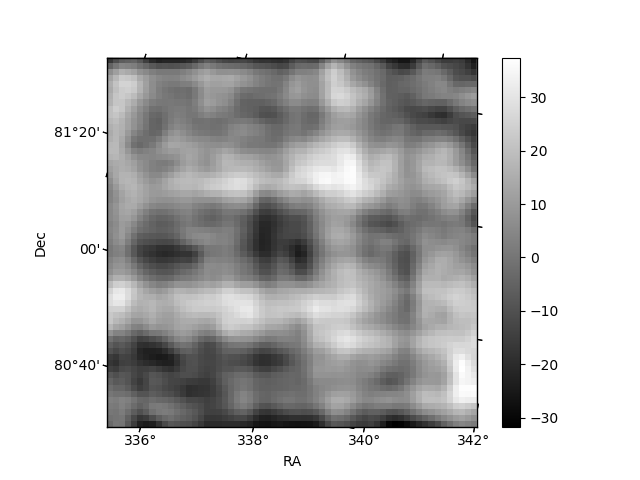
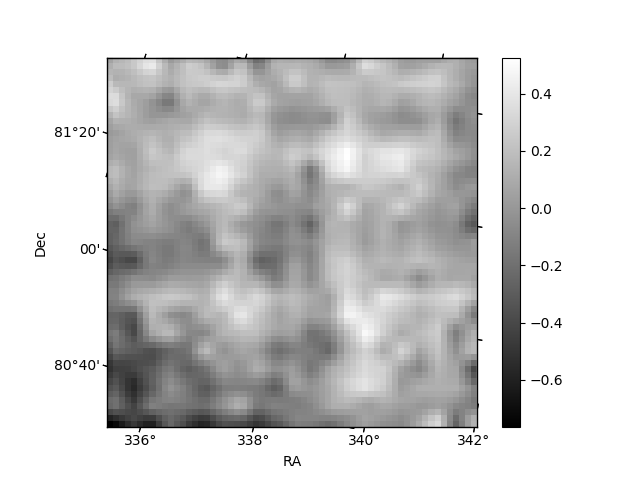
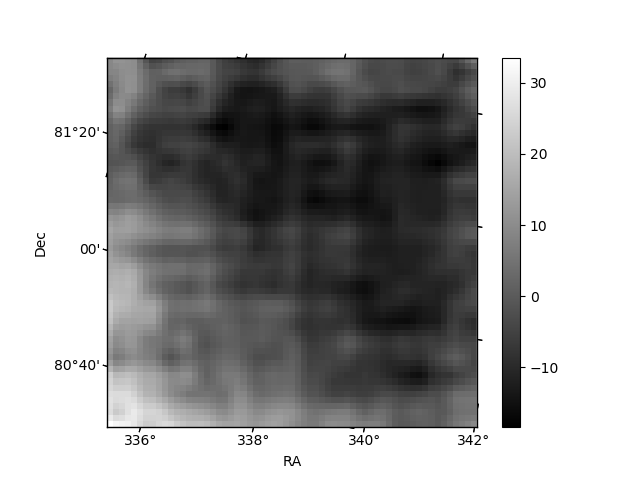
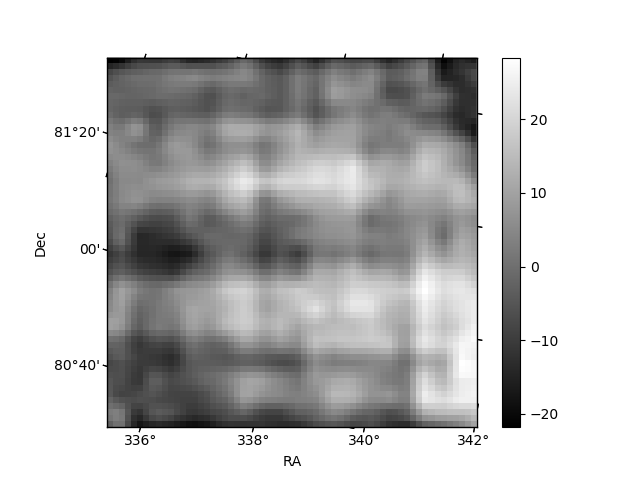
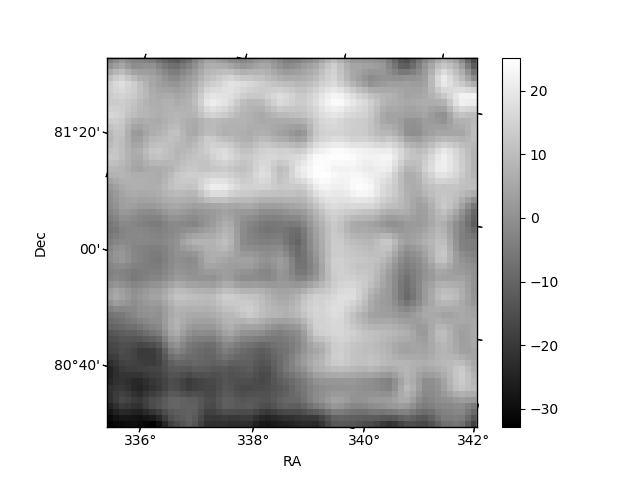
Histogram calculated using DETX and DETY for each event in the final _common_clean file
| Quadrant A | 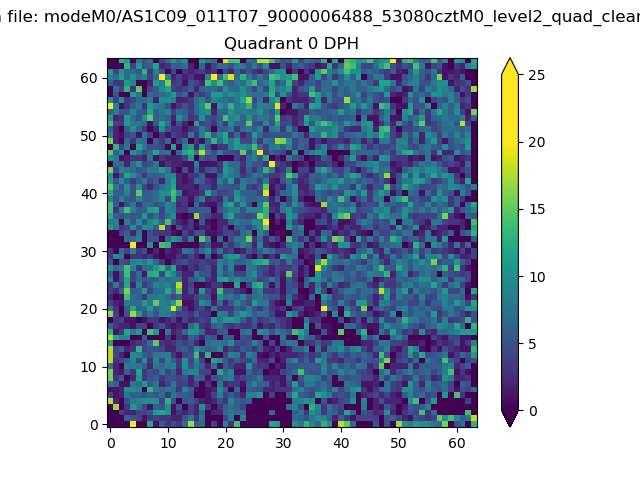 |
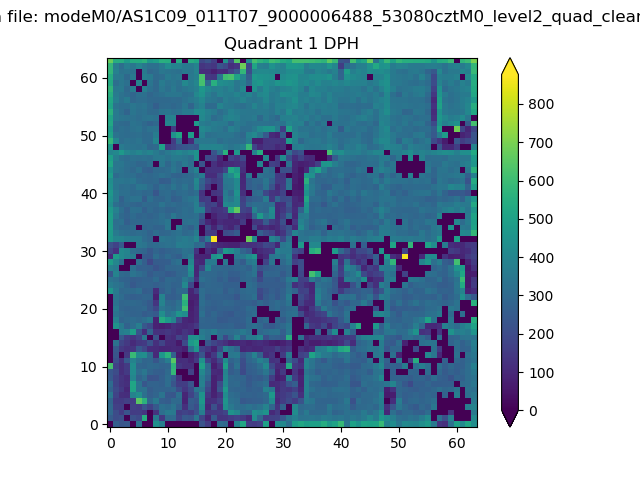 |
Quadrant B |
|---|---|---|---|
| Quadrant D | 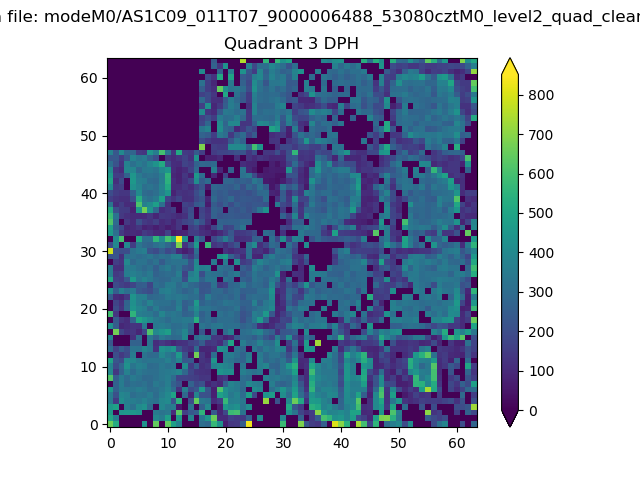 |
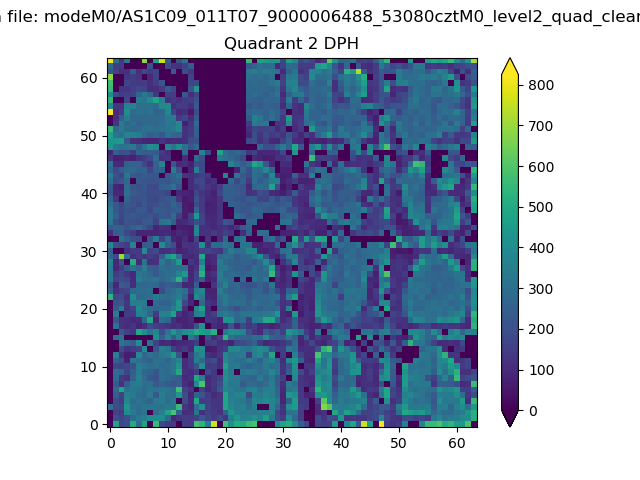 |
Quadrant C |
| Plot type | Count rate plots | Images |
|---|---|---|
| Comparison with Poisson distribution Blue bars denote a histogram of data divided into 1 sec bins. Red curve is a Poisson curve with rate = median count rate of data. |
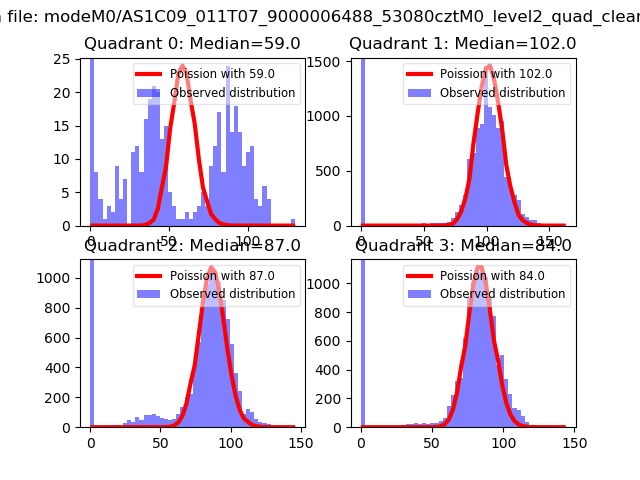 |
 |
| Quadrant-wise count rates Data is divided into 100 sec bins |
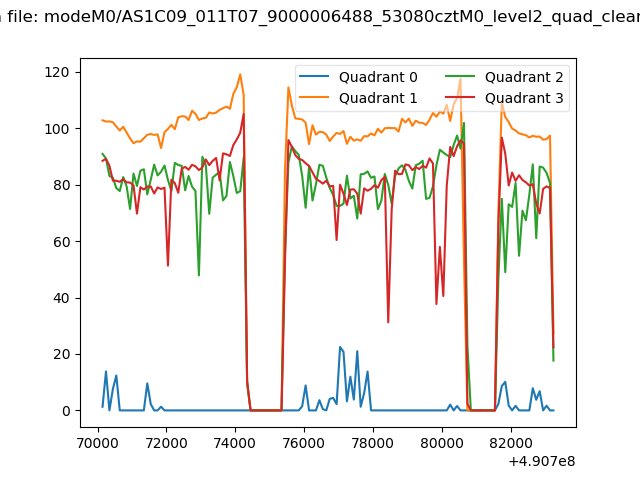 |
|
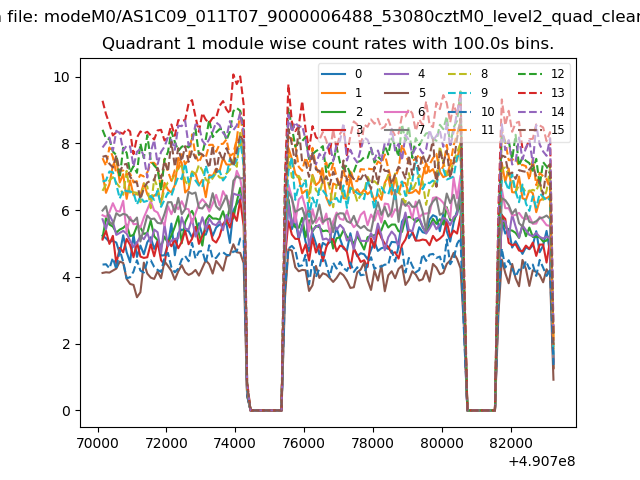
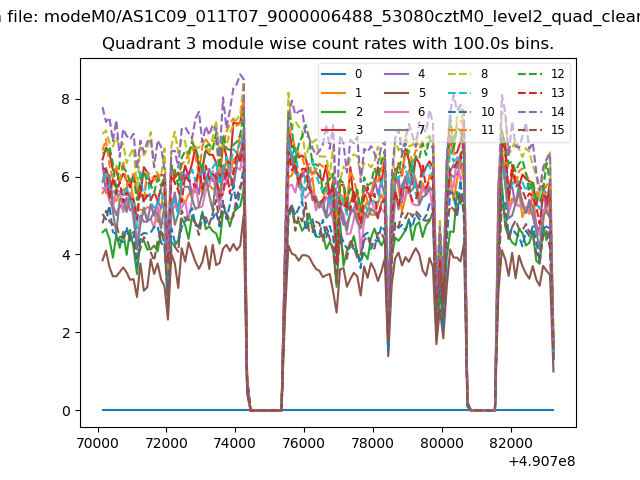
| Module-wise count rates for Quadrant A Data is divided into 100 sec bins |
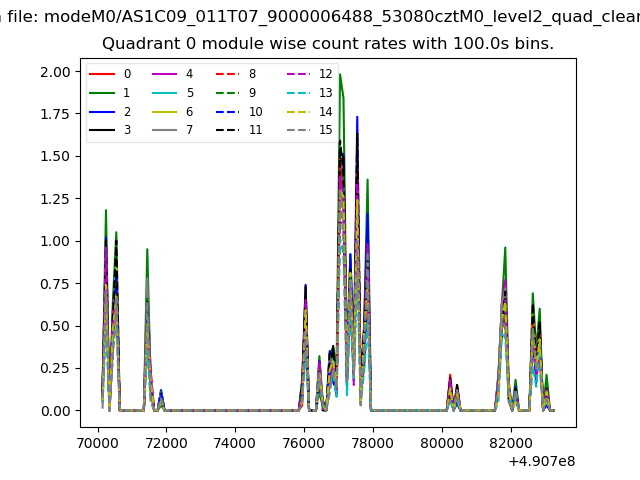 |
 |
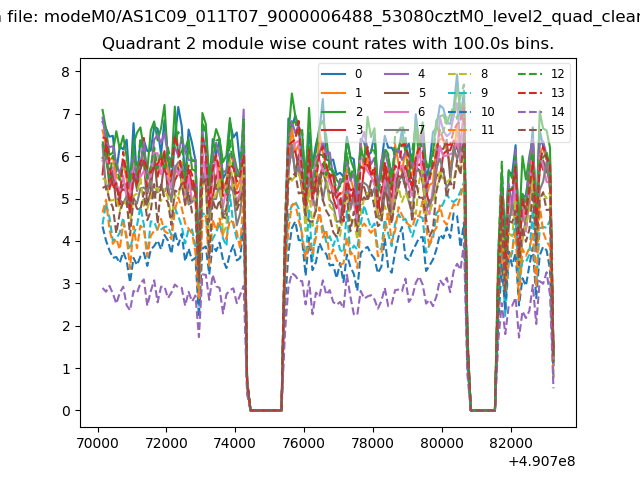
| Module-wise count rates for Quadrant B Data is divided into 100 sec bins |
 |
 |
| Module-wise count rates for Quadrant C Data is divided into 100 sec bins |
 |
 |
| Module-wise count rates for Quadrant D Data is divided into 100 sec bins |
 |
 |
| Parameter | Plot |
|---|---|
| CZT HV Monitor | 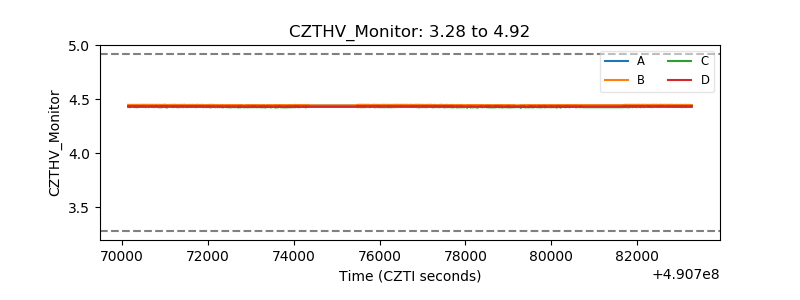 |
| D_VDD | 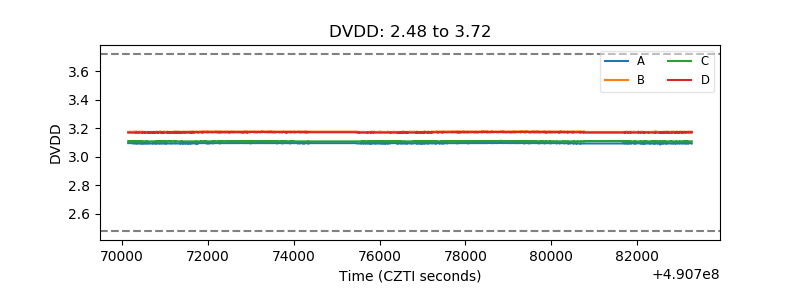 |
| Temperature 1 | 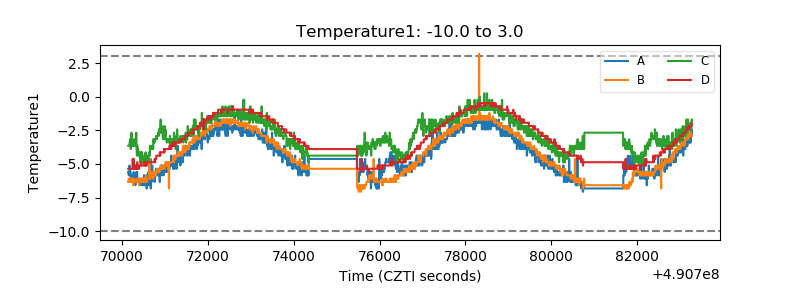 |
| Veto HV Monitor | 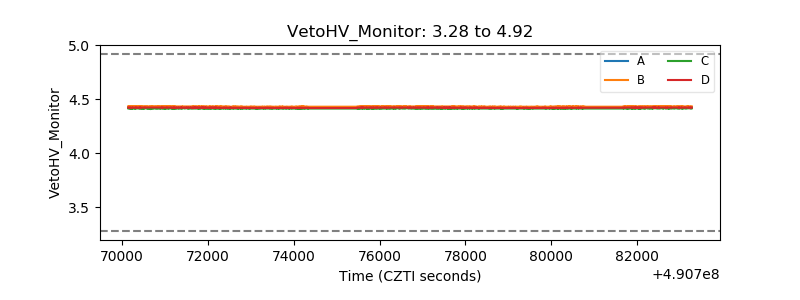 |
| Veto LLD | 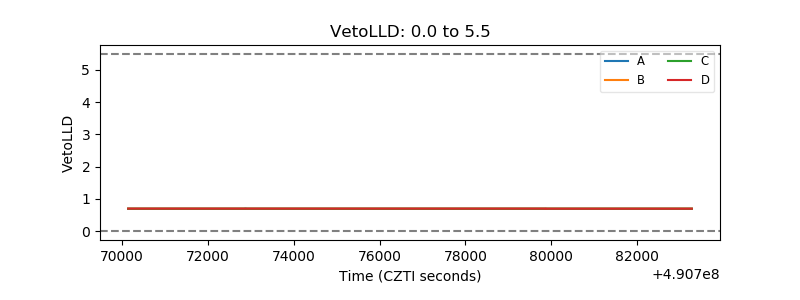 |
| Alpha Counter | 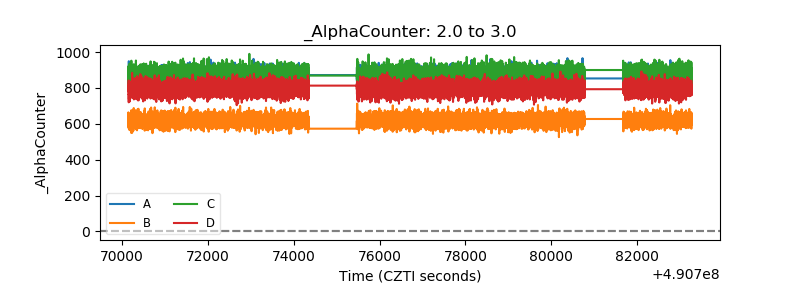 |
| _CPM_Rate | 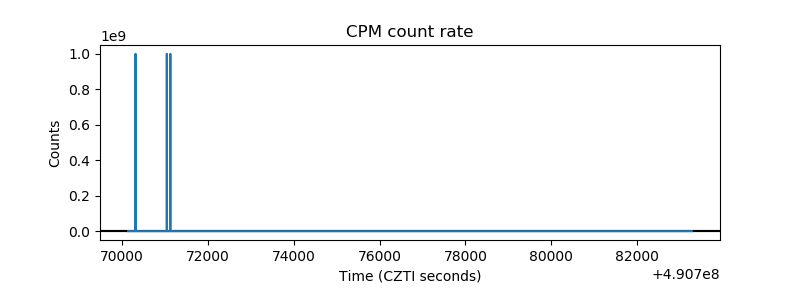 |
| CZT Counter | 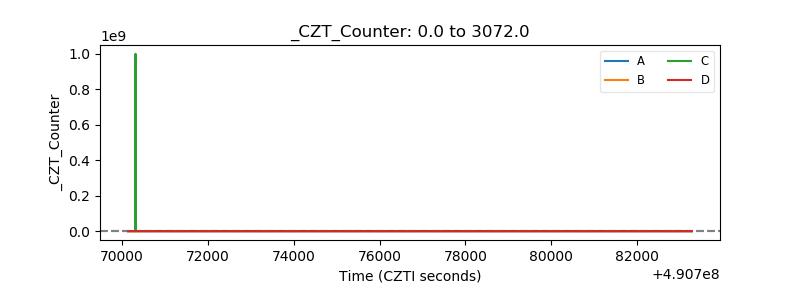 |
| +2.5 Volts monitor |  |
| +5 Volts monitor |  |
| _ROLL_ROT | 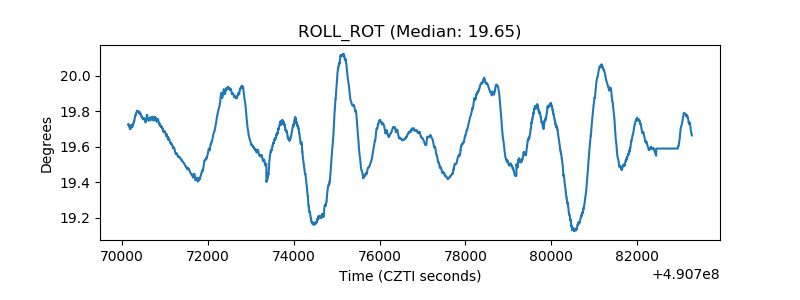 |
| _Roll_DEC | 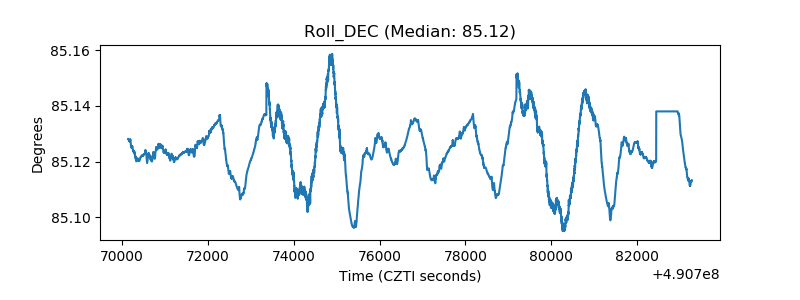 |
| _Roll_RA | 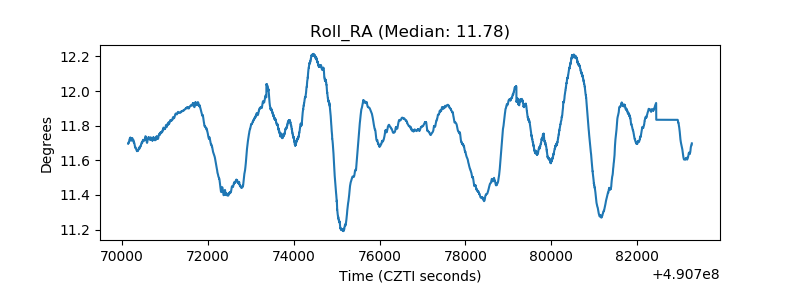 |
| Veto Counter | 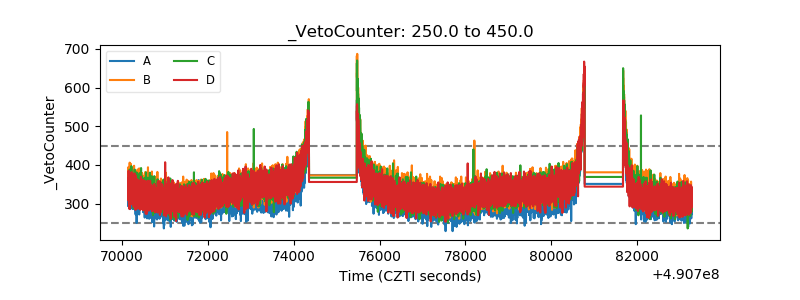 |