| Param | Original file | Final file |
|---|---|---|
| Filename | modeM0/AS1C09_011T07_9000006488_53081cztM0_level2.fits | modeM0/AS1C09_011T07_9000006488_53081cztM0_level2_quad_clean.evt |
| Size (bytes) | 806,129,280 | 75,464,640 |
| Size | 768.8 MB | 72.0 MB |
| Events in quadrant A | 15,189,274 | 103,645 |
| Events in quadrant B | 3,151,365 | 656,260 |
| Events in quadrant C | 6,882,265 | 519,399 |
| Events in quadrant D | 4,106,144 | 546,505 |
| Mode SS | |||
|---|---|---|---|
| Quadrant | BADHDUFLAG | Total packets | Discarded packets |
| A | 0 | 132 | 0 |
| B | 0 | 132 | 0 |
| C | 0 | 132 | 0 |
| D | 0 | 132 | 0 |
| Mode M9 | |||
|---|---|---|---|
| Quadrant | BADHDUFLAG | Total packets | Discarded packets |
| A | 0 | 6 | 0 |
| B | 0 | 6 | 0 |
| C | 0 | 6 | 0 |
| D | 0 | 6 | 0 |
| Mode M0 | |||
|---|---|---|---|
| Quadrant | BADHDUFLAG | Total packets | Discarded packets |
| A | 0 | 49548 | 3 |
| B | 0 | 14192 | 1 |
| C | 0 | 25112 | 1 |
| D | 0 | 16933 | 1 |
| Quadrant | Total seconds | Saturated seconds | Saturation percentage |
|---|---|---|---|
| A | 6584 | 5732 | 87.059538% |
| B | 6585 | 103 | 1.564161% |
| C | 6585 | 1012 | 15.368261% |
| D | 6585 | 243 | 3.690205% |
Noise dominated data is calculated using 1-second bins in cleaned event files. If a bin has >2000 counts, and if more than 50% of those come from <1% of pixels, then it is considered to be noise-dominated and hence unusable.
| Quadrant | # 1 sec bins | Bins with >0 counts | Bins with >2000 counts | High rate bins dominated by noise | Noise dominated (total time) | Noise dominated (detector-on time) | Marked lightcurve |
|---|---|---|---|---|---|---|---|
| A | 7128 | 6583 | 4887 | 4887 | 68.56% | 74.24% | 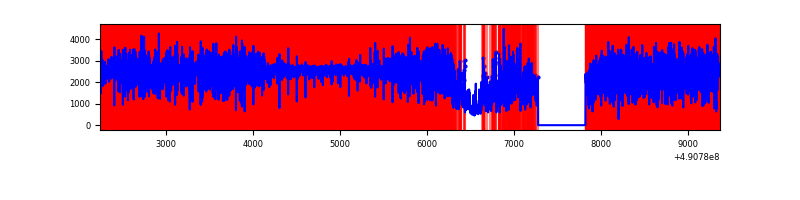 |
| B | 7130 | 6586 | 16 | 16 | 0.22% | 0.24% | 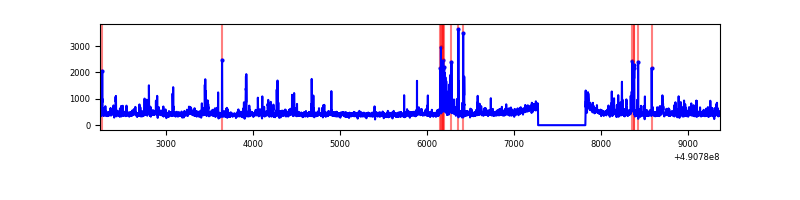 |
| C | 7130 | 6586 | 800 | 800 | 11.22% | 12.15% | 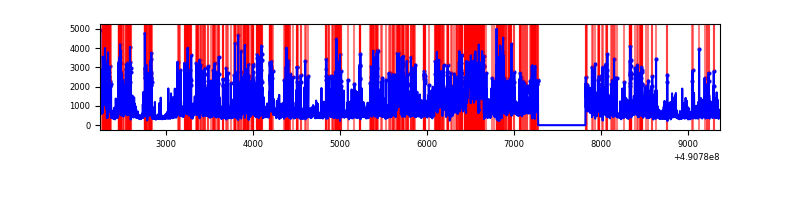 |
| D | 7130 | 6586 | 159 | 159 | 2.23% | 2.41% | 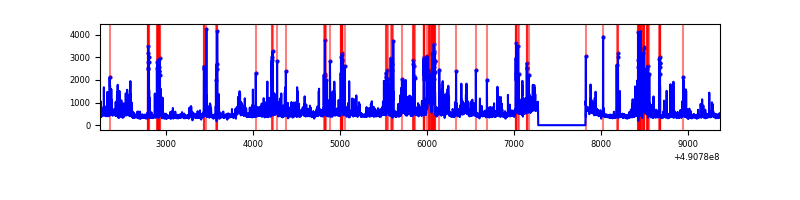 |
Top three noisy pixels from each quadrant. If the there are fewer than three noisy pixels in the level2.evt file, extra rows are filled as -1
| Pixel properties | Quadrant properties | ||||||
|---|---|---|---|---|---|---|---|
| Quadrant | DetID | PixID | Counts | Sigma | Mean | Median | Sigma |
| A | 9 | 191 | 12847488 | 136751.19 | 371 | 363 | 93.9 |
| A | 0 | 250 | 254870 | 2709.1 | 371 | 363 | 93.9 |
| A | 0 | 8 | 122696 | 1302.17 | 371 | 363 | 93.9 |
| B | 0 | 213 | 121222 | 837.45 | 671 | 649 | 144.0 |
| B | 1 | 255 | 113688 | 785.12 | 671 | 649 | 144.0 |
| B | 4 | 81 | 84923 | 585.33 | 671 | 649 | 144.0 |
| C | 15 | 224 | 2860602 | 17096.53 | 613 | 608 | 167.3 |
| C | 1 | 241 | 456007 | 2722.29 | 613 | 608 | 167.3 |
| C | 9 | 38 | 358969 | 2142.22 | 613 | 608 | 167.3 |
| D | 12 | 17 | 613509 | 3339.43 | 650 | 621 | 183.5 |
| D | 11 | 245 | 300541 | 1634.17 | 650 | 621 | 183.5 |
| D | 2 | 153 | 119550 | 648.01 | 650 | 621 | 183.5 |
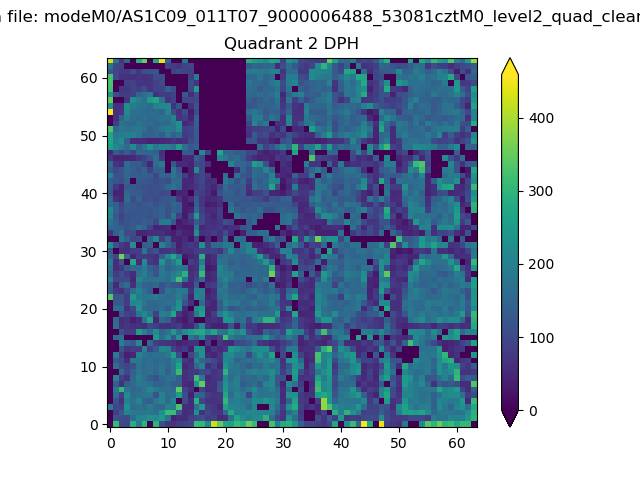
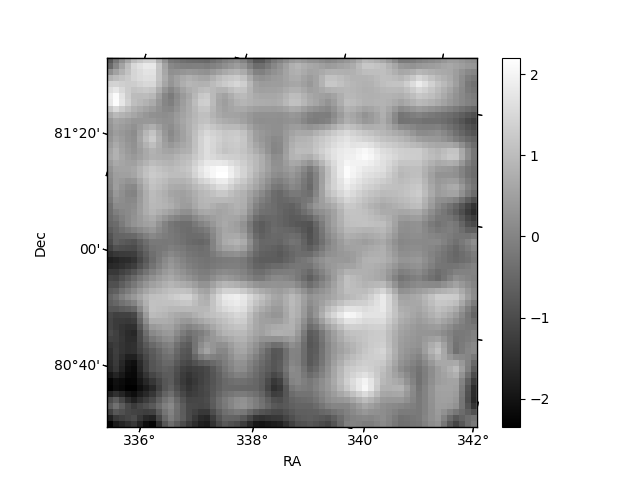
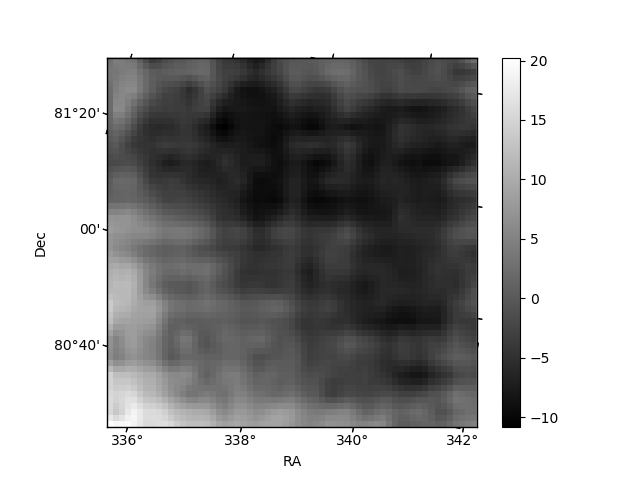
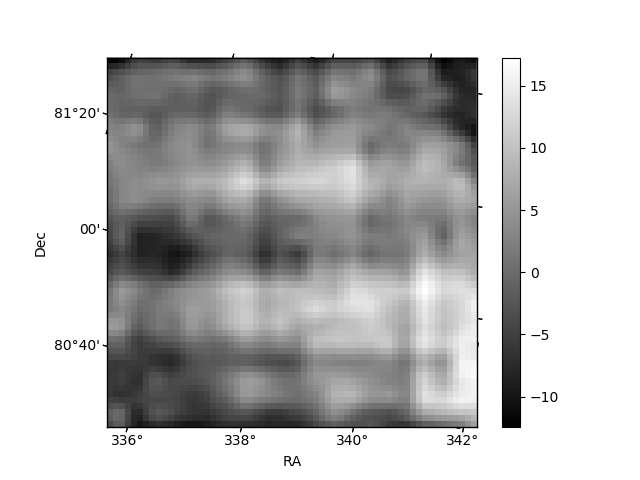
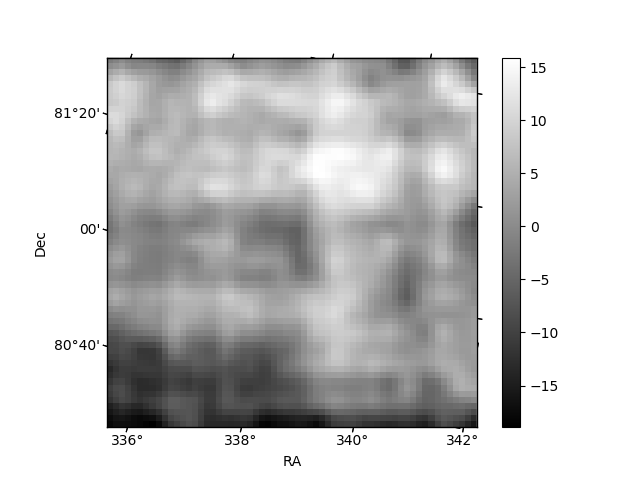
Histogram calculated using DETX and DETY for each event in the final _common_clean file
| Quadrant A | 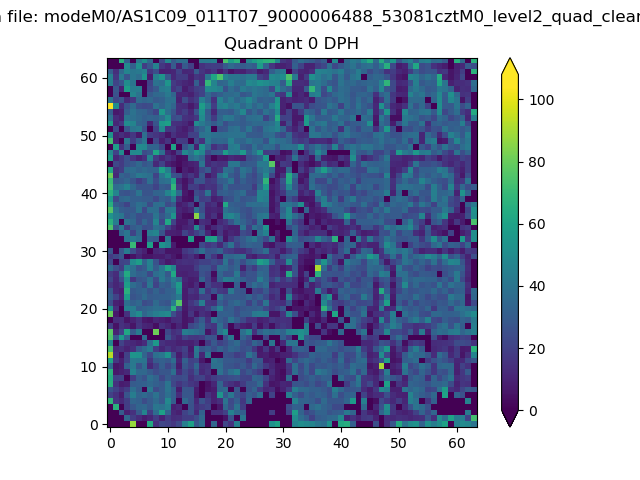 |
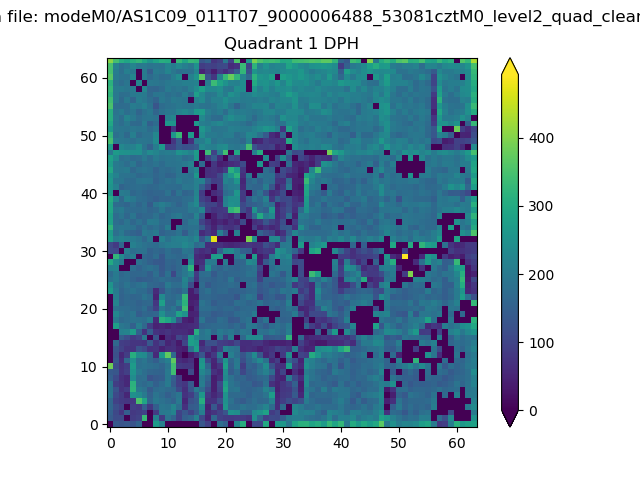 |
Quadrant B |
|---|---|---|---|
| Quadrant D | 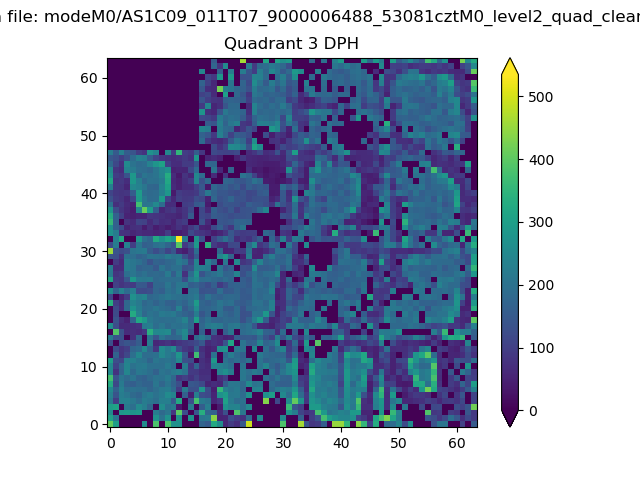 |
 |
Quadrant C |
| Plot type | Count rate plots | Images |
|---|---|---|
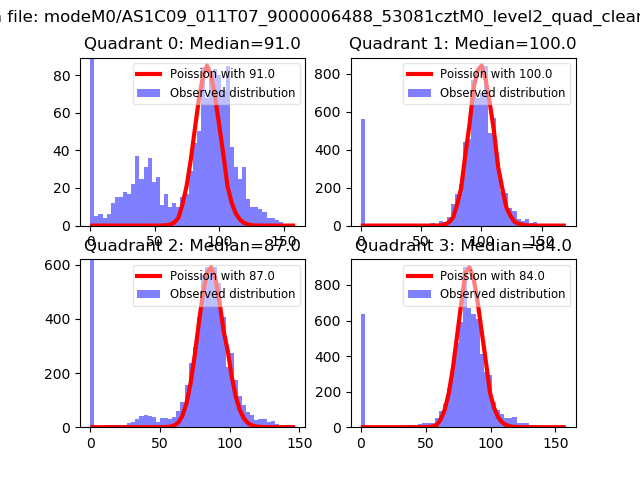
| Comparison with Poisson distribution Blue bars denote a histogram of data divided into 1 sec bins. Red curve is a Poisson curve with rate = median count rate of data. |
 |
 |
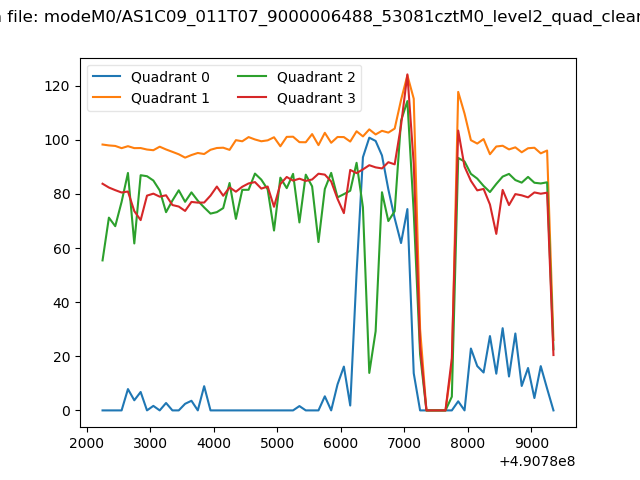
| Quadrant-wise count rates Data is divided into 100 sec bins |
 |
|
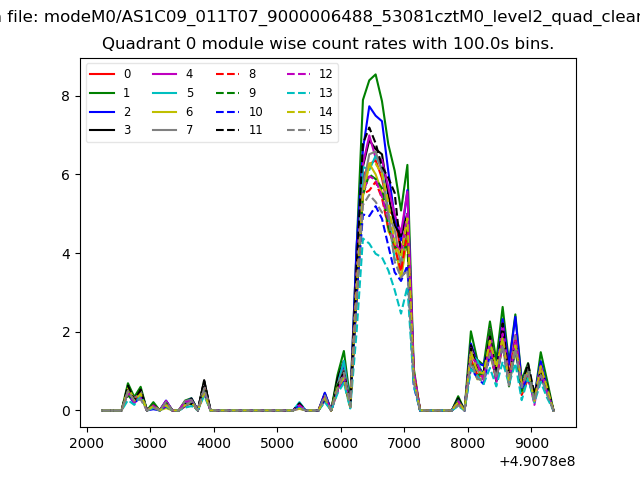
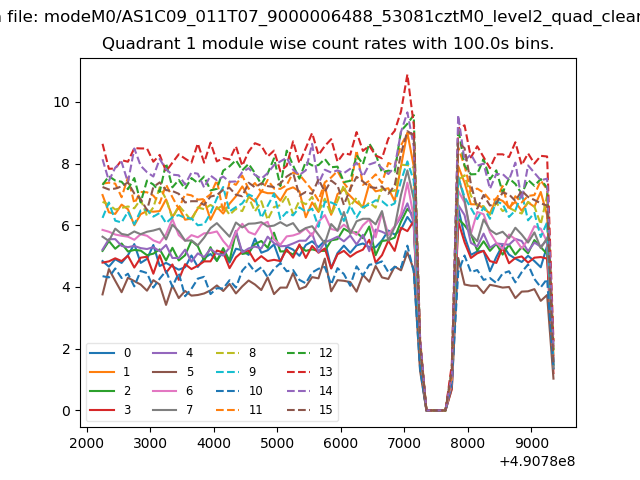
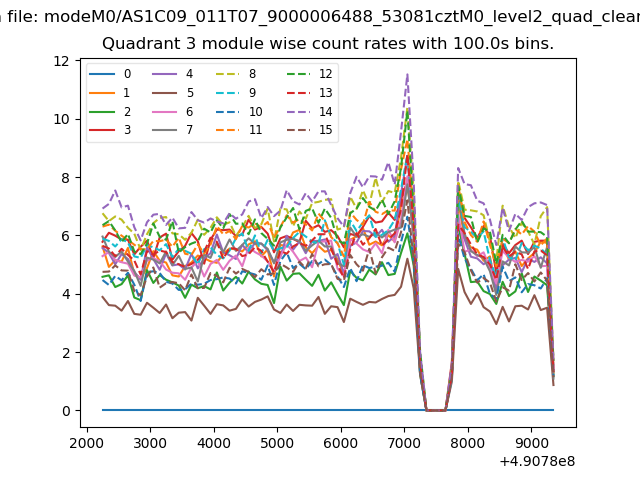
| Module-wise count rates for Quadrant A Data is divided into 100 sec bins |
 |
 |
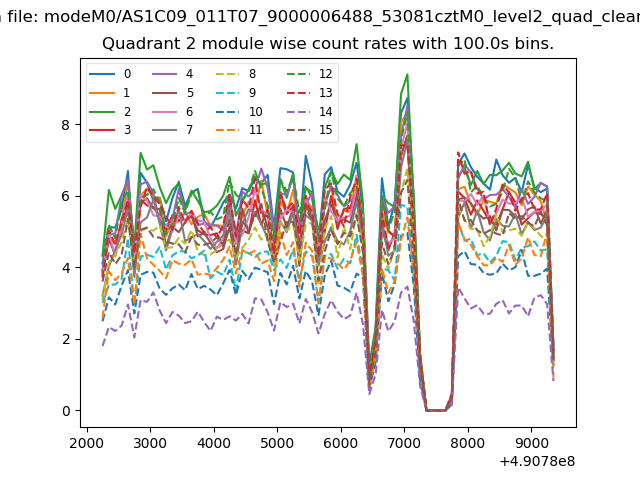
| Module-wise count rates for Quadrant B Data is divided into 100 sec bins |
 |
 |
| Module-wise count rates for Quadrant C Data is divided into 100 sec bins |
 |
 |
| Module-wise count rates for Quadrant D Data is divided into 100 sec bins |
 |
 |
| Parameter | Plot |
|---|---|
| CZT HV Monitor | 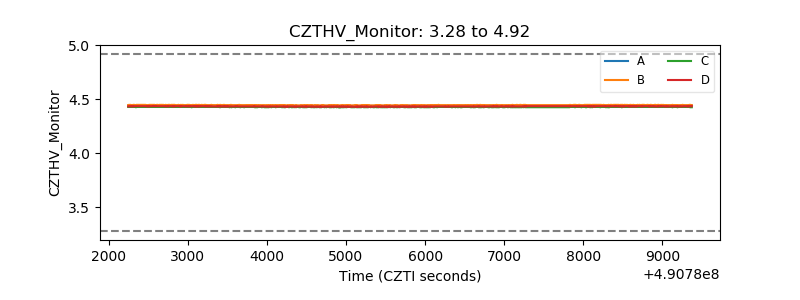 |
| D_VDD | 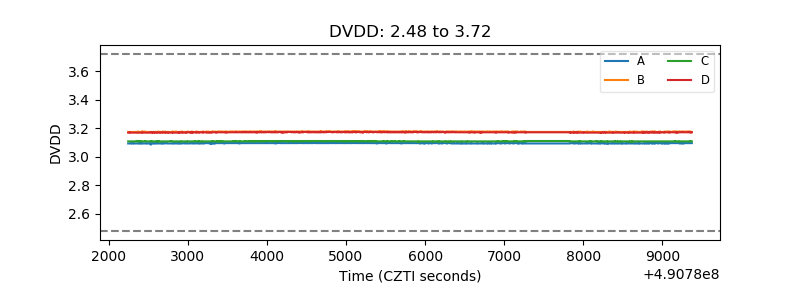 |
| Temperature 1 | 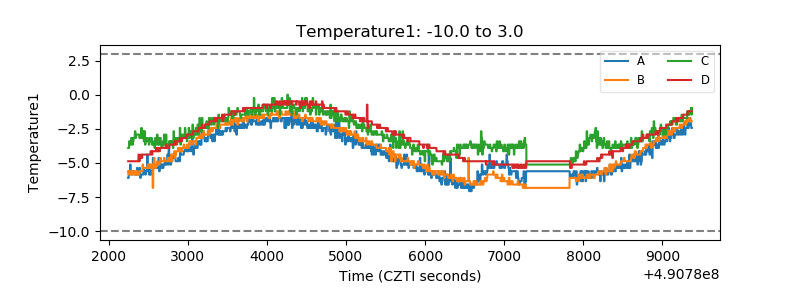 |
| Veto HV Monitor |  |
| Veto LLD | 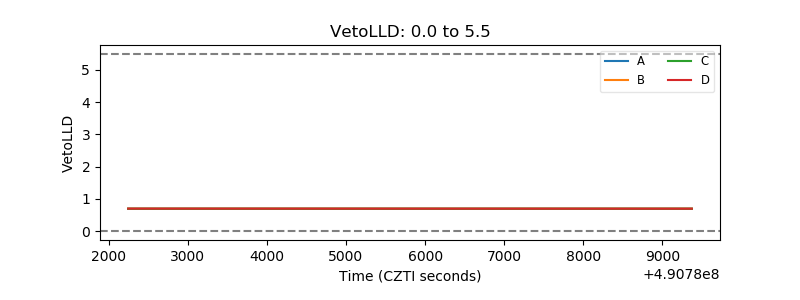 |
| Alpha Counter | 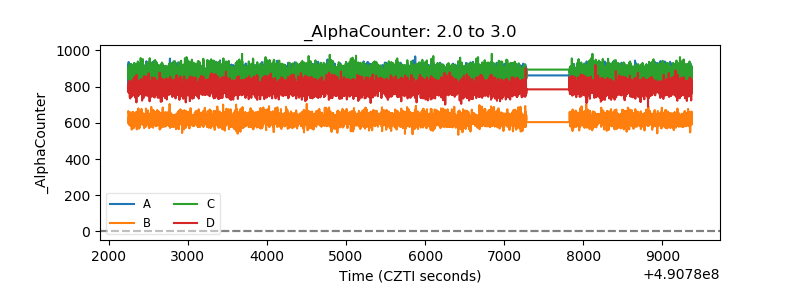 |
| _CPM_Rate | 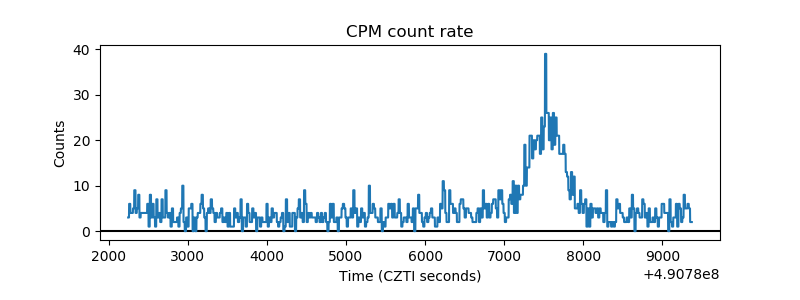 |
| CZT Counter | 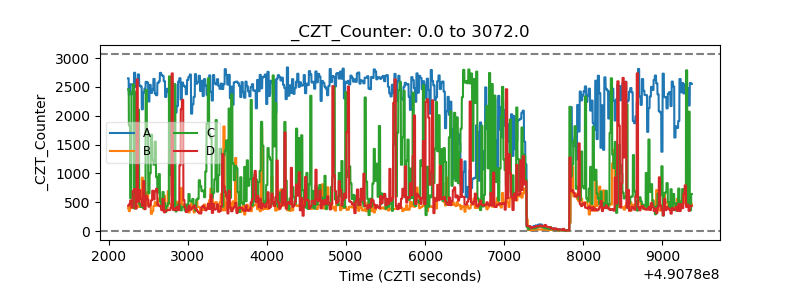 |
| +2.5 Volts monitor |  |
| +5 Volts monitor | 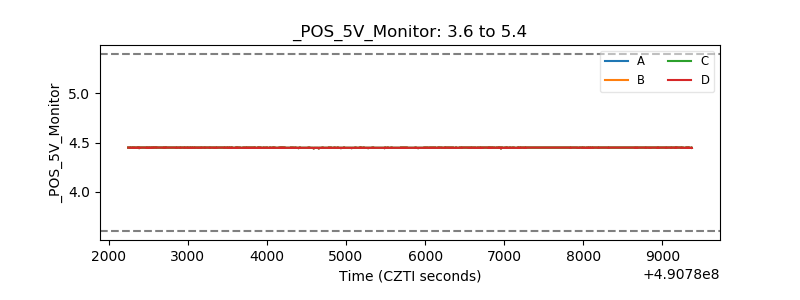 |
| _ROLL_ROT | 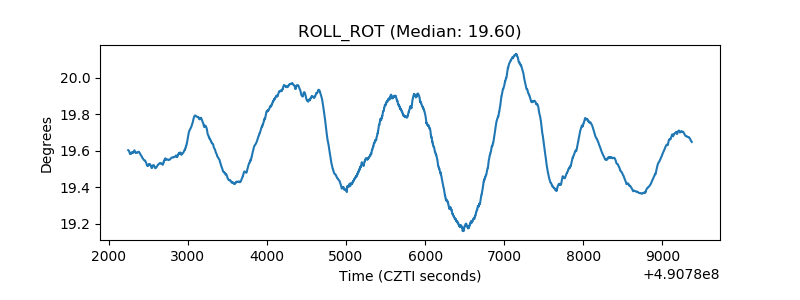 |
| _Roll_DEC | 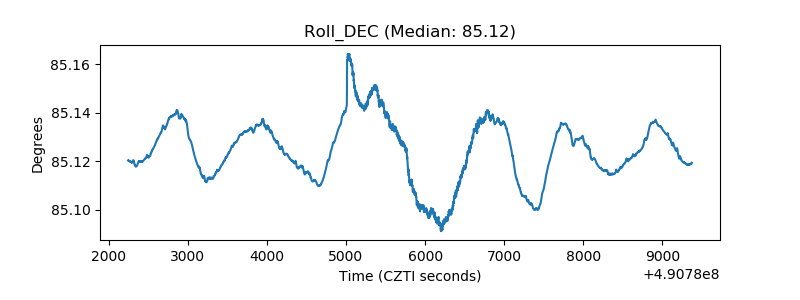 |
| _Roll_RA | 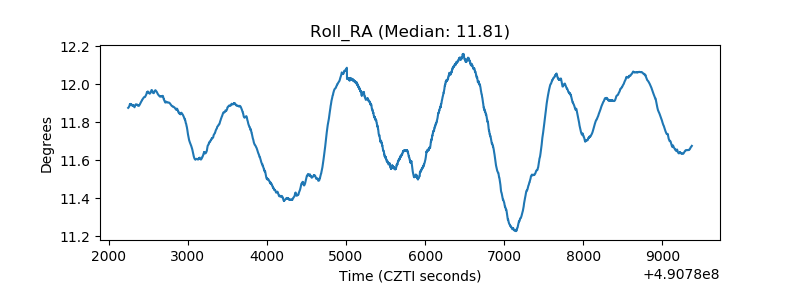 |
| Veto Counter | 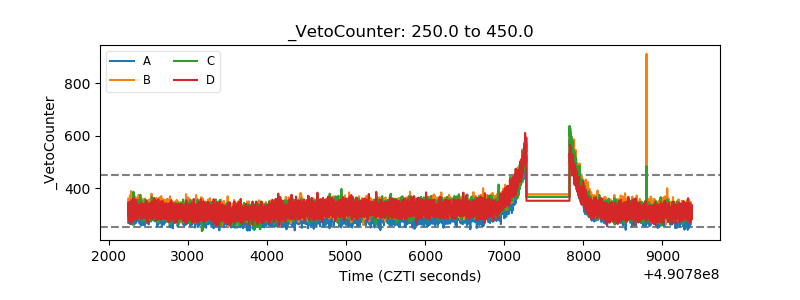 |