| Param | Original file | Final file |
|---|---|---|
| Filename | modeM0/AS1C09_011T07_9000006488_53082cztM0_level2.fits | modeM0/AS1C09_011T07_9000006488_53082cztM0_level2_quad_clean.evt |
| Size (bytes) | 940,841,280 | 84,107,520 |
| Size | 897.3 MB | 80.2 MB |
| Events in quadrant A | 17,539,542 | 88,819 |
| Events in quadrant B | 4,054,307 | 740,358 |
| Events in quadrant C | 7,202,438 | 612,191 |
| Events in quadrant D | 5,450,636 | 584,937 |
| Mode SS | |||
|---|---|---|---|
| Quadrant | BADHDUFLAG | Total packets | Discarded packets |
| A | 0 | 148 | 0 |
| B | 0 | 148 | 0 |
| C | 0 | 148 | 0 |
| D | 0 | 148 | 0 |
| Mode M0 | |||
|---|---|---|---|
| Quadrant | BADHDUFLAG | Total packets | Discarded packets |
| A | 0 | 57150 | 0 |
| B | 0 | 17460 | 0 |
| C | 0 | 26644 | 2 |
| D | 0 | 21511 | 0 |
| Quadrant | Total seconds | Saturated seconds | Saturation percentage |
|---|---|---|---|
| A | 7478 | 6816 | 91.147366% |
| B | 7478 | 146 | 1.952394% |
| C | 7477 | 834 | 11.154206% |
| D | 7478 | 628 | 8.397967% |
Noise dominated data is calculated using 1-second bins in cleaned event files. If a bin has >2000 counts, and if more than 50% of those come from <1% of pixels, then it is considered to be noise-dominated and hence unusable.
| Quadrant | # 1 sec bins | Bins with >0 counts | Bins with >2000 counts | High rate bins dominated by noise | Noise dominated (total time) | Noise dominated (detector-on time) | Marked lightcurve |
|---|---|---|---|---|---|---|---|
| A | 7477 | 7477 | 5643 | 5643 | 75.47% | 75.47% | 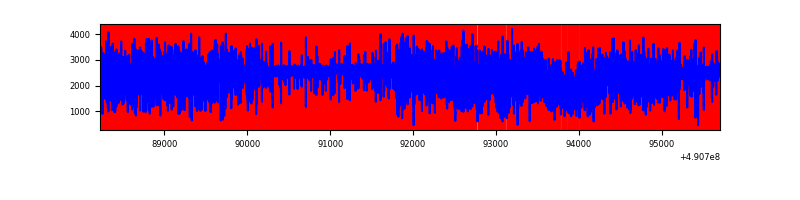 |
| B | 7478 | 7478 | 104 | 104 | 1.39% | 1.39% | 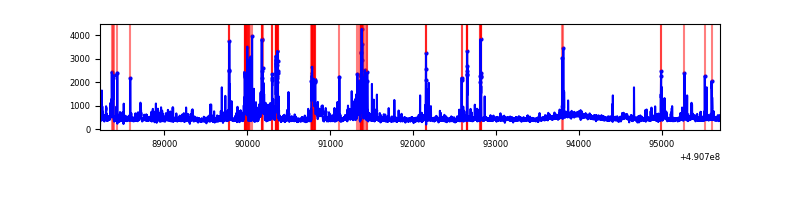 |
| C | 7477 | 7477 | 668 | 668 | 8.93% | 8.93% | 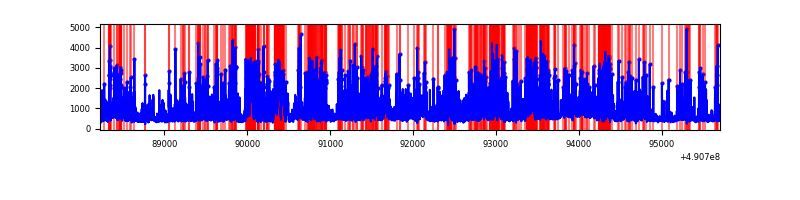 |
| D | 7478 | 7478 | 504 | 504 | 6.74% | 6.74% | 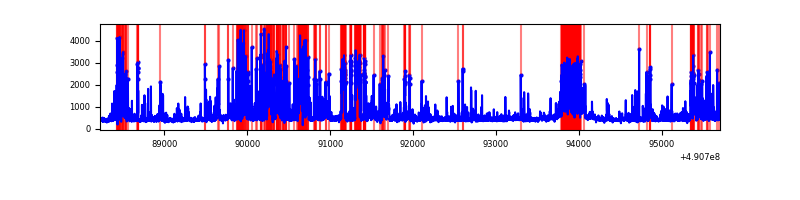 |
Top three noisy pixels from each quadrant. If the there are fewer than three noisy pixels in the level2.evt file, extra rows are filled as -1
| Pixel properties | Quadrant properties | ||||||
|---|---|---|---|---|---|---|---|
| Quadrant | DetID | PixID | Counts | Sigma | Mean | Median | Sigma |
| A | 9 | 191 | 14970199 | 135857.5 | 438 | 426 | 110.2 |
| A | 3 | 14 | 305355 | 2767.37 | 438 | 426 | 110.2 |
| A | 0 | 250 | 101728 | 919.36 | 438 | 426 | 110.2 |
| B | 10 | 247 | 324826 | 2013.4 | 762 | 737 | 161.0 |
| B | 1 | 255 | 204994 | 1268.94 | 762 | 737 | 161.0 |
| B | 14 | 32 | 154647 | 956.16 | 762 | 737 | 161.0 |
| C | 15 | 224 | 3052960 | 15654.76 | 714 | 705 | 195.0 |
| C | 12 | 252 | 447787 | 2293.04 | 714 | 705 | 195.0 |
| C | 13 | 3 | 228959 | 1170.69 | 714 | 705 | 195.0 |
| D | 12 | 17 | 843521 | 4133.36 | 718 | 686 | 203.9 |
| D | 2 | 249 | 527136 | 2581.77 | 718 | 686 | 203.9 |
| D | 8 | 176 | 368948 | 1806.0 | 718 | 686 | 203.9 |
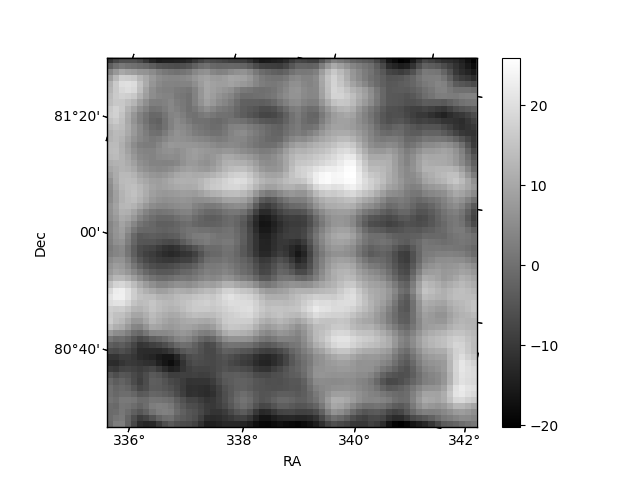
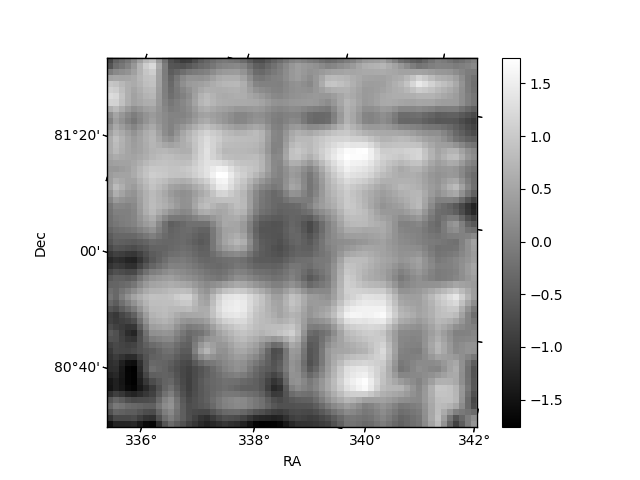
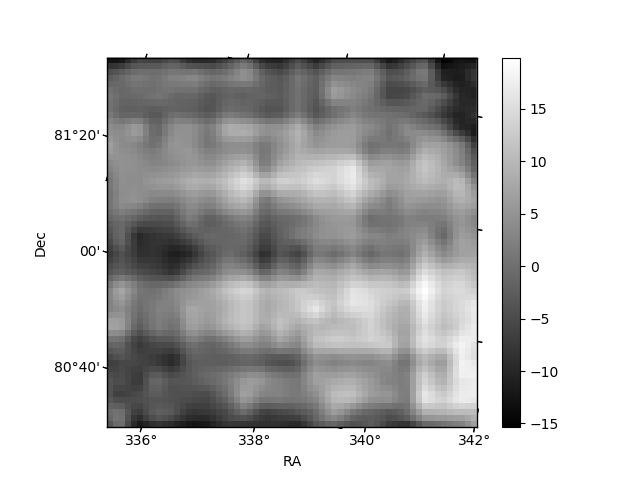
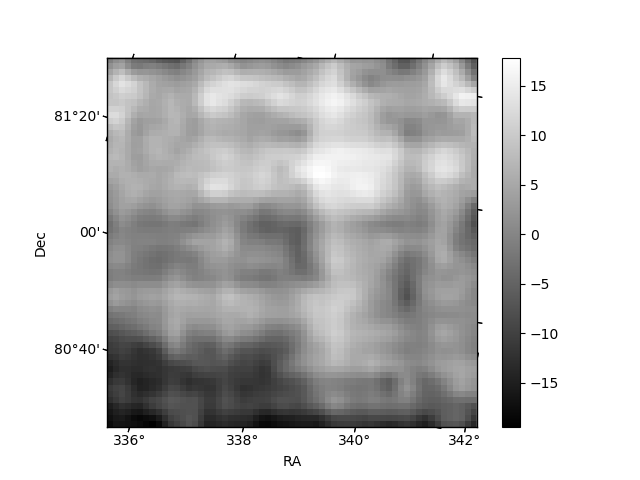
Histogram calculated using DETX and DETY for each event in the final _common_clean file
| Quadrant A | 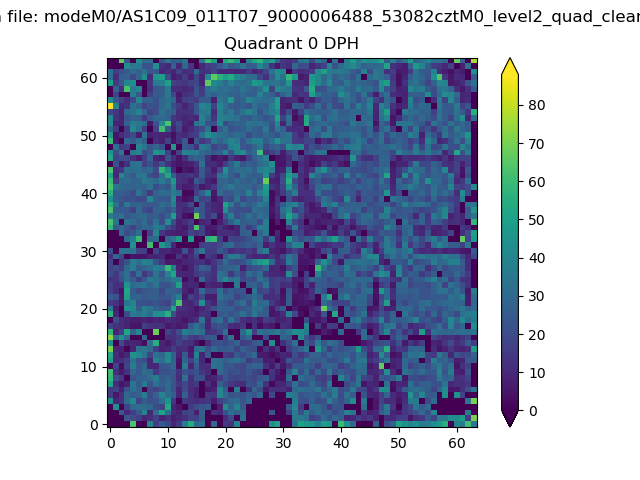 |
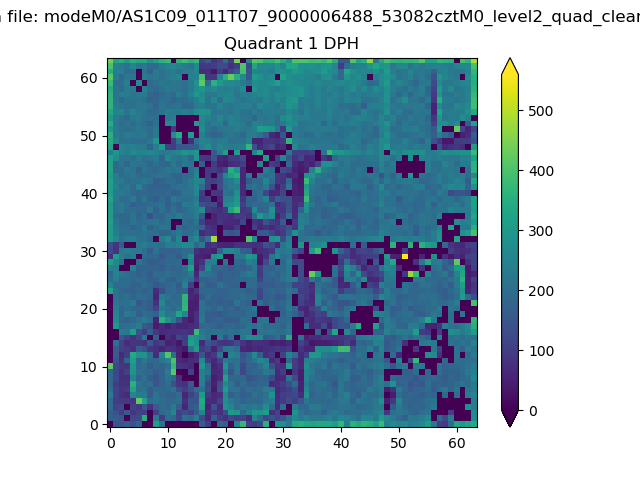 |
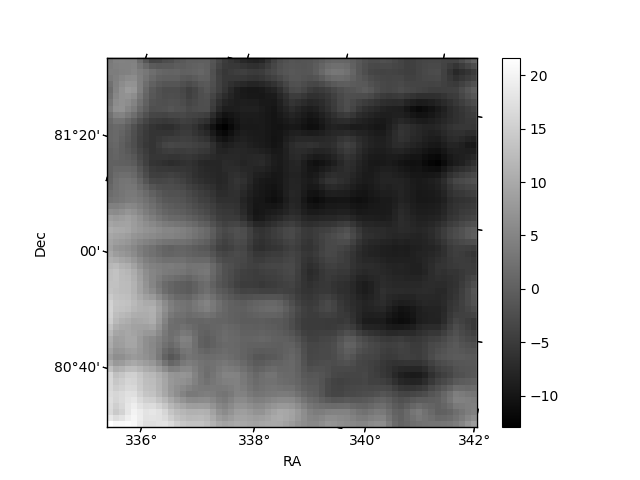
Quadrant B |
|---|---|---|---|
| Quadrant D | 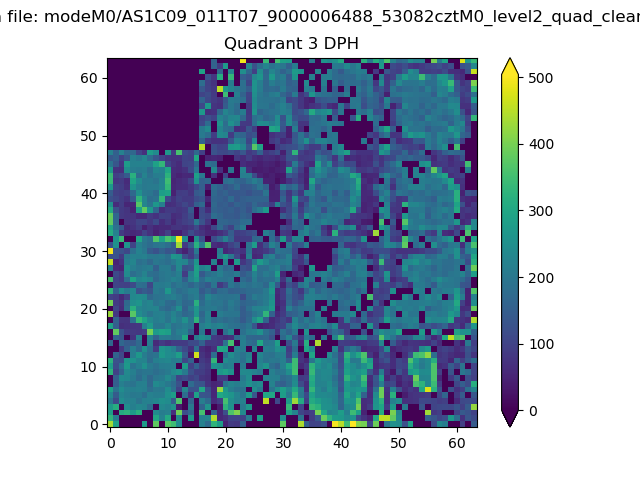 |
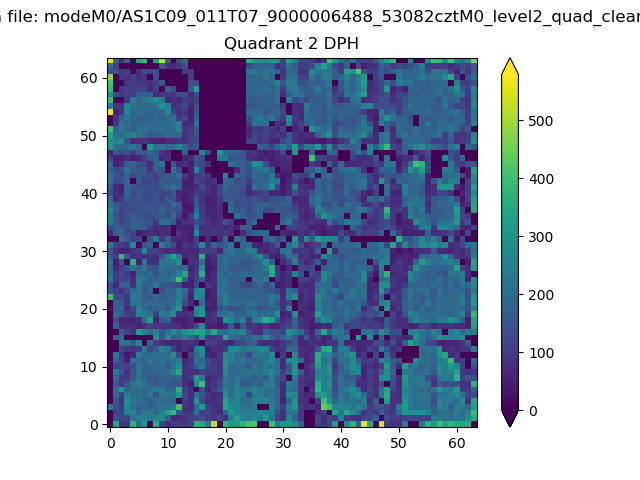 |
Quadrant C |
| Plot type | Count rate plots | Images |
|---|---|---|
| Comparison with Poisson distribution Blue bars denote a histogram of data divided into 1 sec bins. Red curve is a Poisson curve with rate = median count rate of data. |
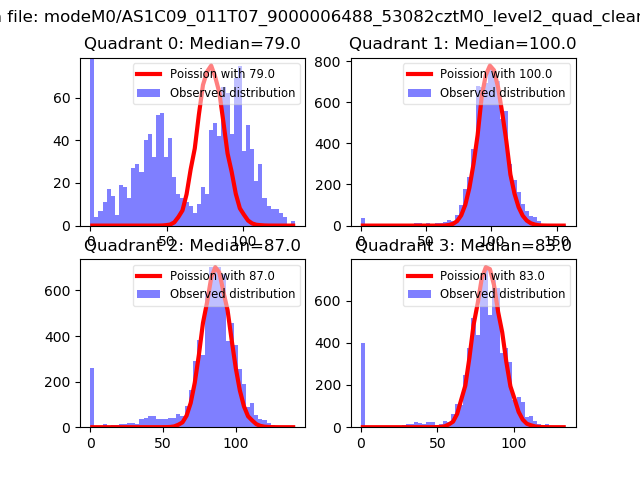 |
 |
| Quadrant-wise count rates Data is divided into 100 sec bins |
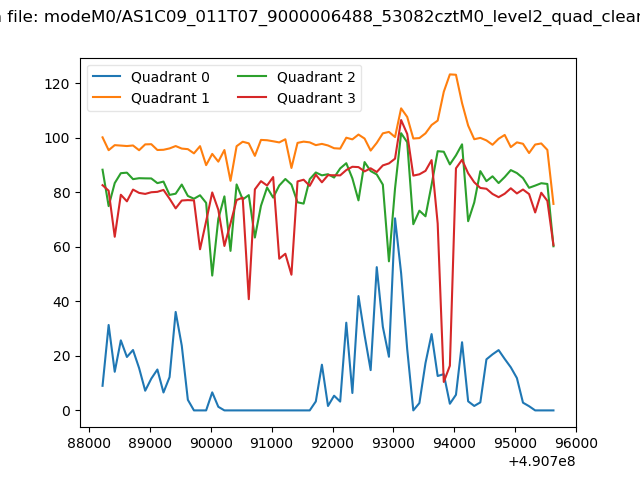 |
|
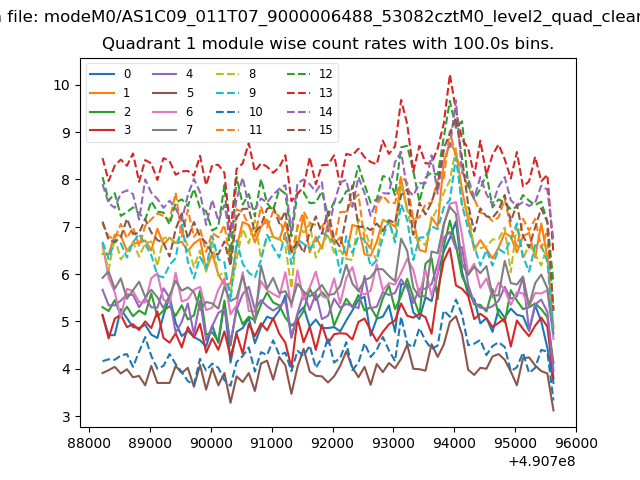
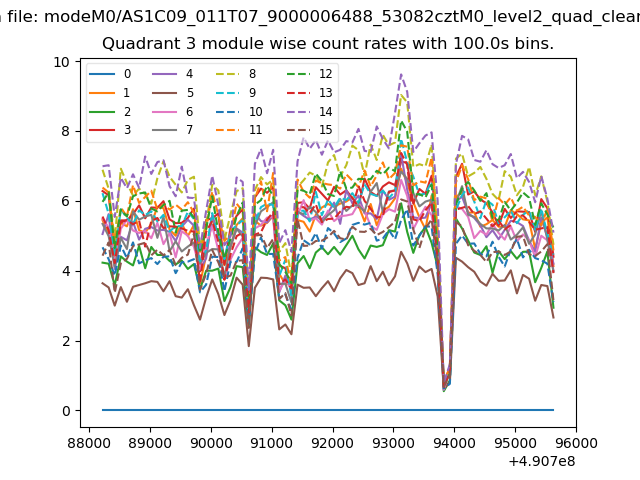
| Module-wise count rates for Quadrant A Data is divided into 100 sec bins |
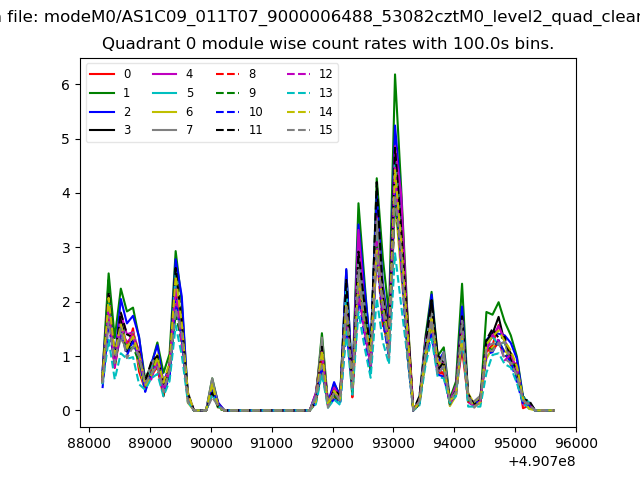 |
 |
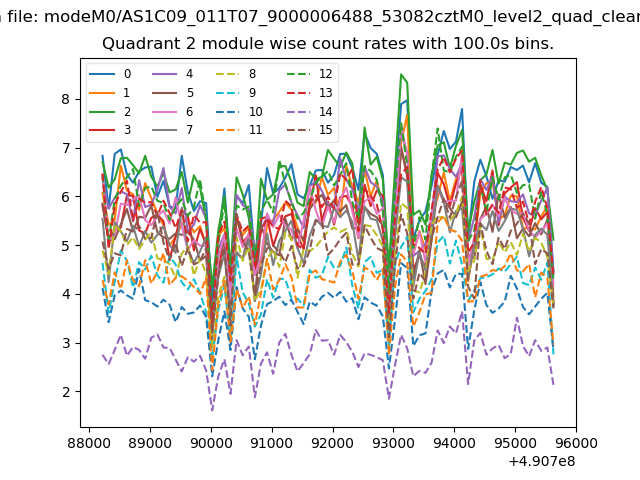
| Module-wise count rates for Quadrant B Data is divided into 100 sec bins |
 |
 |
| Module-wise count rates for Quadrant C Data is divided into 100 sec bins |
 |
 |
| Module-wise count rates for Quadrant D Data is divided into 100 sec bins |
 |
 |
| Parameter | Plot |
|---|---|
| CZT HV Monitor | 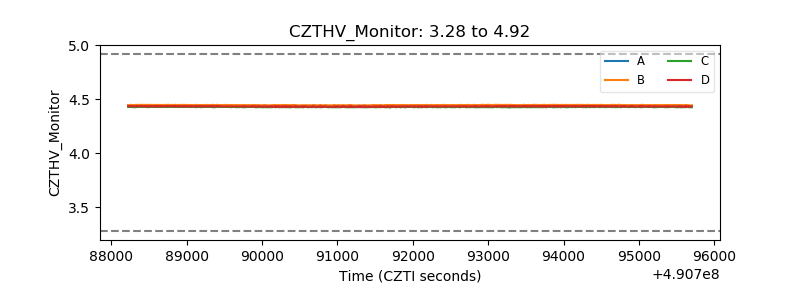 |
| D_VDD | 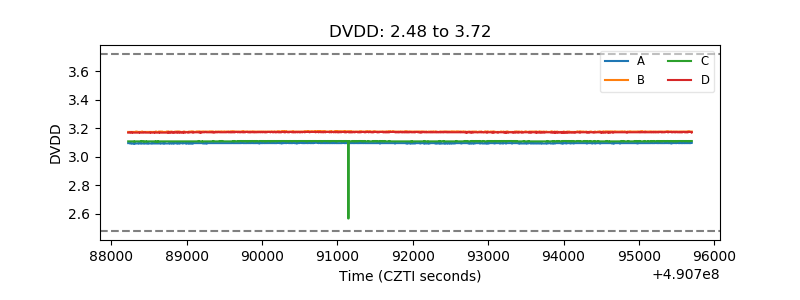 |
| Temperature 1 | 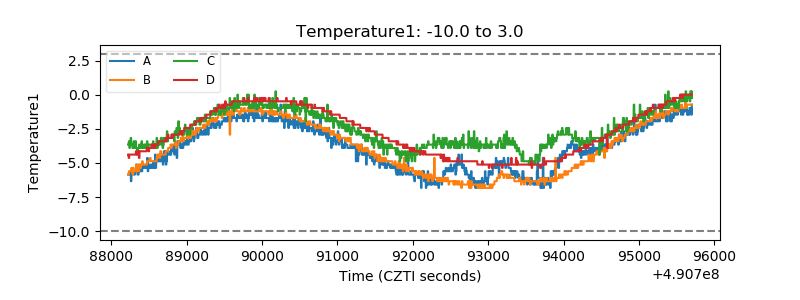 |
| Veto HV Monitor | 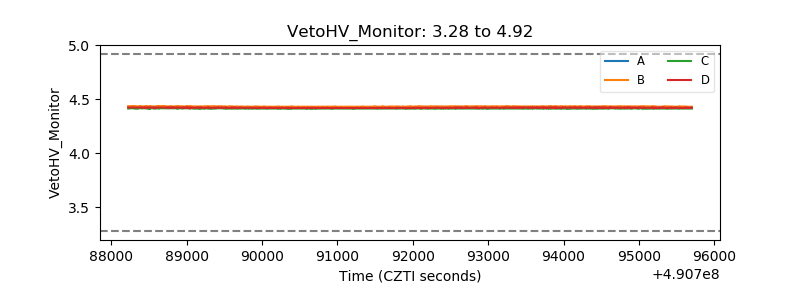 |
| Veto LLD | 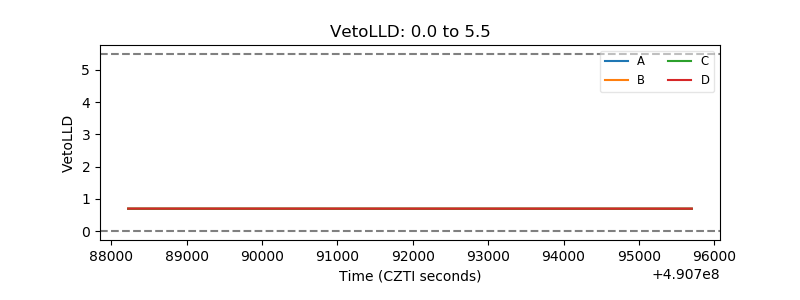 |
| Alpha Counter | 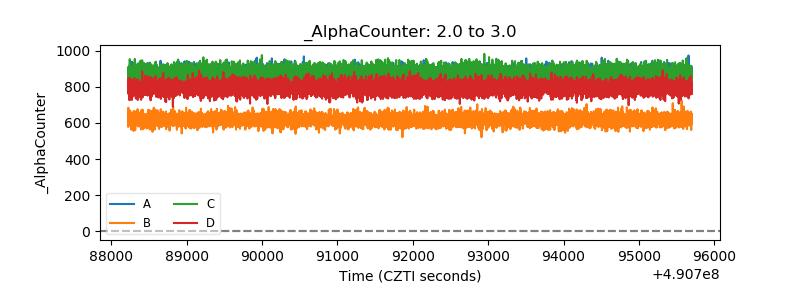 |
| _CPM_Rate | 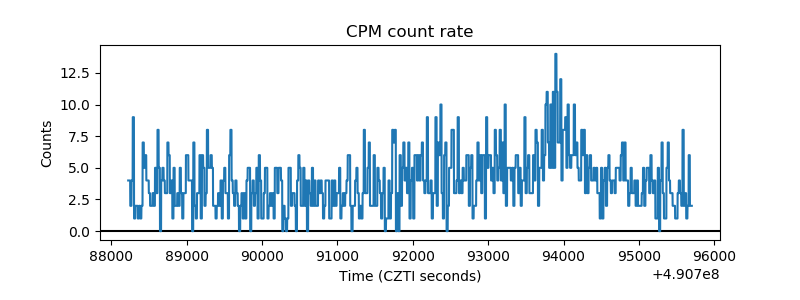 |
| CZT Counter | 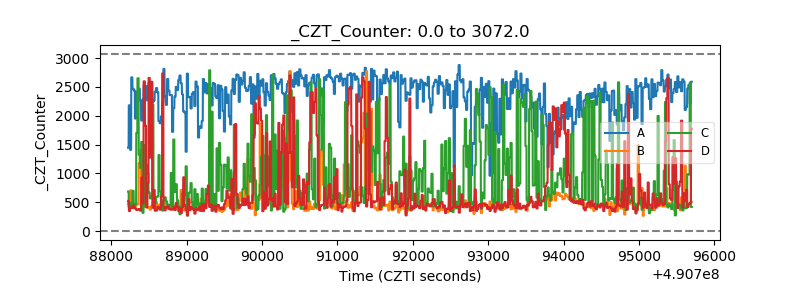 |
| +2.5 Volts monitor | 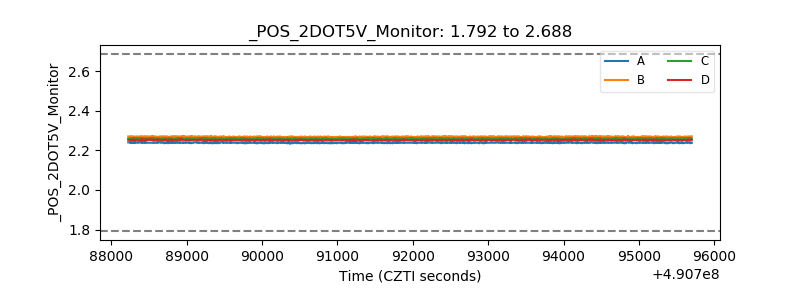 |
| +5 Volts monitor | 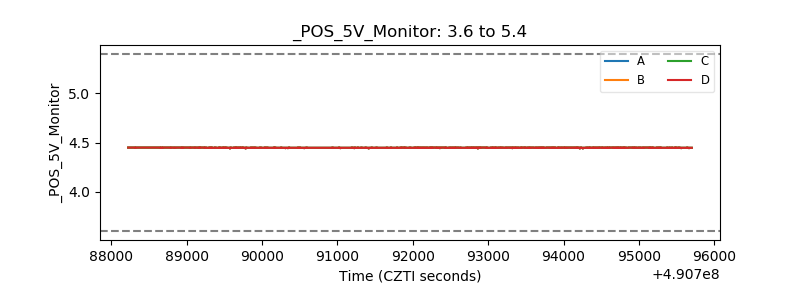 |
| _ROLL_ROT | 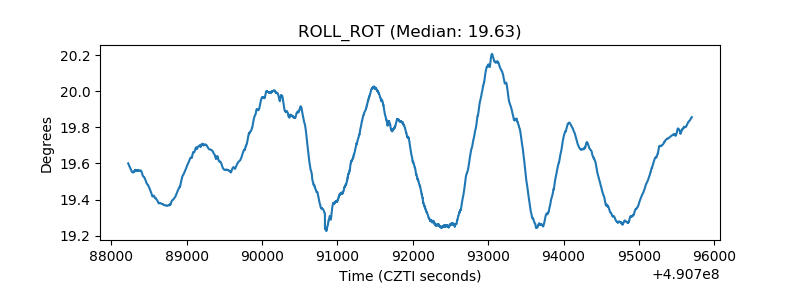 |
| _Roll_DEC | 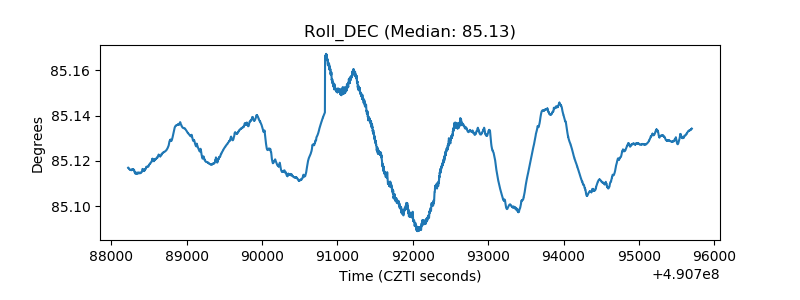 |
| _Roll_RA | 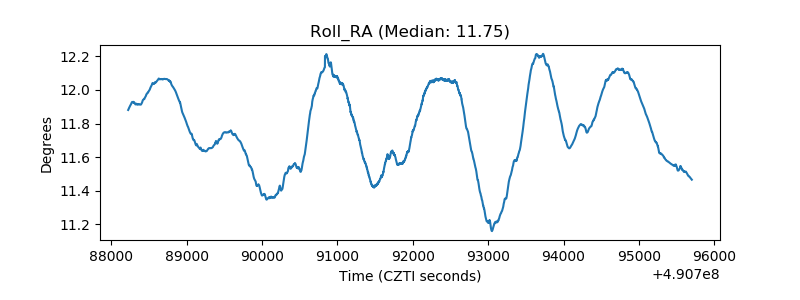 |
| Veto Counter | 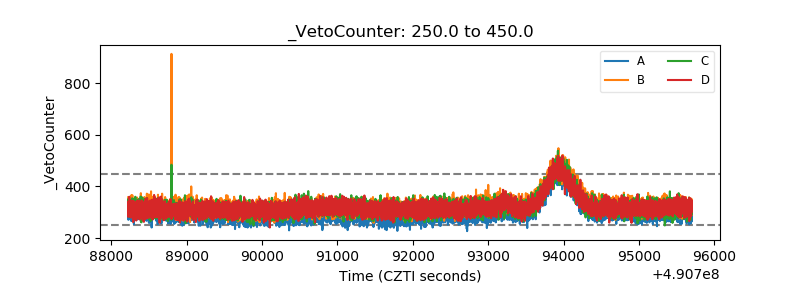 |