| Param | Original file | Final file |
|---|---|---|
| Filename | modeM0/AS1C09_011T07_9000006488_53083cztM0_level2.fits | modeM0/AS1C09_011T07_9000006488_53083cztM0_level2_quad_clean.evt |
| Size (bytes) | 1,096,652,160 | 77,834,880 |
| Size | 1.0 GB | 74.2 MB |
| Events in quadrant A | 17,783,026 | 95,334 |
| Events in quadrant B | 5,955,016 | 694,035 |
| Events in quadrant C | 11,451,786 | 419,596 |
| Events in quadrant D | 4,820,989 | 622,389 |
| Mode SS | |||
|---|---|---|---|
| Quadrant | BADHDUFLAG | Total packets | Discarded packets |
| A | 0 | 150 | 0 |
| B | 0 | 150 | 0 |
| C | 0 | 150 | 0 |
| D | 0 | 150 | 0 |
| Mode M0 | |||
|---|---|---|---|
| Quadrant | BADHDUFLAG | Total packets | Discarded packets |
| A | 0 | 57872 | 0 |
| B | 0 | 22991 | 0 |
| C | 0 | 39247 | 0 |
| D | 0 | 19532 | 0 |
| Quadrant | Total seconds | Saturated seconds | Saturation percentage |
|---|---|---|---|
| A | 7548 | 6795 | 90.023847% |
| B | 7548 | 703 | 9.313725% |
| C | 7548 | 3008 | 39.851616% |
| D | 7548 | 240 | 3.179650% |
Noise dominated data is calculated using 1-second bins in cleaned event files. If a bin has >2000 counts, and if more than 50% of those come from <1% of pixels, then it is considered to be noise-dominated and hence unusable.
| Quadrant | # 1 sec bins | Bins with >0 counts | Bins with >2000 counts | High rate bins dominated by noise | Noise dominated (total time) | Noise dominated (detector-on time) | Marked lightcurve |
|---|---|---|---|---|---|---|---|
| A | 7547 | 7547 | 5889 | 5889 | 78.03% | 78.03% | 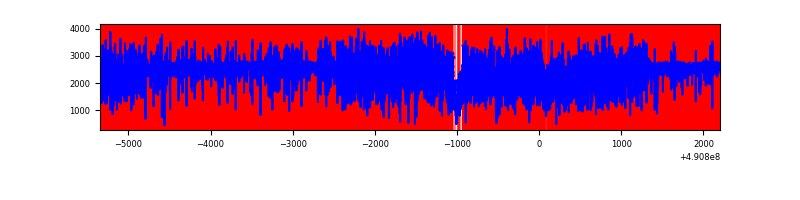 |
| B | 7547 | 7547 | 492 | 492 | 6.52% | 6.52% | 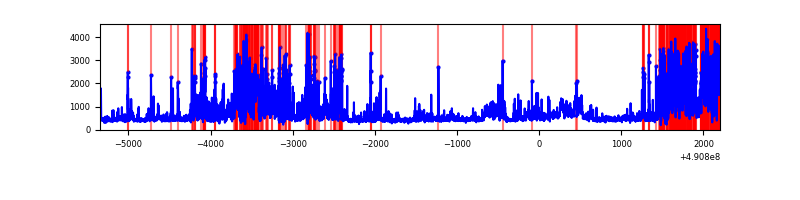 |
| C | 7548 | 7548 | 2647 | 2647 | 35.07% | 35.07% | 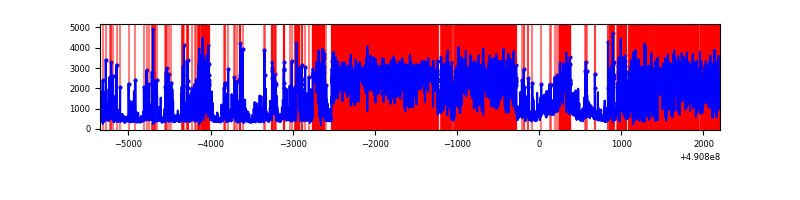 |
| D | 7548 | 7548 | 203 | 203 | 2.69% | 2.69% | 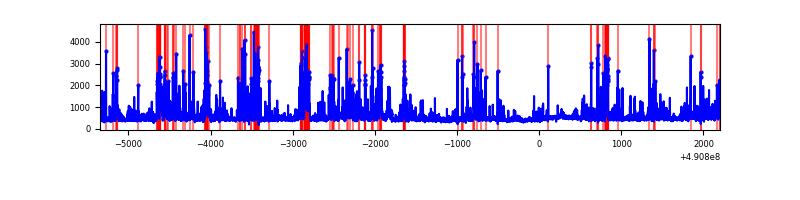 |
Top three noisy pixels from each quadrant. If the there are fewer than three noisy pixels in the level2.evt file, extra rows are filled as -1
| Pixel properties | Quadrant properties | ||||||
|---|---|---|---|---|---|---|---|
| Quadrant | DetID | PixID | Counts | Sigma | Mean | Median | Sigma |
| A | 9 | 191 | 15214851 | 140750.46 | 423 | 412 | 108.1 |
| A | 3 | 14 | 399471 | 3691.74 | 423 | 412 | 108.1 |
| A | 7 | 206 | 135006 | 1245.14 | 423 | 412 | 108.1 |
| B | 2 | 249 | 1602879 | 10167.65 | 737 | 712 | 157.6 |
| B | 4 | 81 | 333088 | 2109.32 | 737 | 712 | 157.6 |
| B | 14 | 32 | 310287 | 1964.62 | 737 | 712 | 157.6 |
| C | 9 | 38 | 5504416 | 31812.03 | 628 | 619 | 173.0 |
| C | 15 | 224 | 2293447 | 13252.58 | 628 | 619 | 173.0 |
| C | 9 | 237 | 287226 | 1656.59 | 628 | 619 | 173.0 |
| D | 12 | 17 | 972366 | 4572.14 | 747 | 713 | 212.5 |
| D | 2 | 153 | 126154 | 590.27 | 747 | 713 | 212.5 |
| D | 2 | 120 | 99817 | 466.34 | 747 | 713 | 212.5 |
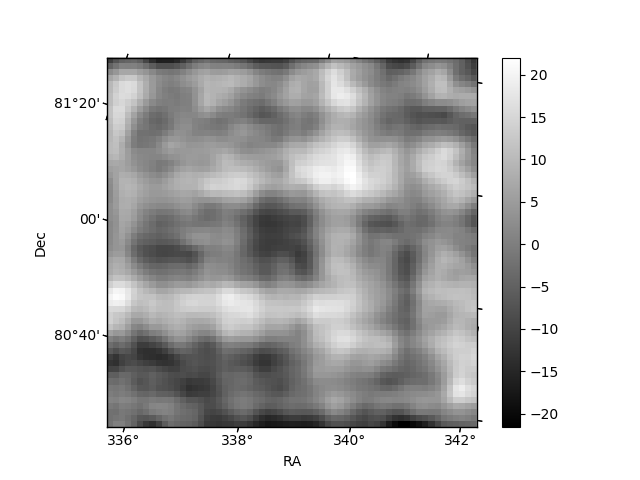
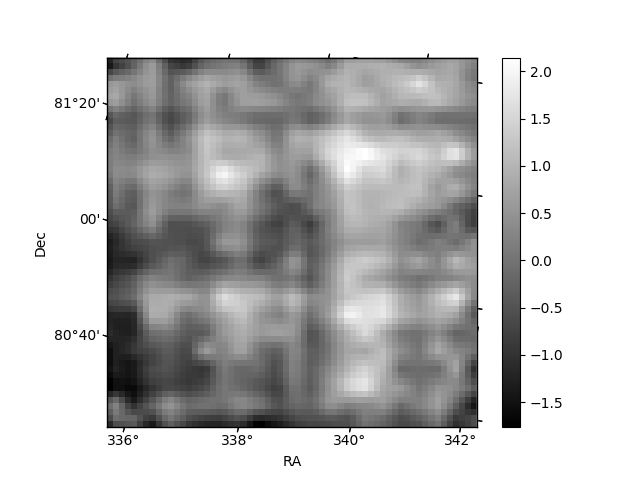
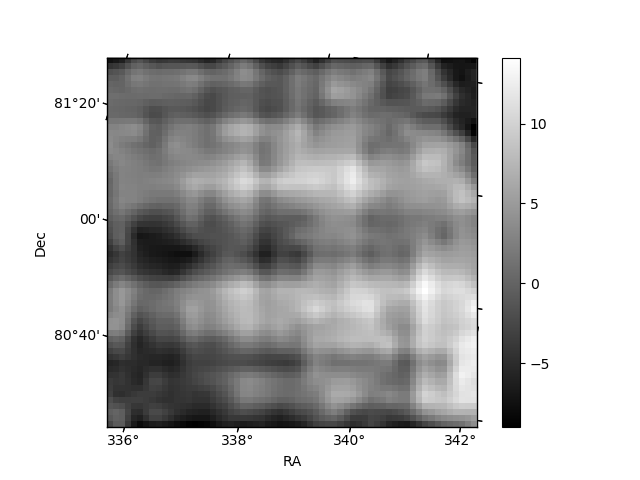
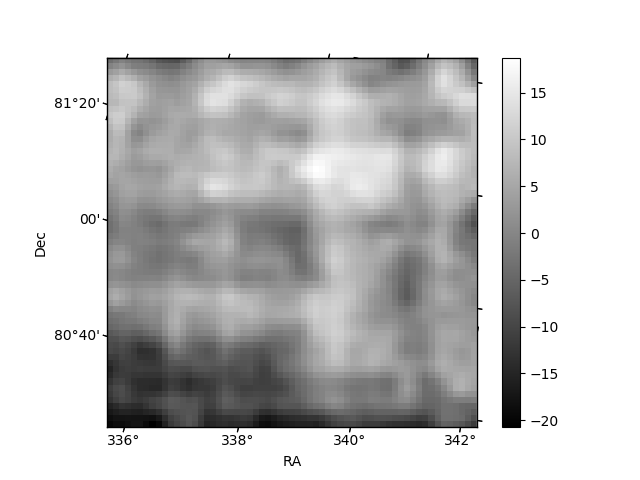
Histogram calculated using DETX and DETY for each event in the final _common_clean file
| Quadrant A | 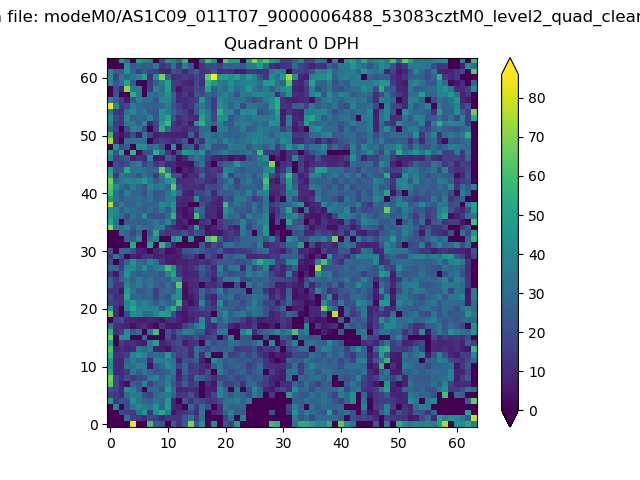 |
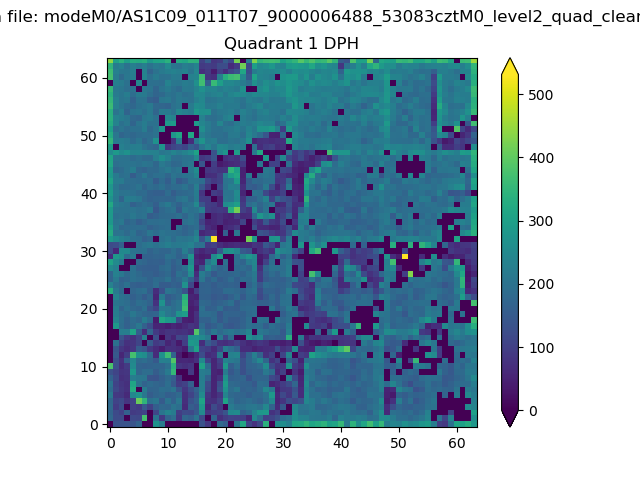 |
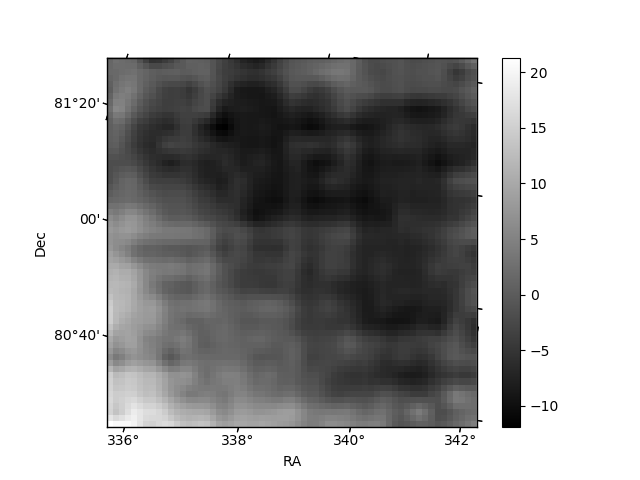
Quadrant B |
|---|---|---|---|
| Quadrant D | 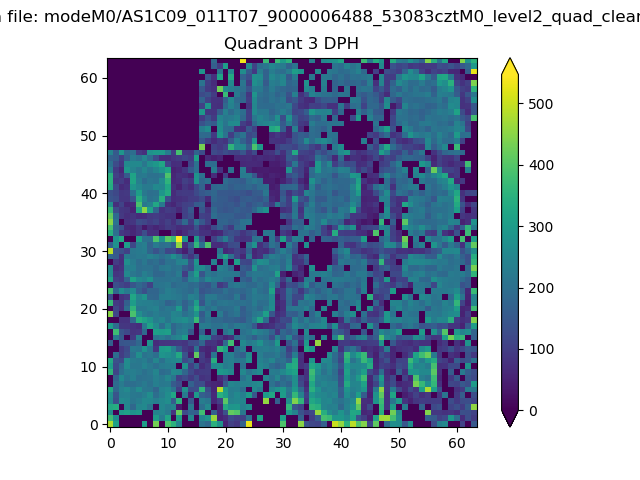 |
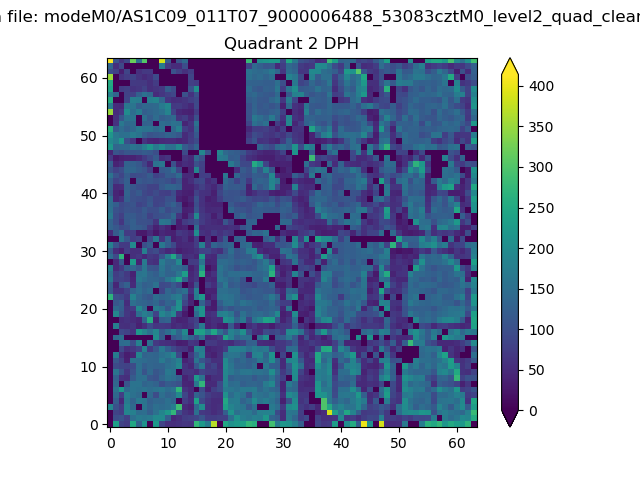 |
Quadrant C |
| Plot type | Count rate plots | Images |
|---|---|---|
| Comparison with Poisson distribution Blue bars denote a histogram of data divided into 1 sec bins. Red curve is a Poisson curve with rate = median count rate of data. |
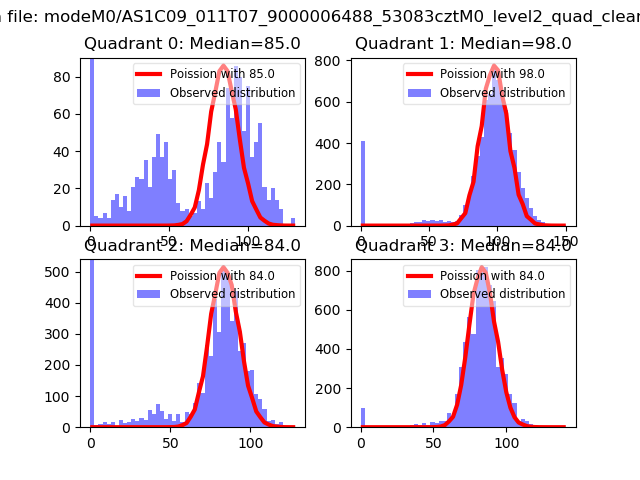 |
 |
| Quadrant-wise count rates Data is divided into 100 sec bins |
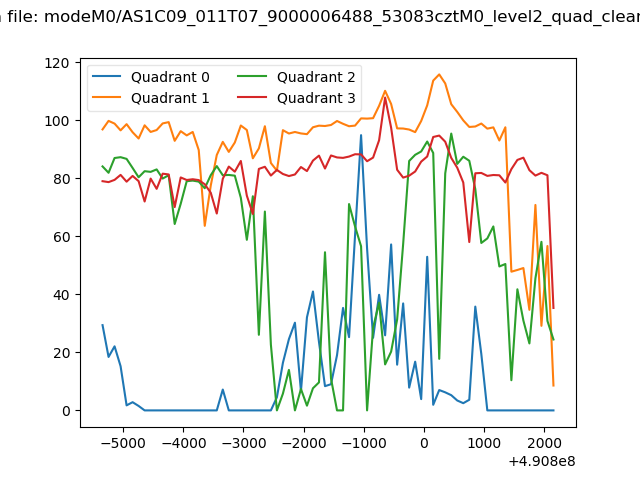 |
|
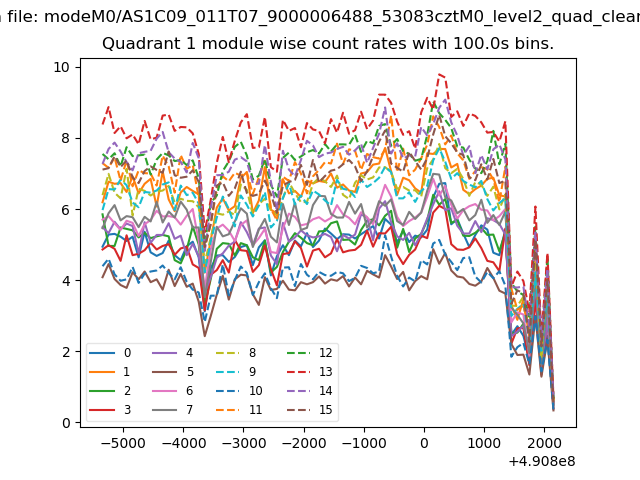
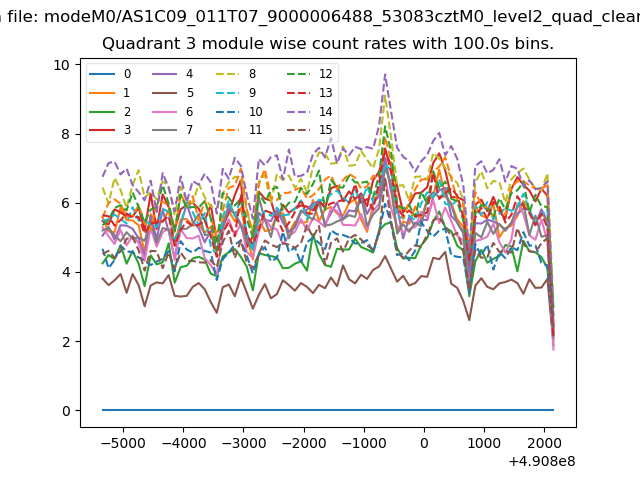
| Module-wise count rates for Quadrant A Data is divided into 100 sec bins |
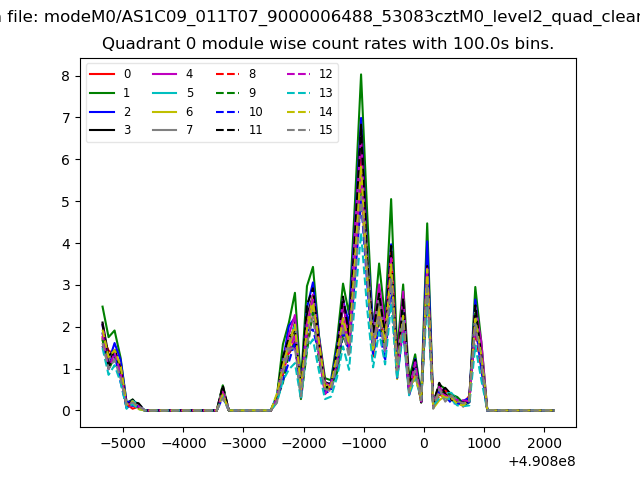 |
 |
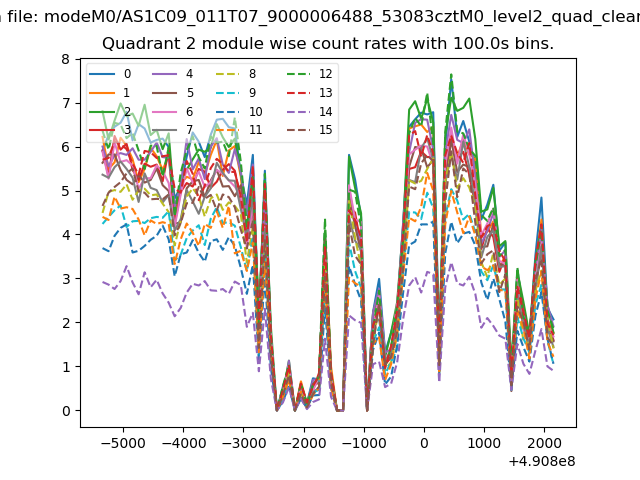
| Module-wise count rates for Quadrant B Data is divided into 100 sec bins |
 |
 |
| Module-wise count rates for Quadrant C Data is divided into 100 sec bins |
 |
 |
| Module-wise count rates for Quadrant D Data is divided into 100 sec bins |
 |
 |
| Parameter | Plot |
|---|---|
| CZT HV Monitor | 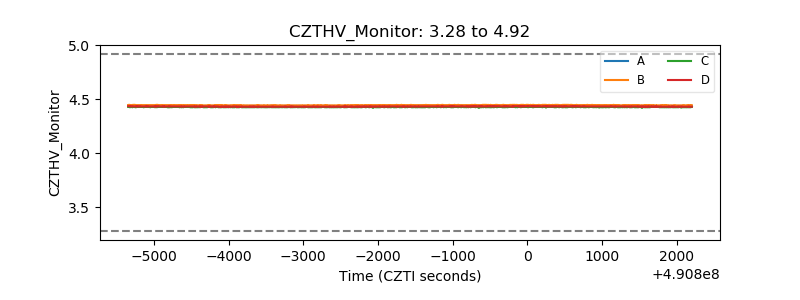 |
| D_VDD | 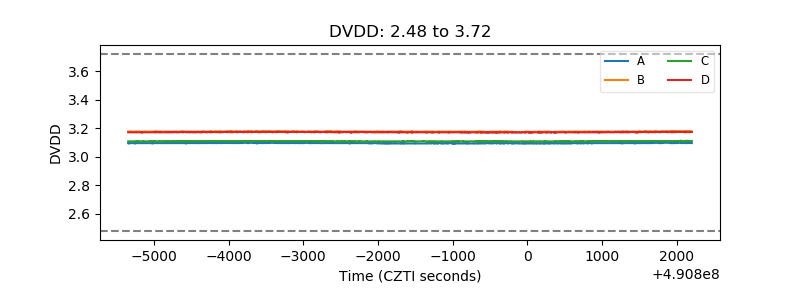 |
| Temperature 1 | 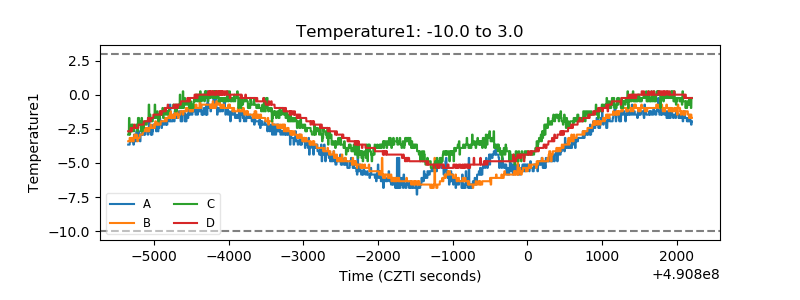 |
| Veto HV Monitor | 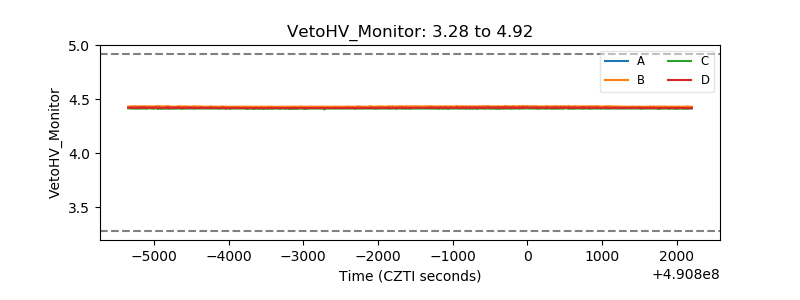 |
| Veto LLD | 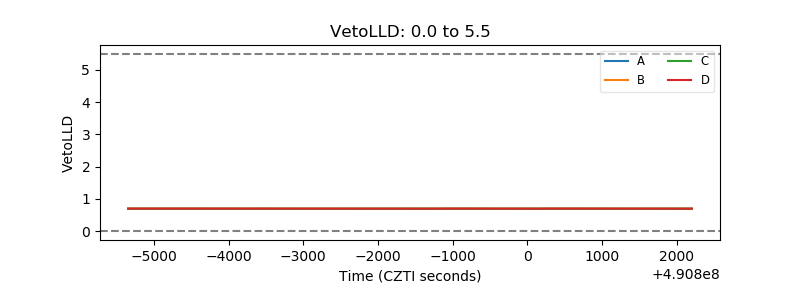 |
| Alpha Counter |  |
| _CPM_Rate | 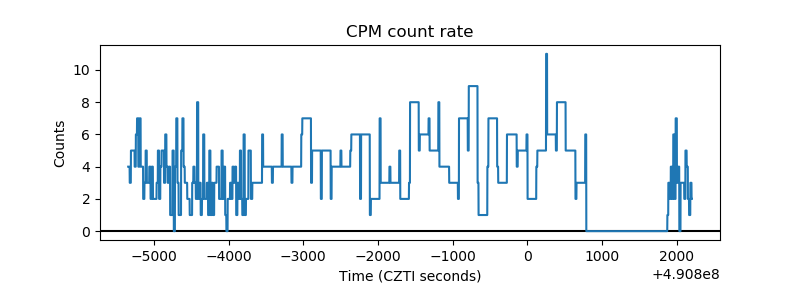 |
| CZT Counter | 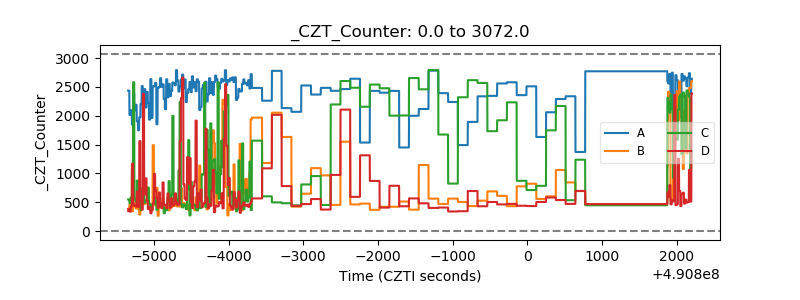 |
| +2.5 Volts monitor |  |
| +5 Volts monitor |  |
| _ROLL_ROT | 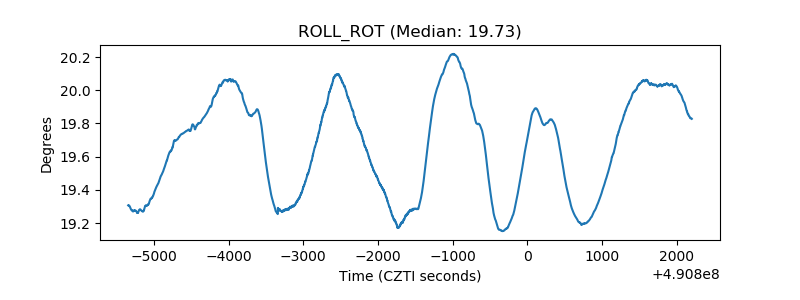 |
| _Roll_DEC | 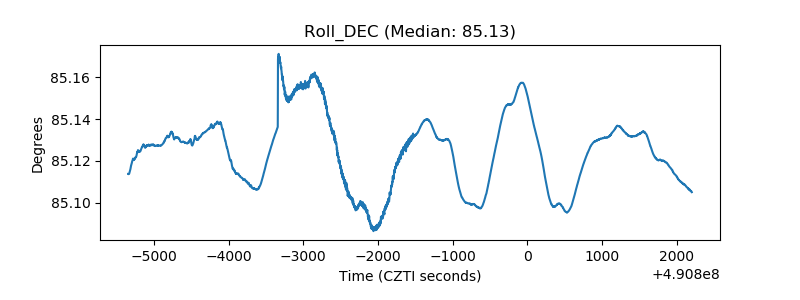 |
| _Roll_RA | 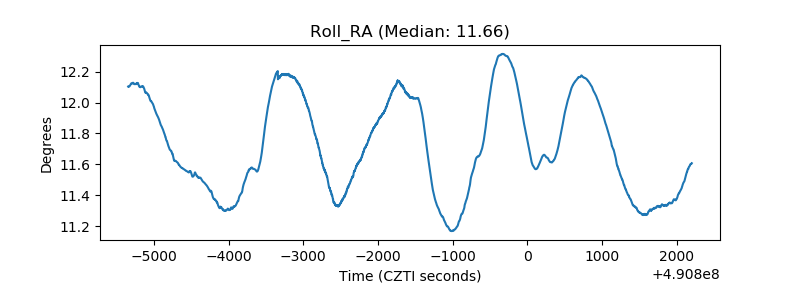 |
| Veto Counter | 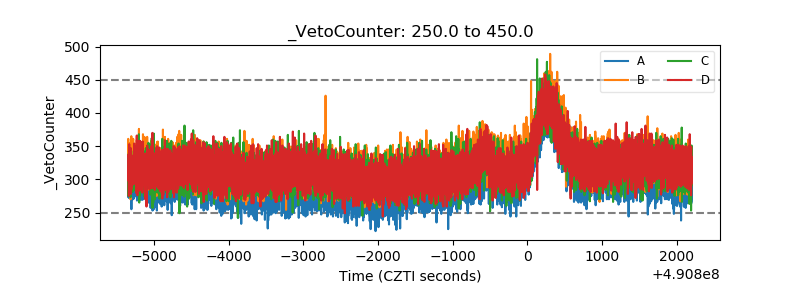 |