| Param | Original file | Final file |
|---|---|---|
| Filename | modeM0/AS1C09_011T07_9000006488_53084cztM0_level2.fits | modeM0/AS1C09_011T07_9000006488_53084cztM0_level2_quad_clean.evt |
| Size (bytes) | 1,081,673,280 | 69,840,000 |
| Size | 1.0 GB | 66.6 MB |
| Events in quadrant A | 15,755,700 | 115,833 |
| Events in quadrant B | 8,082,766 | 524,505 |
| Events in quadrant C | 9,997,686 | 451,101 |
| Events in quadrant D | 5,678,843 | 548,338 |
| Mode SS | |||
|---|---|---|---|
| Quadrant | BADHDUFLAG | Total packets | Discarded packets |
| A | 0 | 136 | 0 |
| B | 0 | 136 | 0 |
| C | 0 | 136 | 0 |
| D | 0 | 136 | 0 |
| Mode M0 | |||
|---|---|---|---|
| Quadrant | BADHDUFLAG | Total packets | Discarded packets |
| A | 0 | 51393 | 0 |
| B | 0 | 28806 | 0 |
| C | 0 | 34486 | 1 |
| D | 0 | 21668 | 0 |
| Quadrant | Total seconds | Saturated seconds | Saturation percentage |
|---|---|---|---|
| A | 6805 | 5822 | 85.554739% |
| B | 6805 | 1887 | 27.729611% |
| C | 6805 | 2121 | 31.168259% |
| D | 6805 | 557 | 8.185158% |
Noise dominated data is calculated using 1-second bins in cleaned event files. If a bin has >2000 counts, and if more than 50% of those come from <1% of pixels, then it is considered to be noise-dominated and hence unusable.
| Quadrant | # 1 sec bins | Bins with >0 counts | Bins with >2000 counts | High rate bins dominated by noise | Noise dominated (total time) | Noise dominated (detector-on time) | Marked lightcurve |
|---|---|---|---|---|---|---|---|
| A | 6804 | 6804 | 5248 | 5248 | 77.13% | 77.13% | 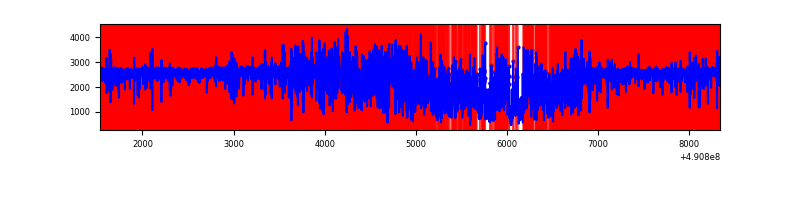 |
| B | 6805 | 6805 | 1348 | 1348 | 19.81% | 19.81% | 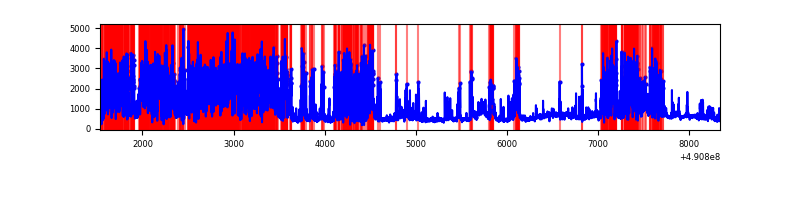 |
| C | 6805 | 6805 | 1682 | 1682 | 24.72% | 24.72% | 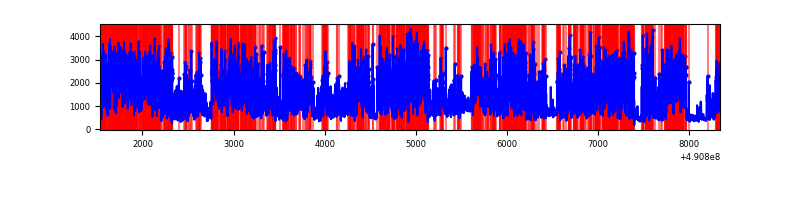 |
| D | 6805 | 6805 | 430 | 430 | 6.32% | 6.32% | 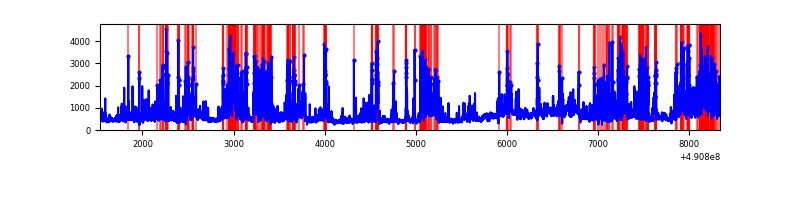 |
Top three noisy pixels from each quadrant. If the there are fewer than three noisy pixels in the level2.evt file, extra rows are filled as -1
| Pixel properties | Quadrant properties | ||||||
|---|---|---|---|---|---|---|---|
| Quadrant | DetID | PixID | Counts | Sigma | Mean | Median | Sigma |
| A | 9 | 191 | 13442305 | 148029.27 | 354 | 344 | 90.8 |
| A | 7 | 206 | 726792 | 7999.99 | 354 | 344 | 90.8 |
| A | 0 | 8 | 47329 | 517.42 | 354 | 344 | 90.8 |
| B | 2 | 249 | 4213701 | 31711.98 | 622 | 602 | 132.9 |
| B | 4 | 81 | 320616 | 2408.74 | 622 | 602 | 132.9 |
| B | 10 | 254 | 271310 | 2037.62 | 622 | 602 | 132.9 |
| C | 9 | 38 | 3661290 | 21388.59 | 618 | 612 | 171.2 |
| C | 15 | 224 | 2127351 | 12426.1 | 618 | 612 | 171.2 |
| C | 15 | 147 | 552341 | 3223.64 | 618 | 612 | 171.2 |
| D | 12 | 17 | 1492627 | 7664.06 | 679 | 649 | 194.7 |
| D | 3 | 12 | 227533 | 1165.47 | 679 | 649 | 194.7 |
| D | 2 | 153 | 140738 | 719.62 | 679 | 649 | 194.7 |
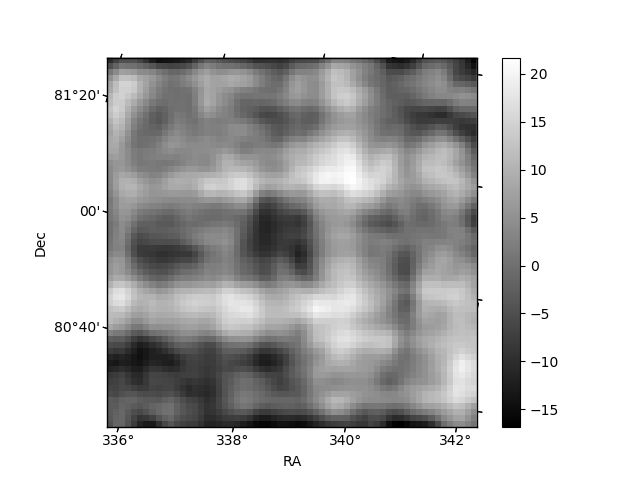
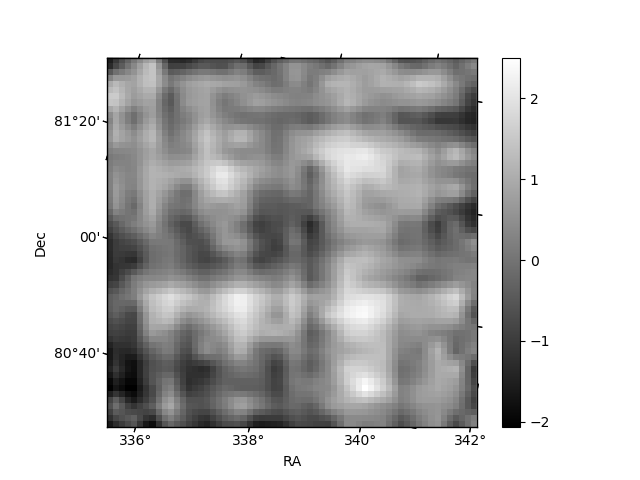
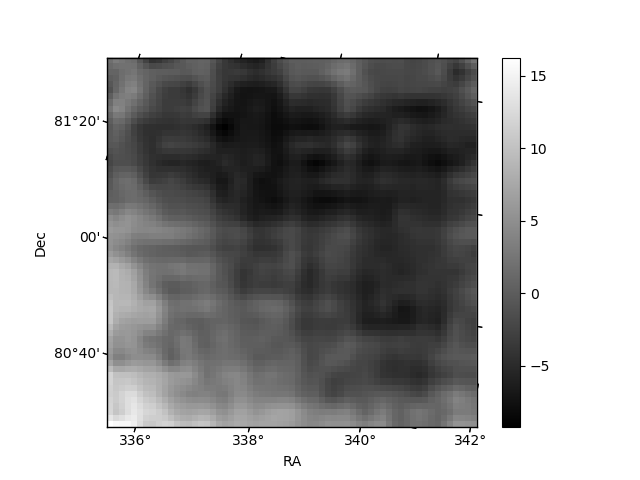
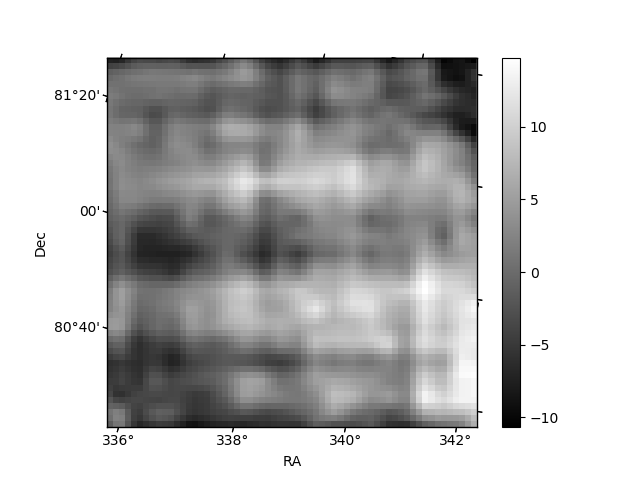
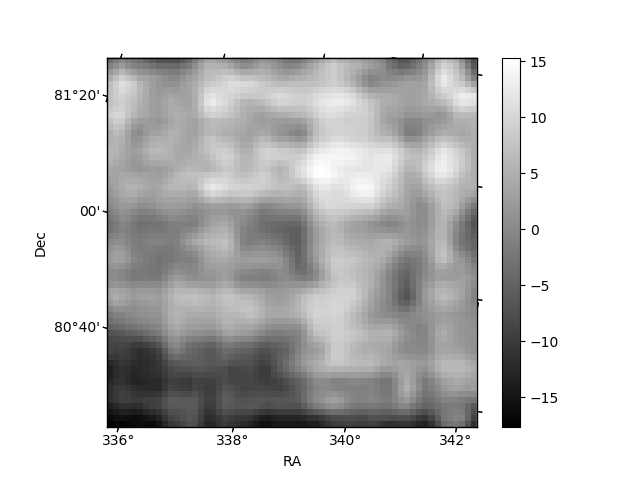
Histogram calculated using DETX and DETY for each event in the final _common_clean file
| Quadrant A | 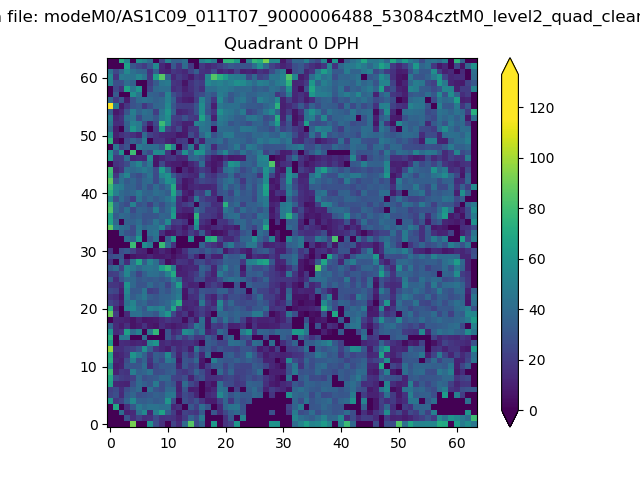 |
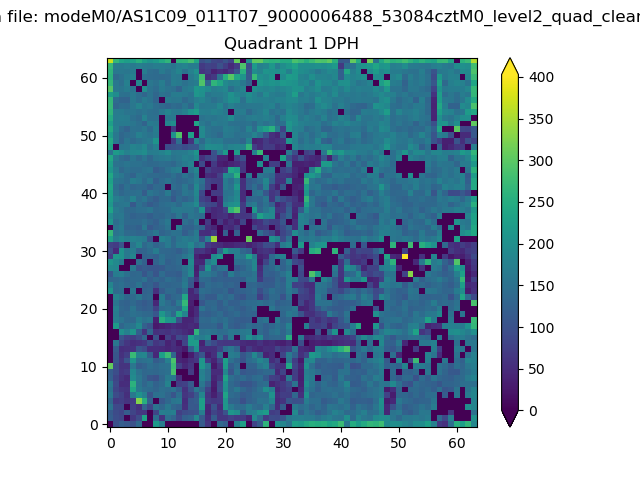 |
Quadrant B |
|---|---|---|---|
| Quadrant D | 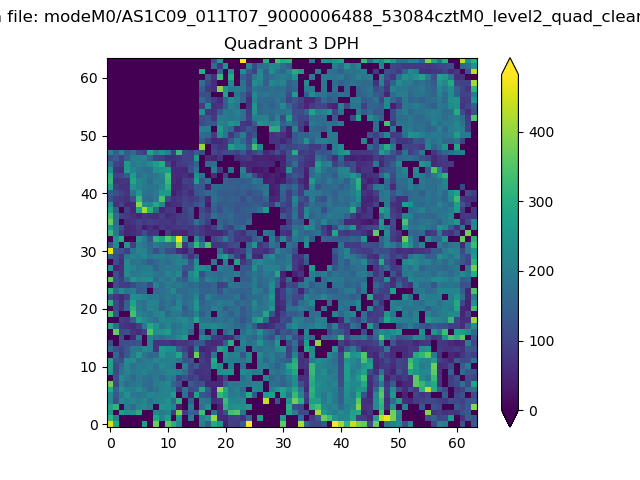 |
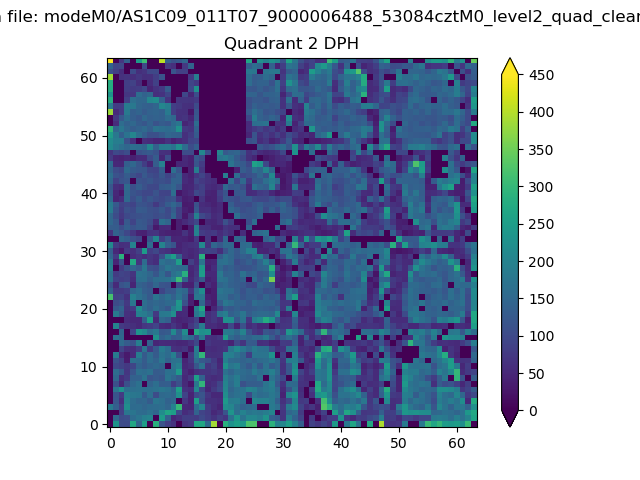 |
Quadrant C |
| Plot type | Count rate plots | Images |
|---|---|---|
| Comparison with Poisson distribution Blue bars denote a histogram of data divided into 1 sec bins. Red curve is a Poisson curve with rate = median count rate of data. |
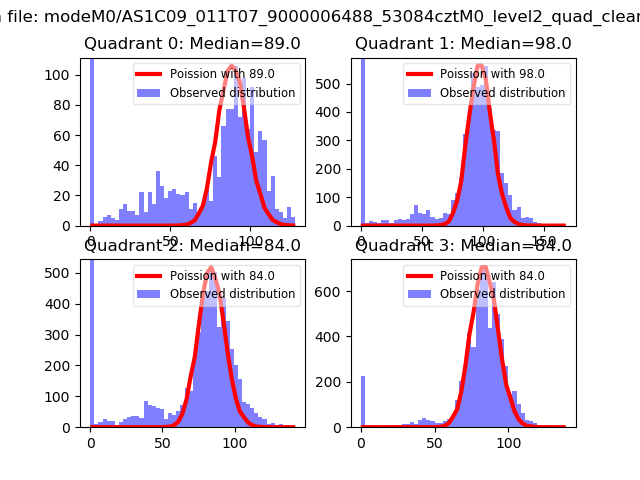 |
 |
| Quadrant-wise count rates Data is divided into 100 sec bins |
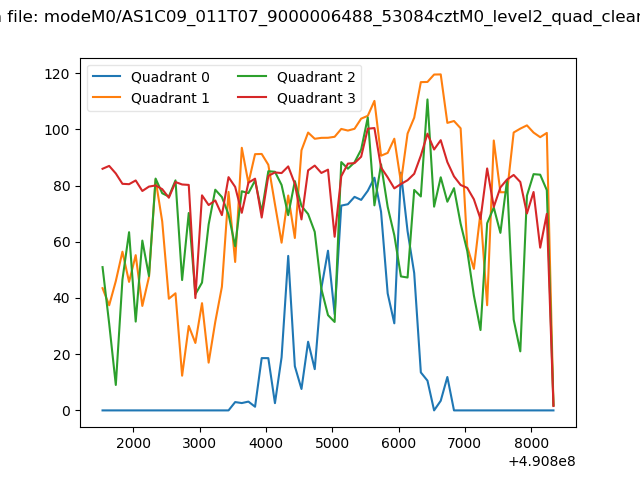 |
|
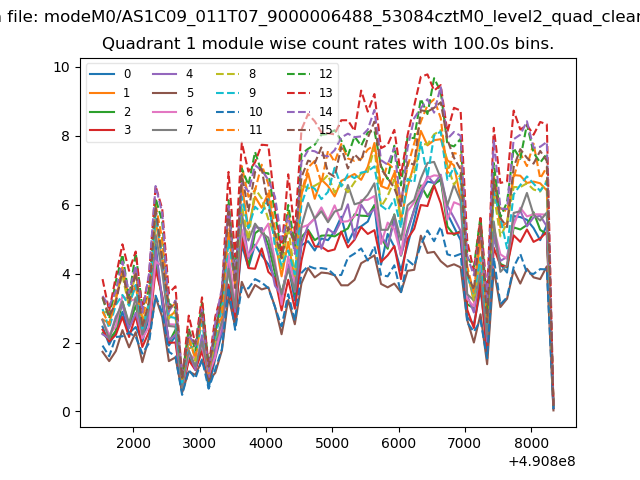
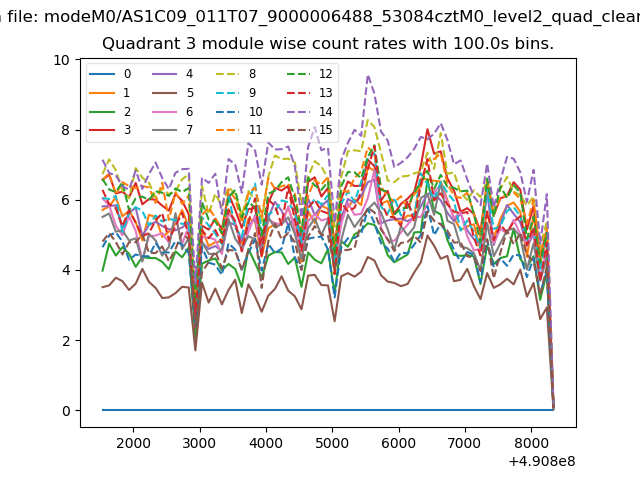
| Module-wise count rates for Quadrant A Data is divided into 100 sec bins |
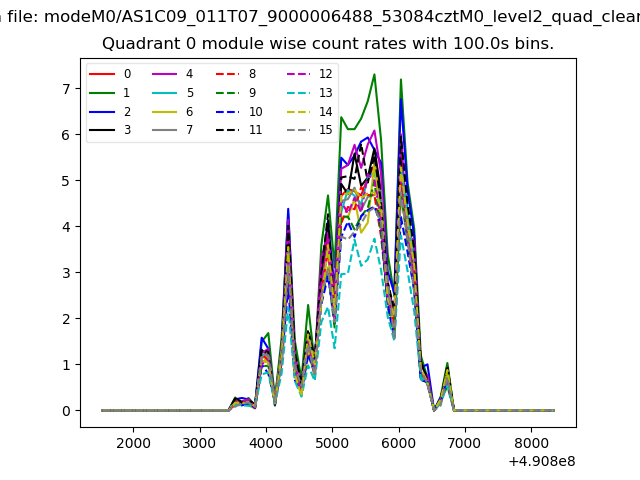 |
 |
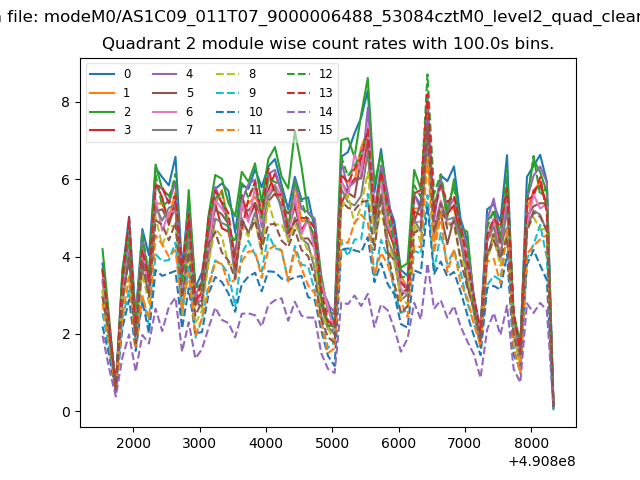
| Module-wise count rates for Quadrant B Data is divided into 100 sec bins |
 |
 |
| Module-wise count rates for Quadrant C Data is divided into 100 sec bins |
 |
 |
| Module-wise count rates for Quadrant D Data is divided into 100 sec bins |
 |
 |
| Parameter | Plot |
|---|---|
| CZT HV Monitor | 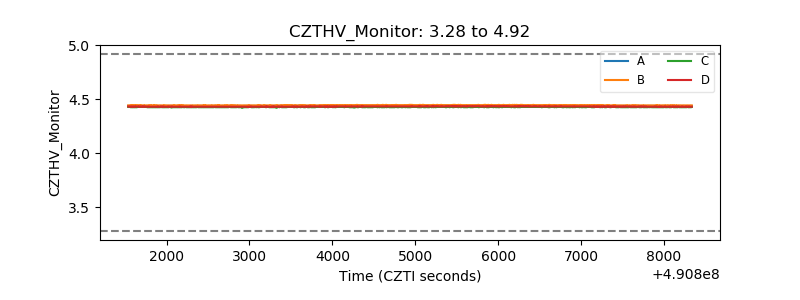 |
| D_VDD | 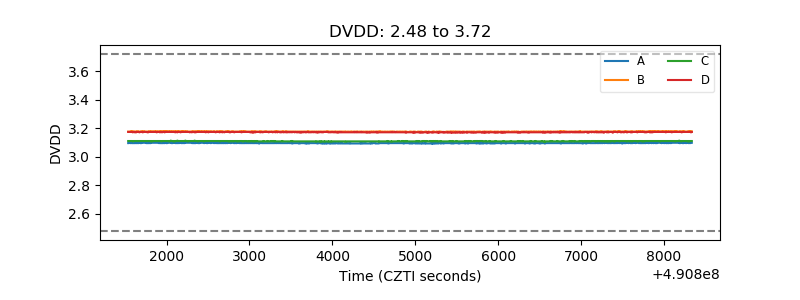 |
| Temperature 1 | 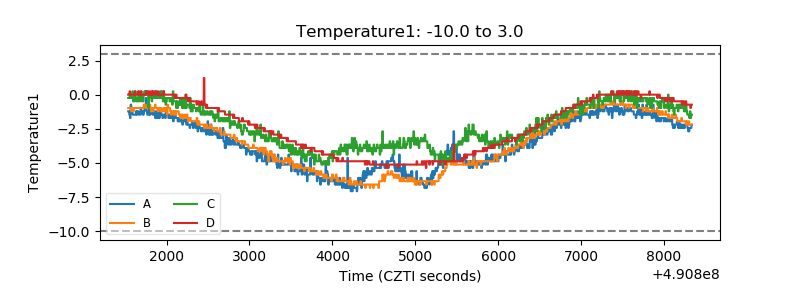 |
| Veto HV Monitor | 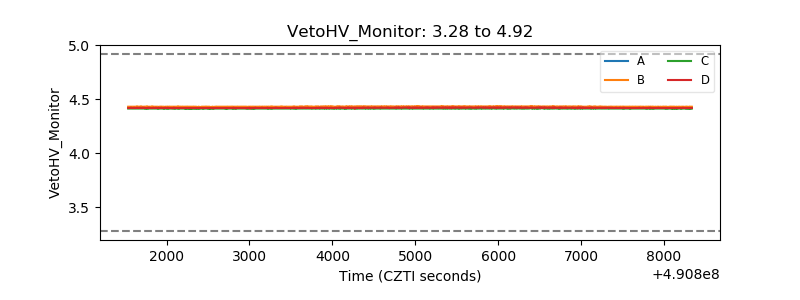 |
| Veto LLD | 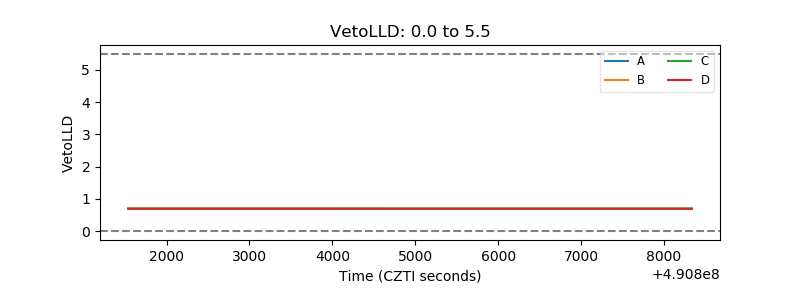 |
| Alpha Counter | 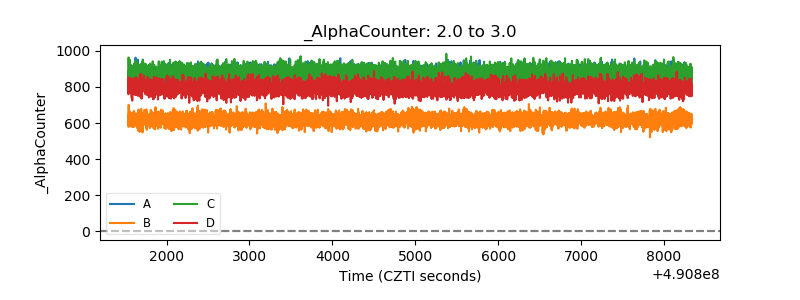 |
| _CPM_Rate | 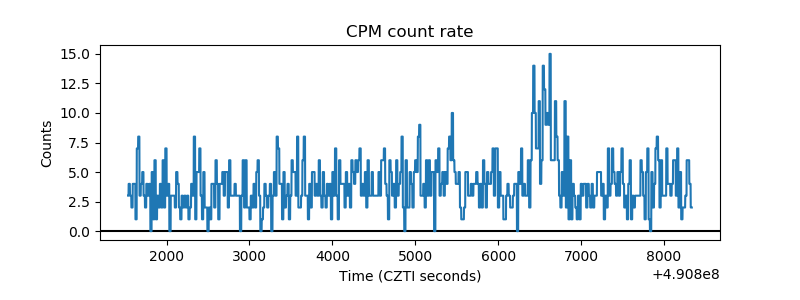 |
| CZT Counter | 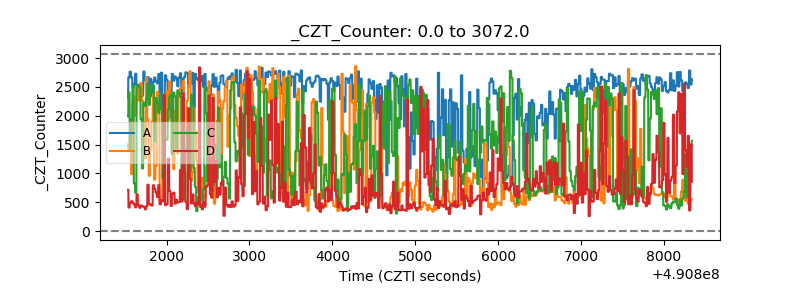 |
| +2.5 Volts monitor |  |
| +5 Volts monitor |  |
| _ROLL_ROT | 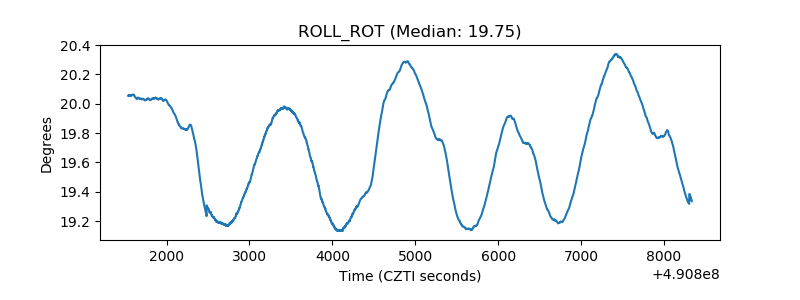 |
| _Roll_DEC | 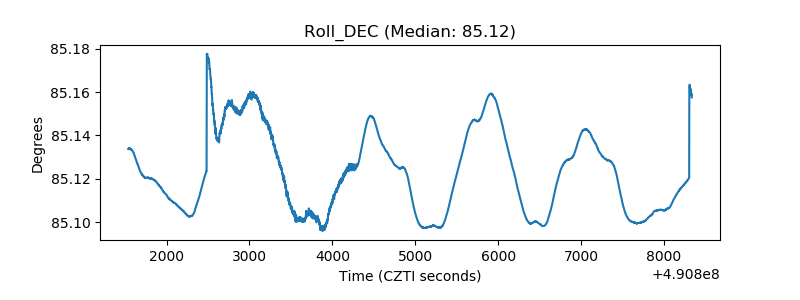 |
| _Roll_RA | 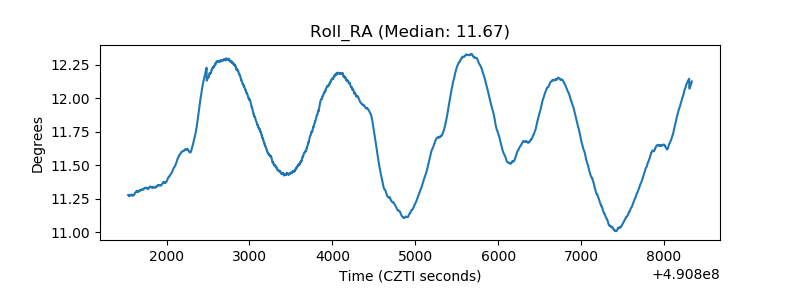 |
| Veto Counter | 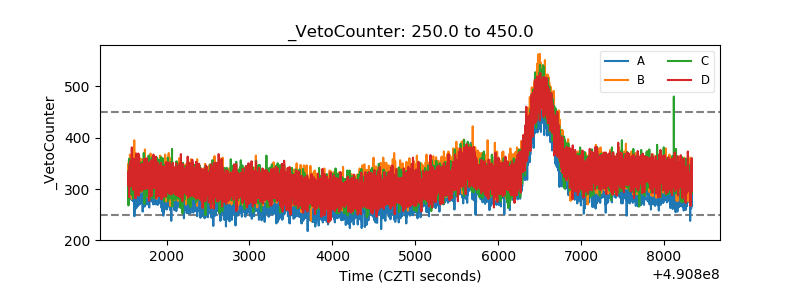 |