| Param | Original file | Final file |
|---|---|---|
| Filename | modeM0/AS1C09_011T07_9000006488_53087cztM0_level2.fits | modeM0/AS1C09_011T07_9000006488_53087cztM0_level2_quad_clean.evt |
| Size (bytes) | 2,738,643,840 | 174,758,400 |
| Size | 2.6 GB | 166.7 MB |
| Events in quadrant A | 42,656,184 | 210,782 |
| Events in quadrant B | 20,479,270 | 1,261,827 |
| Events in quadrant C | 21,859,962 | 1,231,563 |
| Events in quadrant D | 15,012,509 | 1,360,091 |
| Mode SS | |||
|---|---|---|---|
| Quadrant | BADHDUFLAG | Total packets | Discarded packets |
| A | 0 | 360 | 0 |
| B | 0 | 360 | 0 |
| C | 0 | 360 | 0 |
| D | 0 | 360 | 0 |
| Mode M9 | |||
|---|---|---|---|
| Quadrant | BADHDUFLAG | Total packets | Discarded packets |
| A | 0 | 18 | 0 |
| B | 0 | 18 | 0 |
| C | 0 | 18 | 0 |
| D | 0 | 18 | 0 |
| Mode M0 | |||
|---|---|---|---|
| Quadrant | BADHDUFLAG | Total packets | Discarded packets |
| A | 0 | 138733 | 3 |
| B | 0 | 73044 | 4 |
| C | 0 | 77208 | 3 |
| D | 0 | 57154 | 3 |
| Quadrant | Total seconds | Saturated seconds | Saturation percentage |
|---|---|---|---|
| A | 17776 | 15991 | 89.958371% |
| B | 17775 | 5106 | 28.725738% |
| C | 17776 | 4063 | 22.856661% |
| D | 17776 | 1885 | 10.604185% |
Noise dominated data is calculated using 1-second bins in cleaned event files. If a bin has >2000 counts, and if more than 50% of those come from <1% of pixels, then it is considered to be noise-dominated and hence unusable.
| Quadrant | # 1 sec bins | Bins with >0 counts | Bins with >2000 counts | High rate bins dominated by noise | Noise dominated (total time) | Noise dominated (detector-on time) | Marked lightcurve |
|---|---|---|---|---|---|---|---|
| A | 19510 | 17776 | 14548 | 14548 | 74.57% | 81.84% | 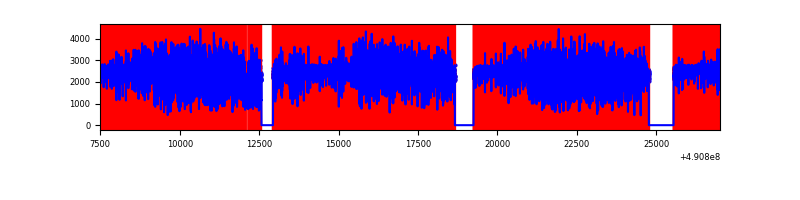 |
| B | 19510 | 17778 | 3558 | 3558 | 18.24% | 20.01% | 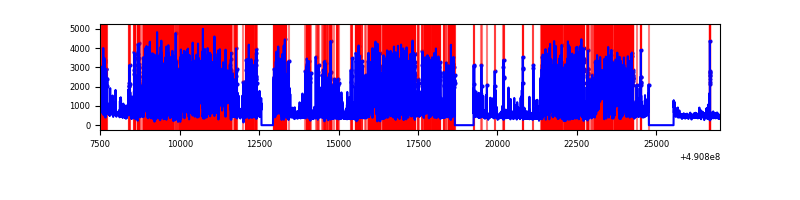 |
| C | 19511 | 17777 | 3372 | 3372 | 17.28% | 18.97% | 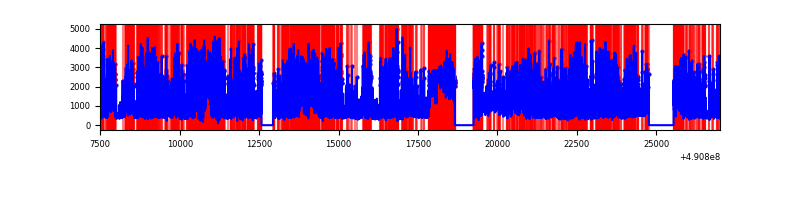 |
| D | 19510 | 17778 | 1543 | 1543 | 7.91% | 8.68% | 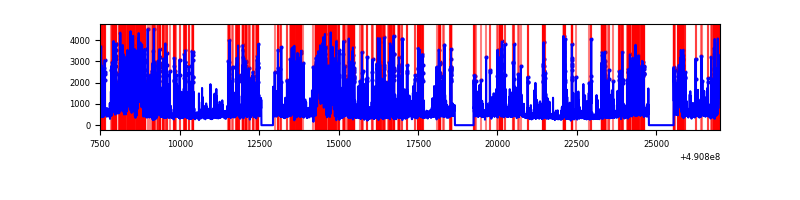 |
Top three noisy pixels from each quadrant. If the there are fewer than three noisy pixels in the level2.evt file, extra rows are filled as -1
| Pixel properties | Quadrant properties | ||||||
|---|---|---|---|---|---|---|---|
| Quadrant | DetID | PixID | Counts | Sigma | Mean | Median | Sigma |
| A | 9 | 191 | 37332627 | 161767.47 | 917 | 896 | 230.8 |
| A | 3 | 62 | 442651 | 1914.23 | 917 | 896 | 230.8 |
| A | 0 | 8 | 328237 | 1418.45 | 917 | 896 | 230.8 |
| B | 2 | 249 | 12512000 | 37984.38 | 1562 | 1508 | 329.4 |
| B | 0 | 213 | 676216 | 2048.55 | 1562 | 1508 | 329.4 |
| B | 4 | 81 | 380315 | 1150.13 | 1562 | 1508 | 329.4 |
| C | 15 | 224 | 6876341 | 15654.28 | 1602 | 1588 | 439.2 |
| C | 15 | 157 | 2140647 | 4870.78 | 1602 | 1588 | 439.2 |
| C | 9 | 38 | 1593456 | 3624.79 | 1602 | 1588 | 439.2 |
| D | 12 | 17 | 3514604 | 6969.11 | 1736 | 1660 | 504.1 |
| D | 8 | 208 | 917055 | 1815.99 | 1736 | 1660 | 504.1 |
| D | 2 | 153 | 828417 | 1640.15 | 1736 | 1660 | 504.1 |
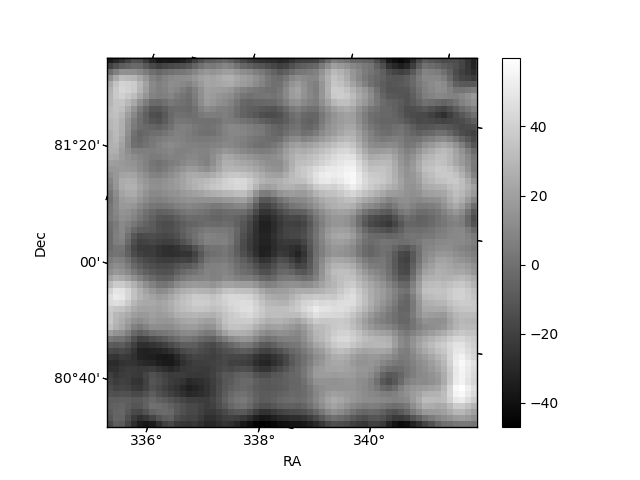
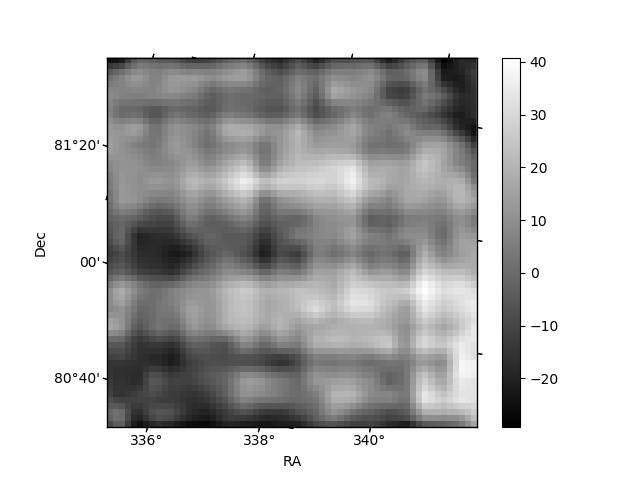
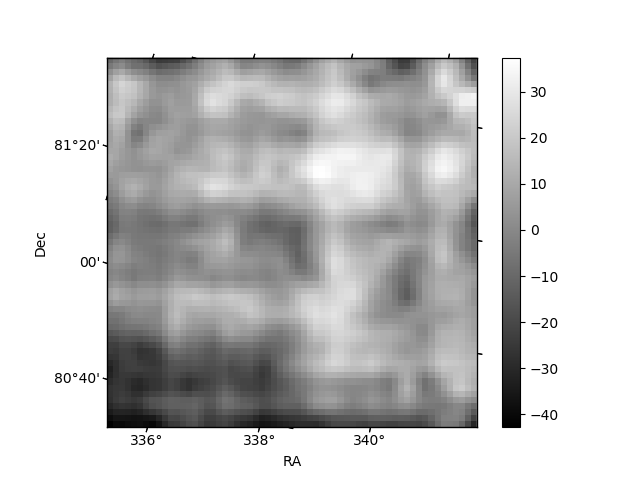
Histogram calculated using DETX and DETY for each event in the final _common_clean file
| Quadrant A | 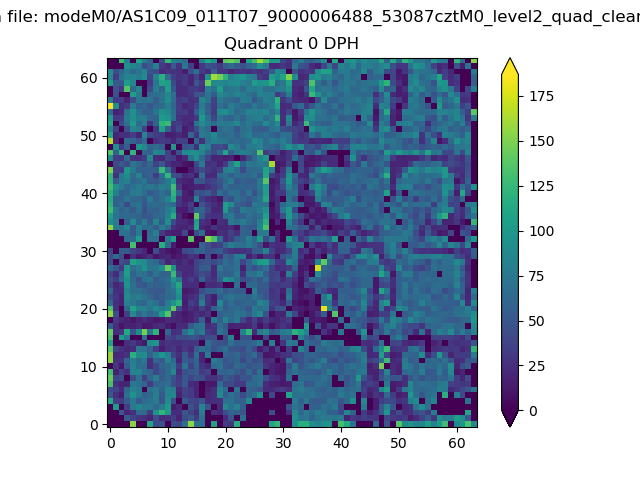 |
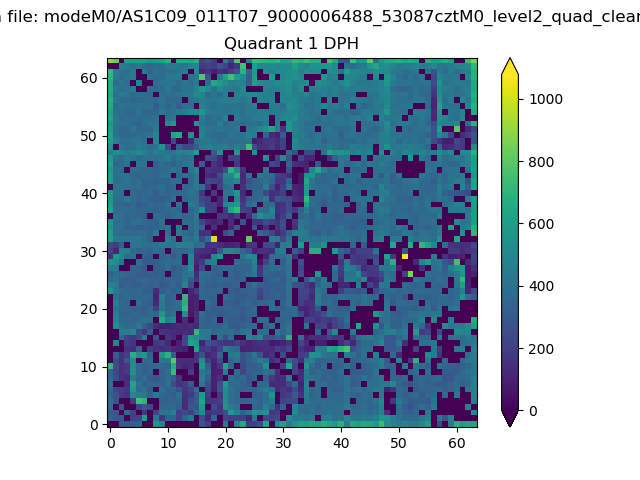 |
Quadrant B |
|---|---|---|---|
| Quadrant D |  |
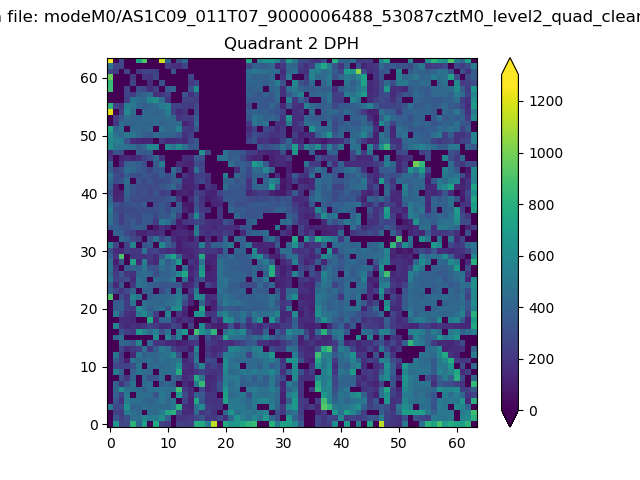 |
Quadrant C |
| Plot type | Count rate plots | Images |
|---|---|---|
| Comparison with Poisson distribution Blue bars denote a histogram of data divided into 1 sec bins. Red curve is a Poisson curve with rate = median count rate of data. |
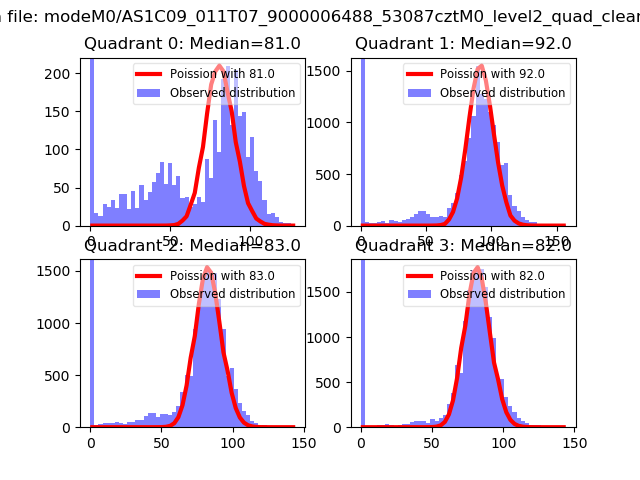 |
 |
| Quadrant-wise count rates Data is divided into 100 sec bins |
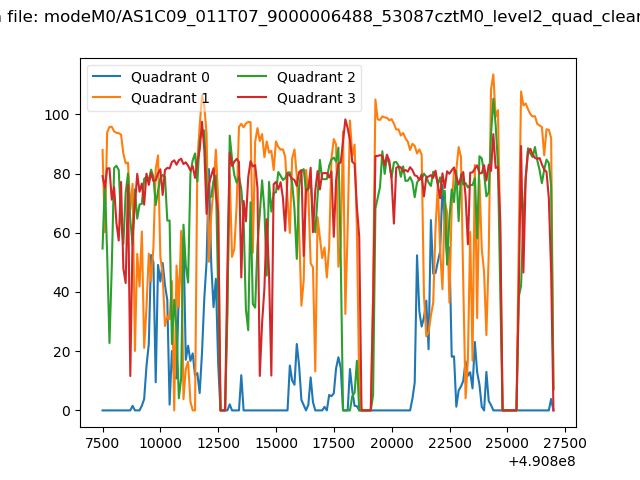 |
|
| Module-wise count rates for Quadrant A Data is divided into 100 sec bins |
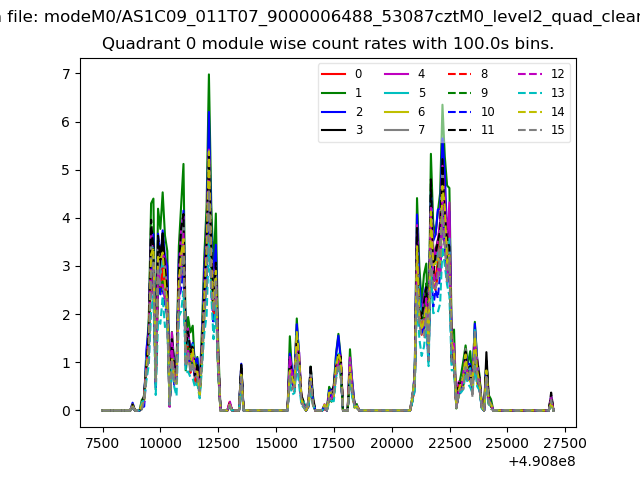 |
 |
| Module-wise count rates for Quadrant B Data is divided into 100 sec bins |
 |
 |
| Module-wise count rates for Quadrant C Data is divided into 100 sec bins |
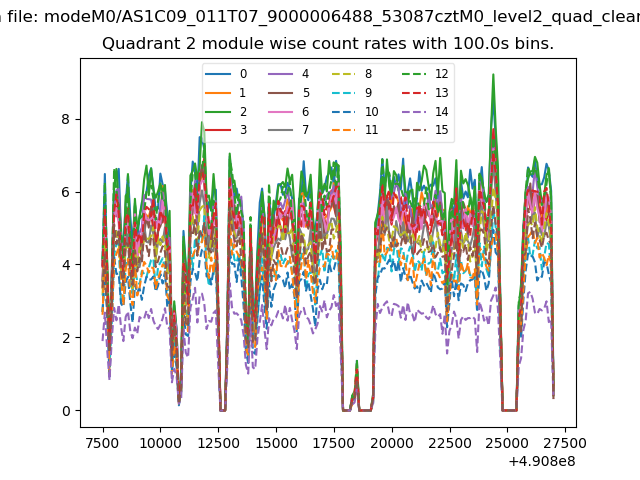 |
 |
| Module-wise count rates for Quadrant D Data is divided into 100 sec bins |
 |
 |
| Parameter | Plot |
|---|---|
| CZT HV Monitor | 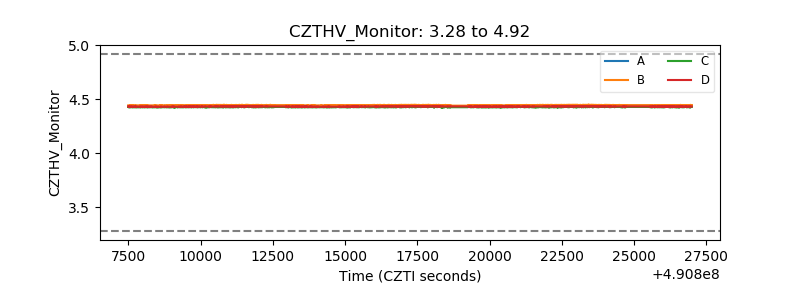 |
| D_VDD | 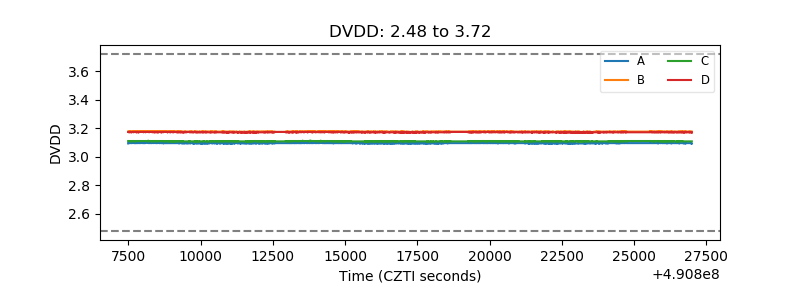 |
| Temperature 1 | 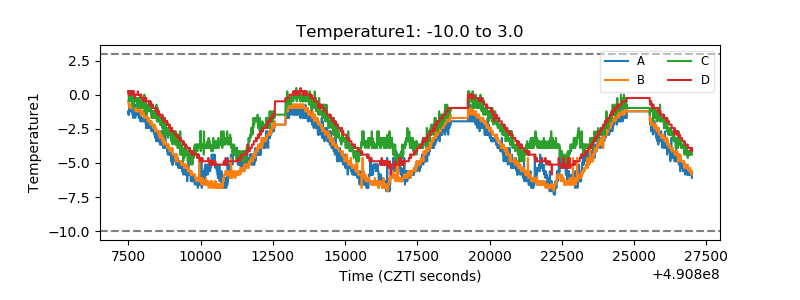 |
| Veto HV Monitor |  |
| Veto LLD | 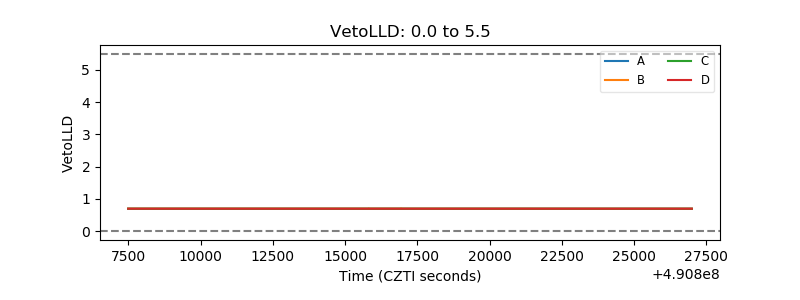 |
| Alpha Counter | 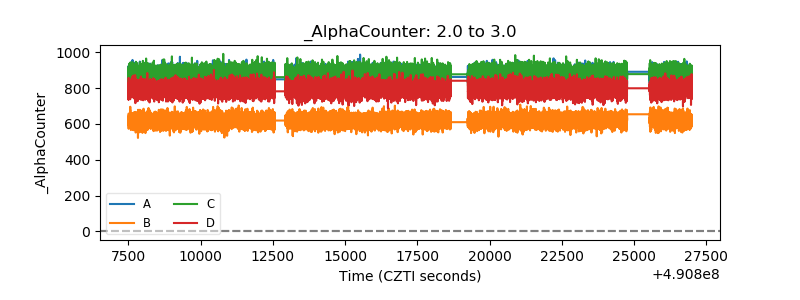 |
| _CPM_Rate |  |
| CZT Counter | 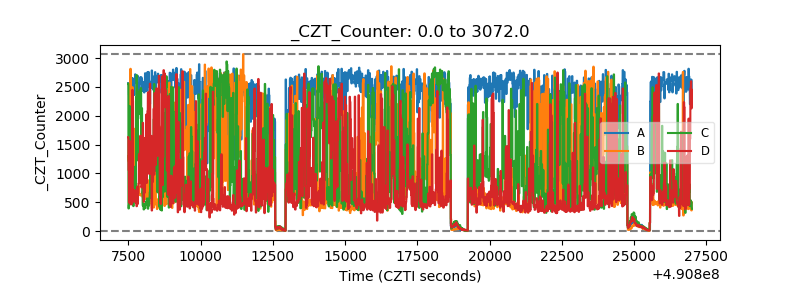 |
| +2.5 Volts monitor | 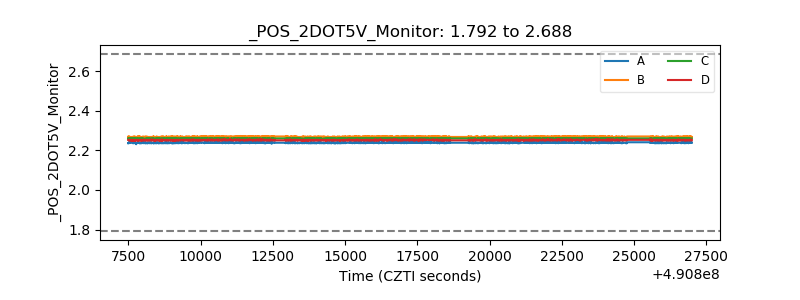 |
| +5 Volts monitor |  |
| _ROLL_ROT | 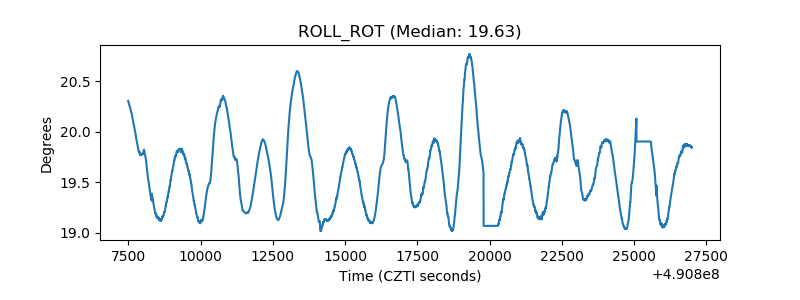 |
| _Roll_DEC | 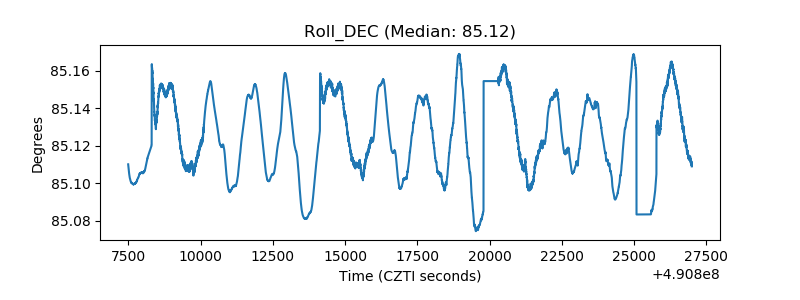 |
| _Roll_RA | 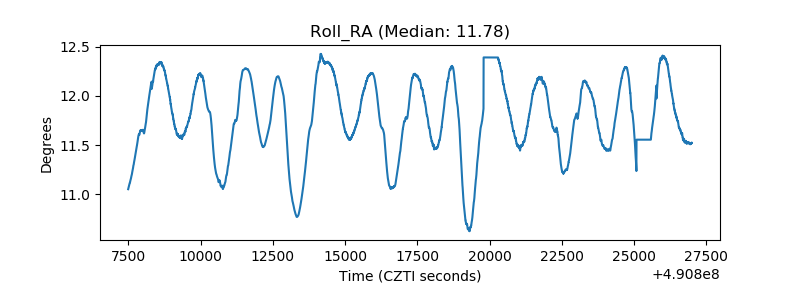 |
| Veto Counter | 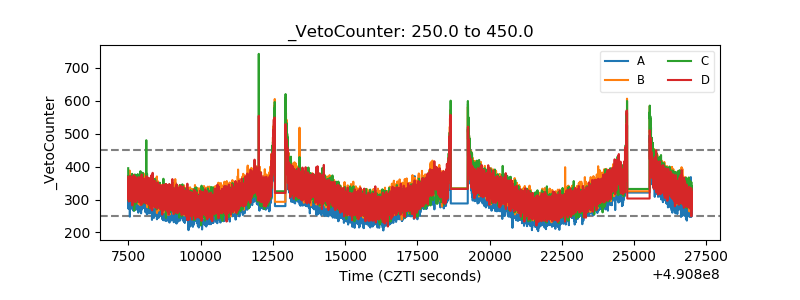 |