| Param | Original file | Final file |
|---|---|---|
| Filename | modeM0/AS1C09_011T07_9000006488_53088cztM0_level2.fits | modeM0/AS1C09_011T07_9000006488_53088cztM0_level2_quad_clean.evt |
| Size (bytes) | 916,027,200 | 74,926,080 |
| Size | 873.6 MB | 71.5 MB |
| Events in quadrant A | 14,743,262 | 191,490 |
| Events in quadrant B | 3,750,765 | 669,583 |
| Events in quadrant C | 6,861,132 | 518,225 |
| Events in quadrant D | 8,036,997 | 423,928 |
| Mode SS | |||
|---|---|---|---|
| Quadrant | BADHDUFLAG | Total packets | Discarded packets |
| A | 0 | 134 | 0 |
| B | 0 | 134 | 0 |
| C | 0 | 134 | 0 |
| D | 0 | 134 | 0 |
| Mode M9 | |||
|---|---|---|---|
| Quadrant | BADHDUFLAG | Total packets | Discarded packets |
| A | 0 | 10 | 0 |
| B | 0 | 10 | 0 |
| C | 0 | 10 | 0 |
| D | 0 | 10 | 0 |
| Mode M0 | |||
|---|---|---|---|
| Quadrant | BADHDUFLAG | Total packets | Discarded packets |
| A | 0 | 48371 | 2 |
| B | 0 | 15837 | 2 |
| C | 0 | 25037 | 2 |
| D | 0 | 28527 | 3 |
| Quadrant | Total seconds | Saturated seconds | Saturation percentage |
|---|---|---|---|
| A | 6673 | 4885 | 73.205455% |
| B | 6674 | 98 | 1.468385% |
| C | 6674 | 1071 | 16.047348% |
| D | 6673 | 1910 | 28.622808% |
Noise dominated data is calculated using 1-second bins in cleaned event files. If a bin has >2000 counts, and if more than 50% of those come from <1% of pixels, then it is considered to be noise-dominated and hence unusable.
| Quadrant | # 1 sec bins | Bins with >0 counts | Bins with >2000 counts | High rate bins dominated by noise | Noise dominated (total time) | Noise dominated (detector-on time) | Marked lightcurve |
|---|---|---|---|---|---|---|---|
| A | 7623 | 6673 | 4555 | 4555 | 59.75% | 68.26% | 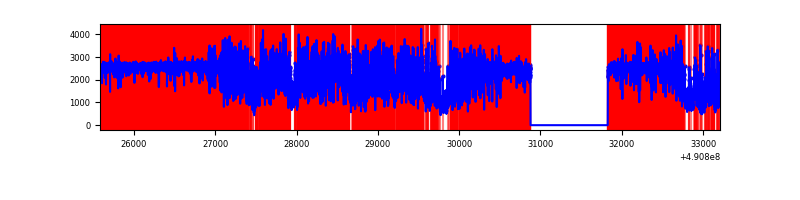 |
| B | 7624 | 6675 | 63 | 63 | 0.83% | 0.94% | 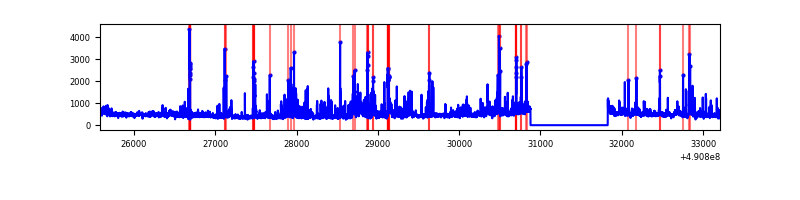 |
| C | 7624 | 6675 | 870 | 870 | 11.41% | 13.03% | 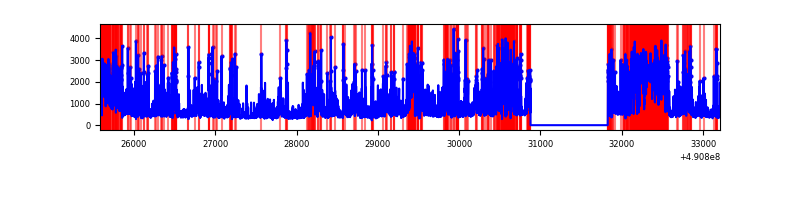 |
| D | 7623 | 6674 | 1450 | 1450 | 19.02% | 21.73% | 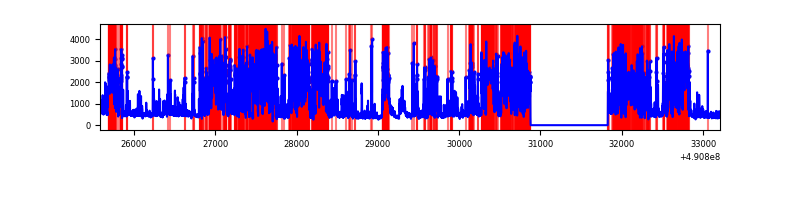 |
Top three noisy pixels from each quadrant. If the there are fewer than three noisy pixels in the level2.evt file, extra rows are filled as -1
| Pixel properties | Quadrant properties | ||||||
|---|---|---|---|---|---|---|---|
| Quadrant | DetID | PixID | Counts | Sigma | Mean | Median | Sigma |
| A | 9 | 191 | 12026399 | 113729.56 | 413 | 402 | 105.7 |
| A | 0 | 8 | 511547 | 4833.89 | 413 | 402 | 105.7 |
| A | 6 | 248 | 226529 | 2138.48 | 413 | 402 | 105.7 |
| B | 0 | 213 | 449427 | 3081.47 | 683 | 658 | 145.6 |
| B | 2 | 249 | 242356 | 1659.62 | 683 | 658 | 145.6 |
| B | 4 | 81 | 87215 | 594.34 | 683 | 658 | 145.6 |
| C | 15 | 224 | 2398178 | 13786.84 | 626 | 619 | 173.9 |
| C | 1 | 241 | 1270559 | 7302.62 | 626 | 619 | 173.9 |
| C | 13 | 3 | 275650 | 1581.53 | 626 | 619 | 173.9 |
| D | 12 | 17 | 4702603 | 28220.64 | 573 | 547 | 166.6 |
| D | 8 | 176 | 364731 | 2185.75 | 573 | 547 | 166.6 |
| D | 2 | 249 | 138642 | 828.81 | 573 | 547 | 166.6 |
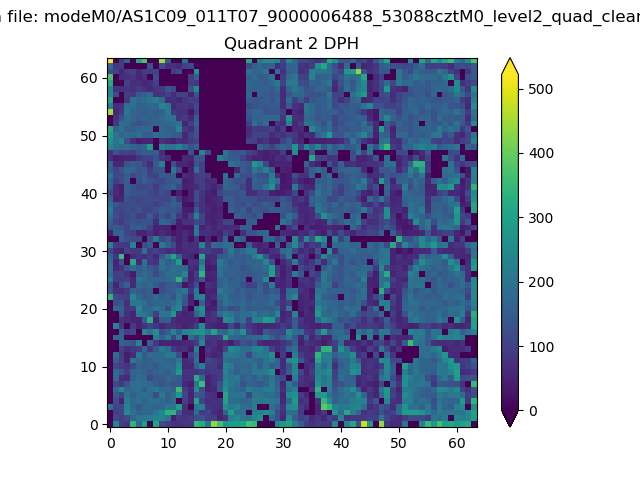
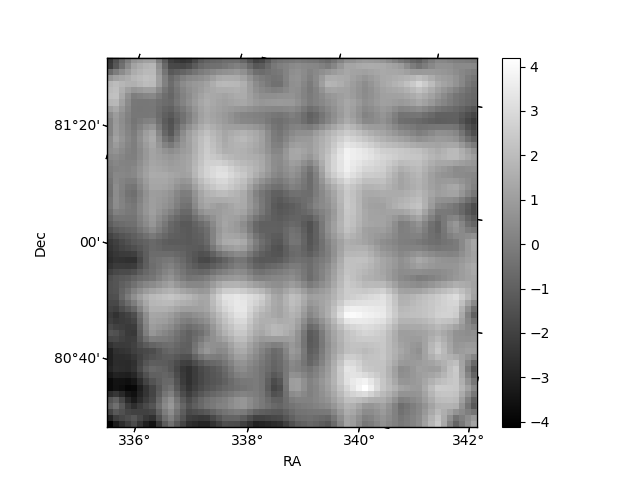
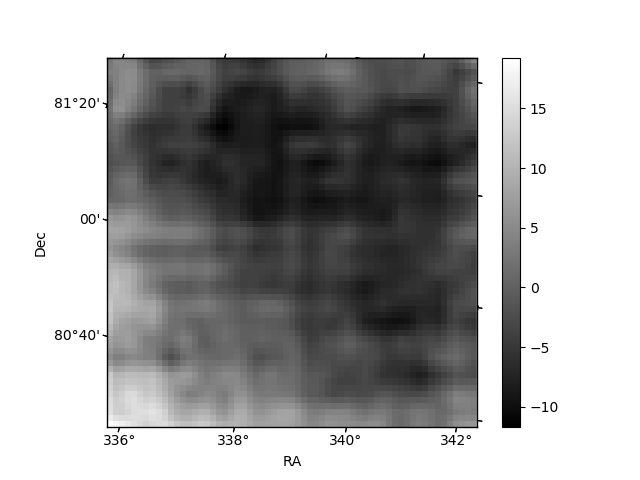
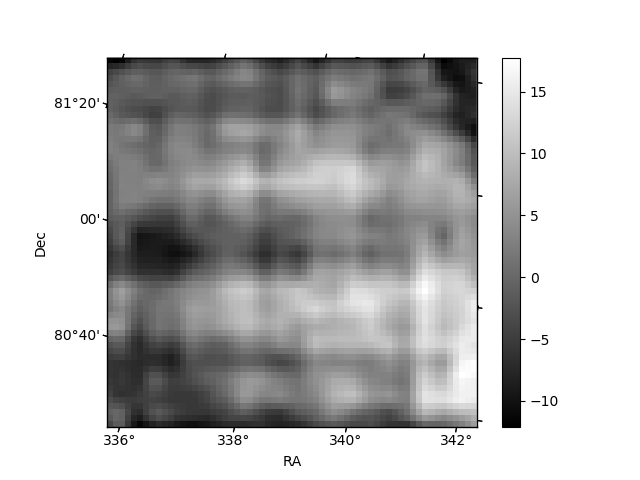
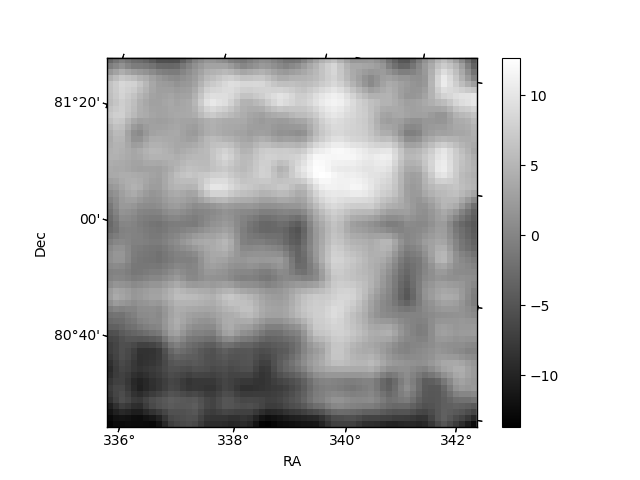
Histogram calculated using DETX and DETY for each event in the final _common_clean file
| Quadrant A | 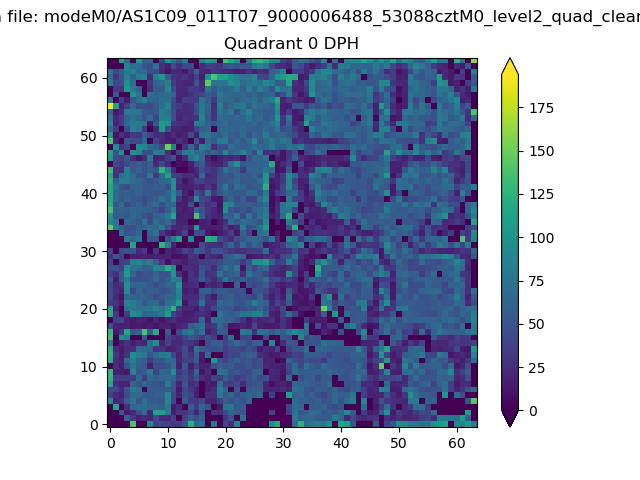 |
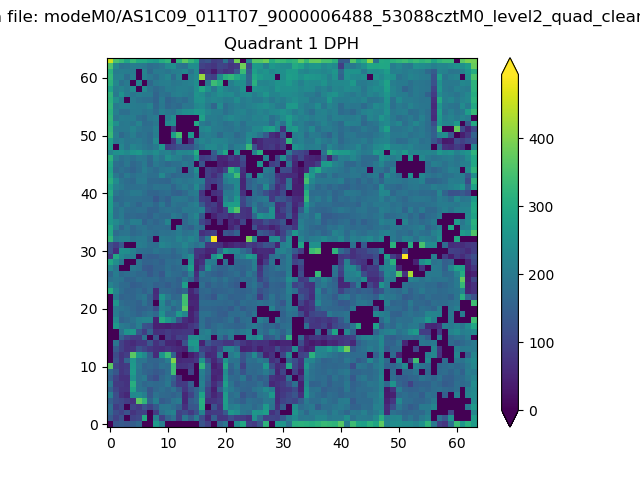 |
Quadrant B |
|---|---|---|---|
| Quadrant D | 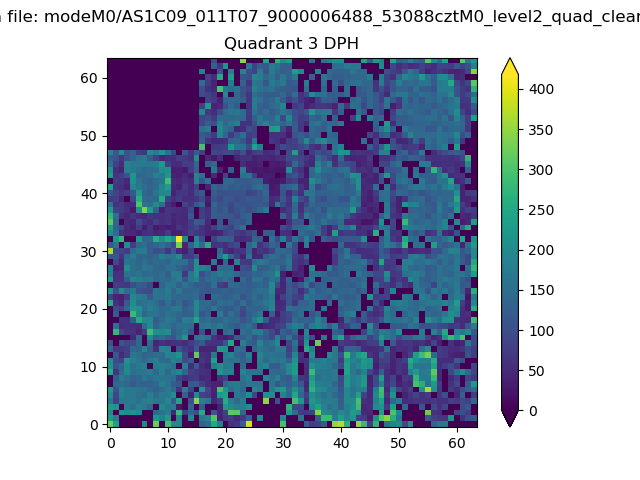 |
 |
Quadrant C |
| Plot type | Count rate plots | Images |
|---|---|---|
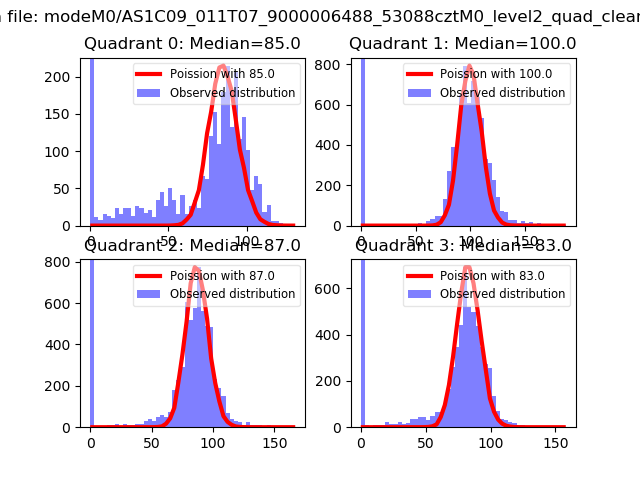
| Comparison with Poisson distribution Blue bars denote a histogram of data divided into 1 sec bins. Red curve is a Poisson curve with rate = median count rate of data. |
 |
 |
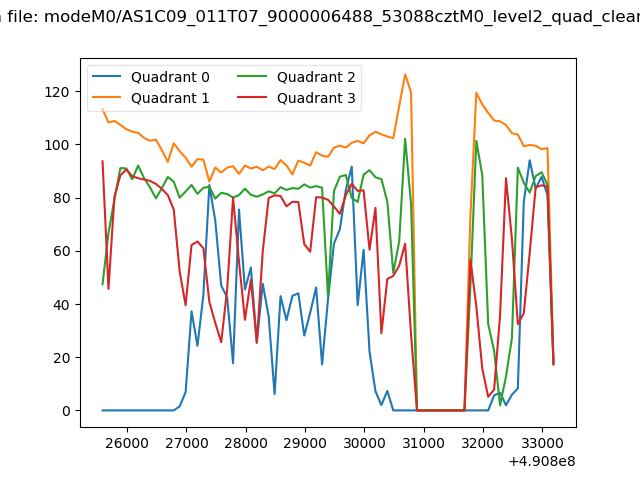
| Quadrant-wise count rates Data is divided into 100 sec bins |
 |
|
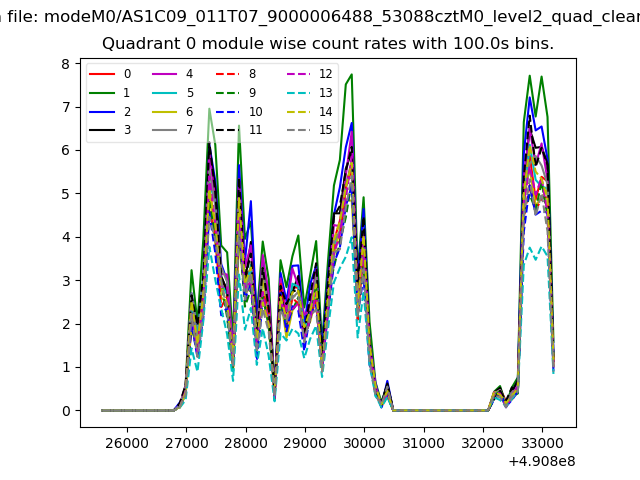
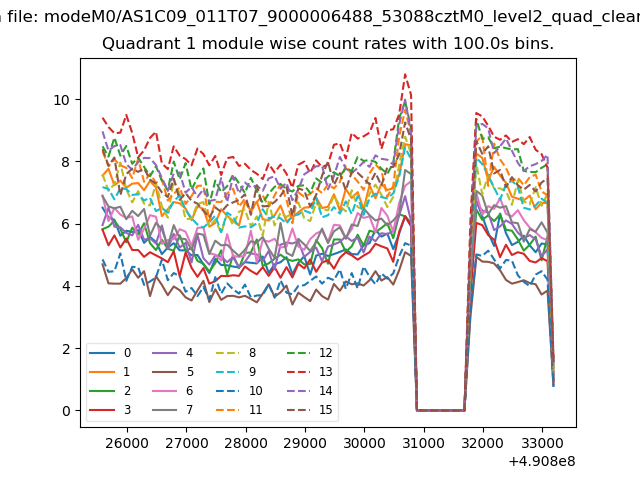
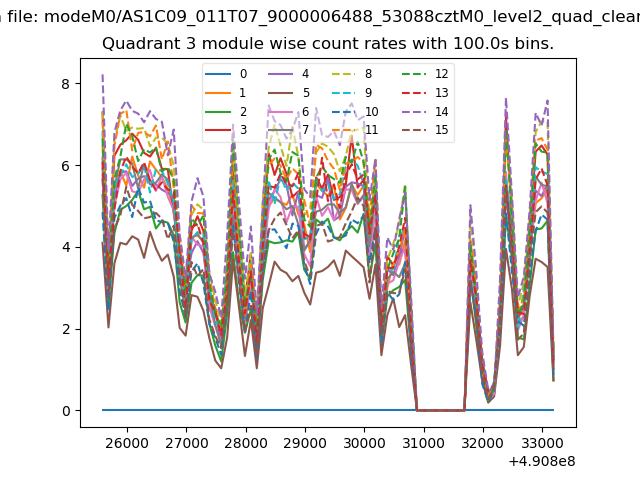
| Module-wise count rates for Quadrant A Data is divided into 100 sec bins |
 |
 |
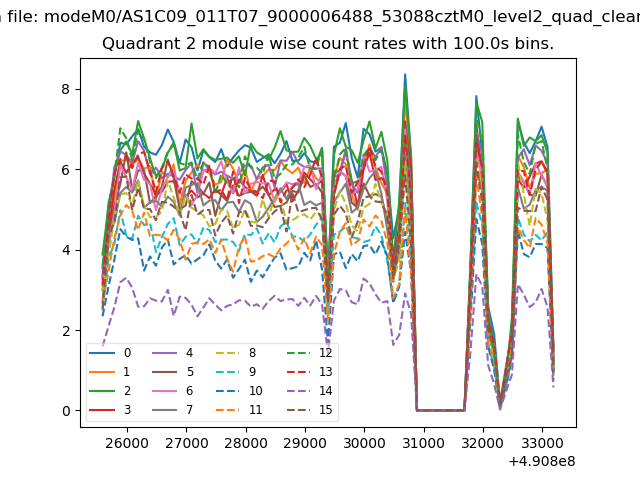
| Module-wise count rates for Quadrant B Data is divided into 100 sec bins |
 |
 |
| Module-wise count rates for Quadrant C Data is divided into 100 sec bins |
 |
 |
| Module-wise count rates for Quadrant D Data is divided into 100 sec bins |
 |
 |
| Parameter | Plot |
|---|---|
| CZT HV Monitor | 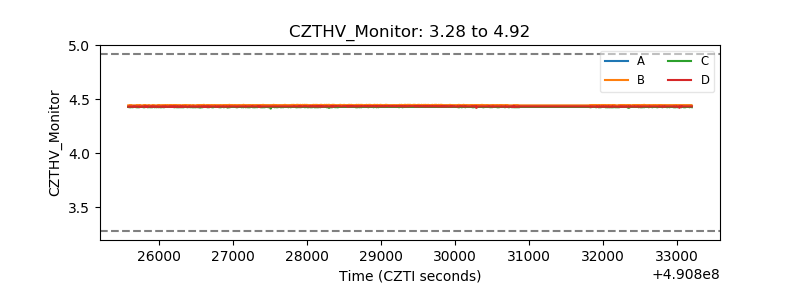 |
| D_VDD | 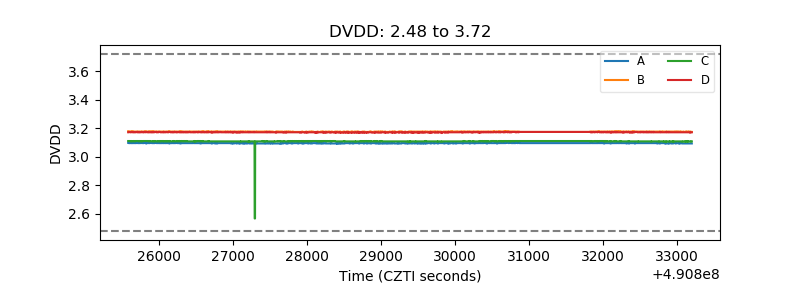 |
| Temperature 1 | 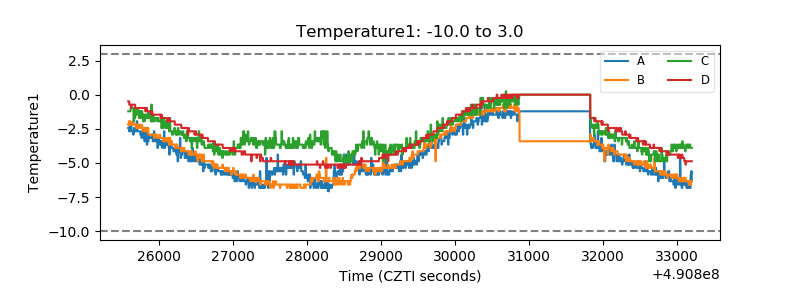 |
| Veto HV Monitor |  |
| Veto LLD | 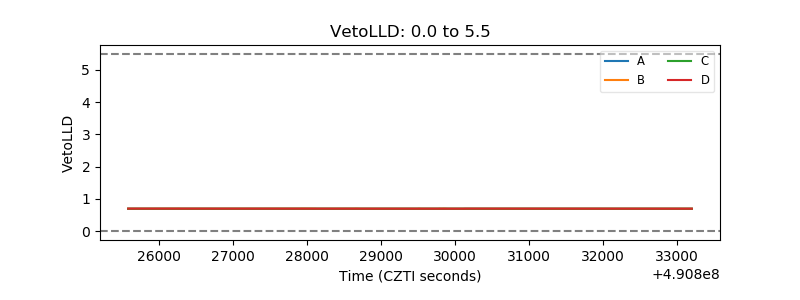 |
| Alpha Counter | 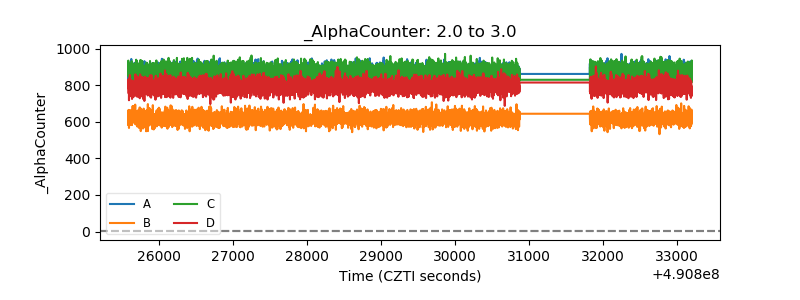 |
| _CPM_Rate | 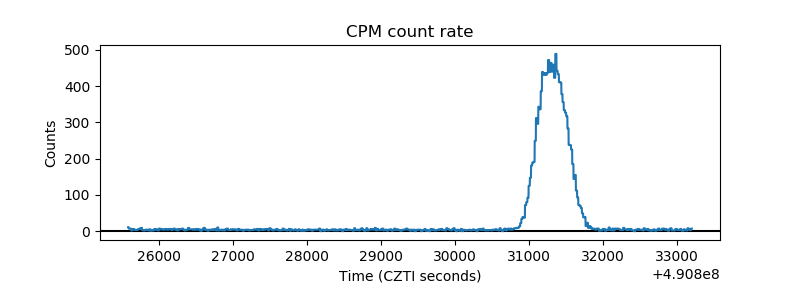 |
| CZT Counter | 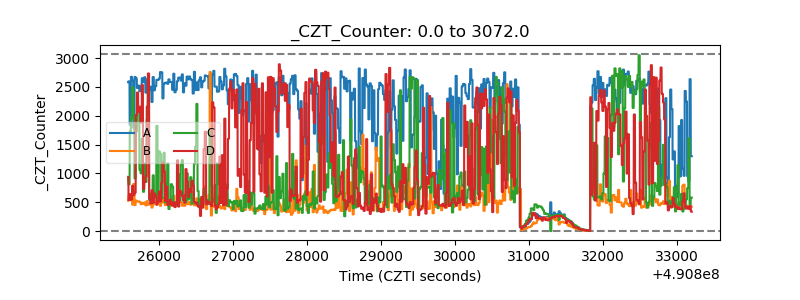 |
| +2.5 Volts monitor | 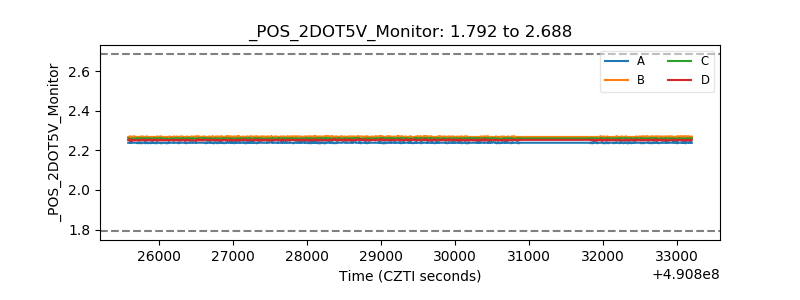 |
| +5 Volts monitor | 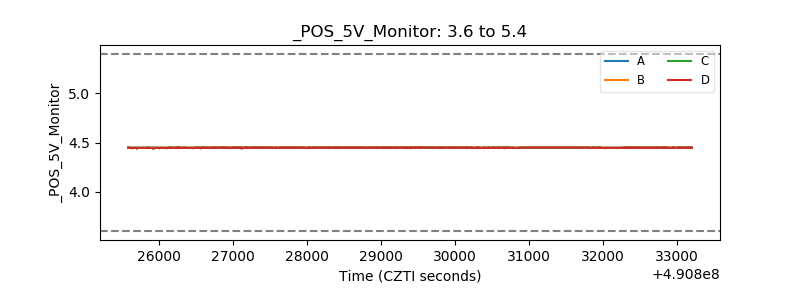 |
| _ROLL_ROT | 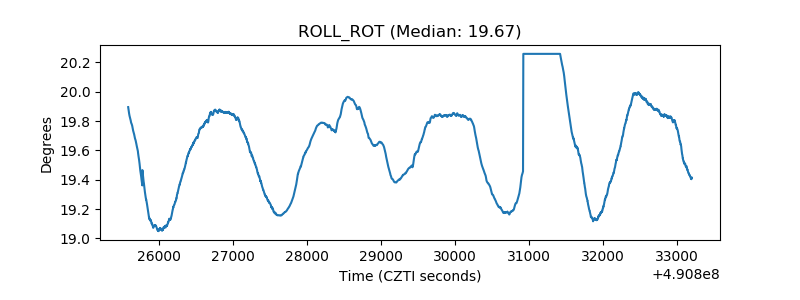 |
| _Roll_DEC | 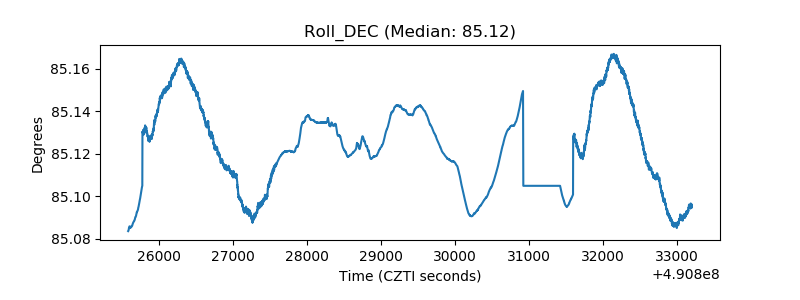 |
| _Roll_RA | 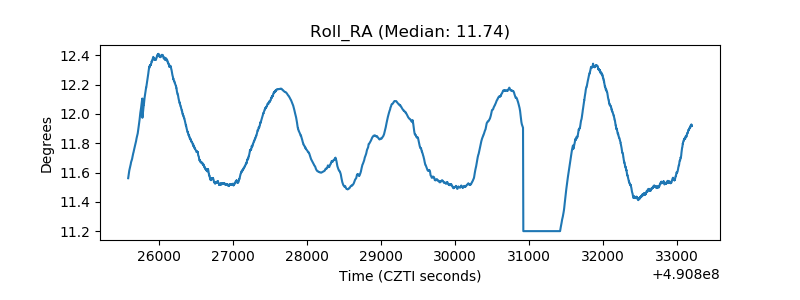 |
| Veto Counter | 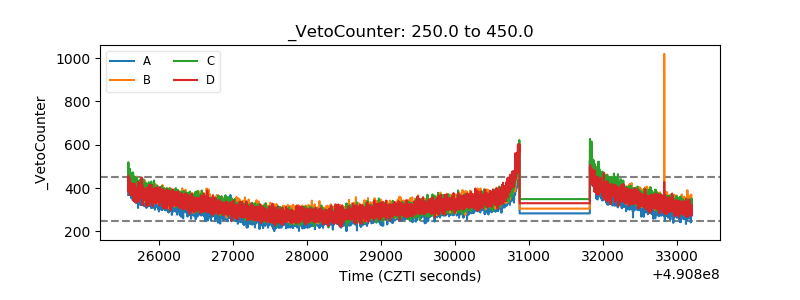 |