| Param | Original file | Final file |
|---|---|---|
| Filename | modeM0/AS1C09_011T07_9000006488_53090cztM0_level2.fits | modeM0/AS1C09_011T07_9000006488_53090cztM0_level2_quad_clean.evt |
| Size (bytes) | 873,322,560 | 76,587,840 |
| Size | 832.9 MB | 73.0 MB |
| Events in quadrant A | 12,072,270 | 352,109 |
| Events in quadrant B | 3,500,003 | 664,329 |
| Events in quadrant C | 9,676,404 | 402,362 |
| Events in quadrant D | 6,572,343 | 443,034 |
| Mode SS | |||
|---|---|---|---|
| Quadrant | BADHDUFLAG | Total packets | Discarded packets |
| A | 0 | 132 | 0 |
| B | 0 | 132 | 0 |
| C | 0 | 132 | 0 |
| D | 0 | 132 | 0 |
| Mode M9 | |||
|---|---|---|---|
| Quadrant | BADHDUFLAG | Total packets | Discarded packets |
| A | 0 | 14 | 0 |
| B | 0 | 15 | 0 |
| C | 0 | 15 | 0 |
| D | 0 | 15 | 0 |
| Mode M0 | |||
|---|---|---|---|
| Quadrant | BADHDUFLAG | Total packets | Discarded packets |
| A | 0 | 40377 | 2 |
| B | 0 | 15255 | 2 |
| C | 0 | 33301 | 2 |
| D | 0 | 24327 | 2 |
| Quadrant | Total seconds | Saturated seconds | Saturation percentage |
|---|---|---|---|
| A | 6551 | 3113 | 47.519463% |
| B | 6551 | 99 | 1.511220% |
| C | 6551 | 2434 | 37.154633% |
| D | 6551 | 1578 | 24.087926% |
Noise dominated data is calculated using 1-second bins in cleaned event files. If a bin has >2000 counts, and if more than 50% of those come from <1% of pixels, then it is considered to be noise-dominated and hence unusable.
| Quadrant | # 1 sec bins | Bins with >0 counts | Bins with >2000 counts | High rate bins dominated by noise | Noise dominated (total time) | Noise dominated (detector-on time) | Marked lightcurve |
|---|---|---|---|---|---|---|---|
| A | 7616 | 6551 | 2902 | 2902 | 38.10% | 44.30% | 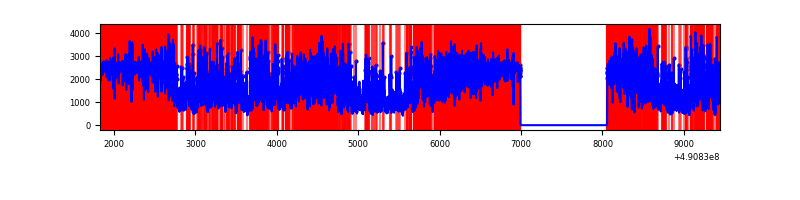 |
| B | 7616 | 6552 | 47 | 47 | 0.62% | 0.72% | 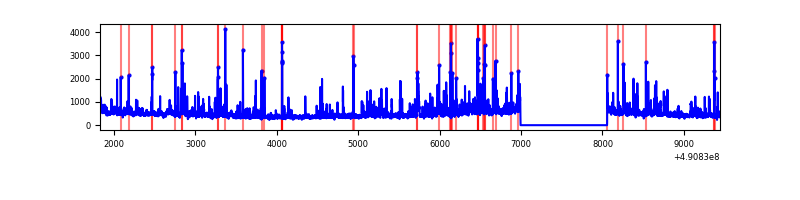 |
| C | 7616 | 6552 | 2219 | 2219 | 29.14% | 33.87% | 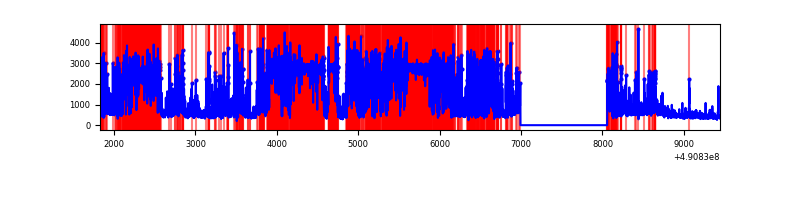 |
| D | 7616 | 6552 | 1081 | 1081 | 14.19% | 16.50% | 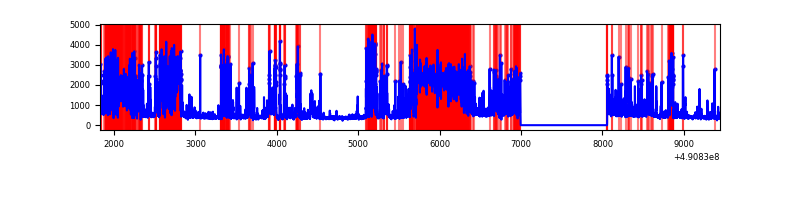 |
Top three noisy pixels from each quadrant. If the there are fewer than three noisy pixels in the level2.evt file, extra rows are filled as -1
| Pixel properties | Quadrant properties | ||||||
|---|---|---|---|---|---|---|---|
| Quadrant | DetID | PixID | Counts | Sigma | Mean | Median | Sigma |
| A | 9 | 191 | 8940153 | 68824.22 | 518 | 507 | 129.9 |
| A | 6 | 248 | 396847 | 3051.33 | 518 | 507 | 129.9 |
| A | 0 | 8 | 264169 | 2029.87 | 518 | 507 | 129.9 |
| B | 2 | 249 | 289401 | 2020.56 | 672 | 649 | 142.9 |
| B | 4 | 81 | 127829 | 889.95 | 672 | 649 | 142.9 |
| B | 0 | 213 | 92198 | 640.62 | 672 | 649 | 142.9 |
| C | 1 | 241 | 4562193 | 29786.62 | 543 | 535 | 153.1 |
| C | 15 | 224 | 2581348 | 16852.14 | 543 | 535 | 153.1 |
| C | 13 | 3 | 84267 | 546.75 | 543 | 535 | 153.1 |
| D | 12 | 17 | 3634725 | 22392.47 | 562 | 535 | 162.3 |
| D | 2 | 153 | 124186 | 761.89 | 562 | 535 | 162.3 |
| D | 3 | 224 | 87603 | 536.48 | 562 | 535 | 162.3 |
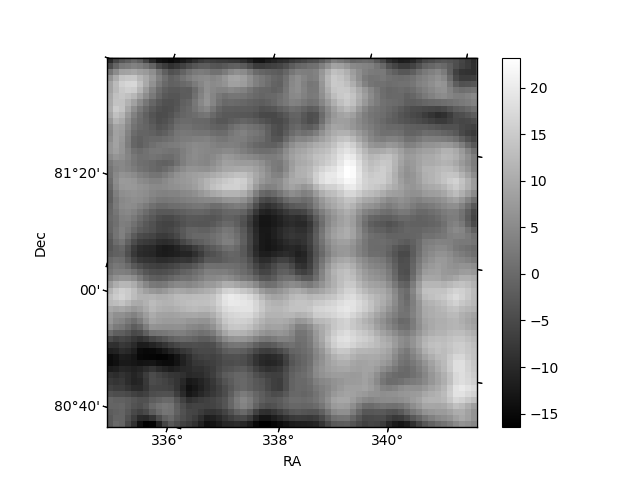
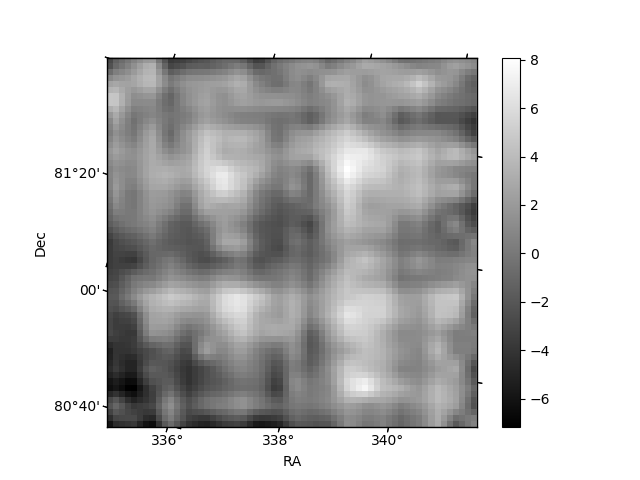
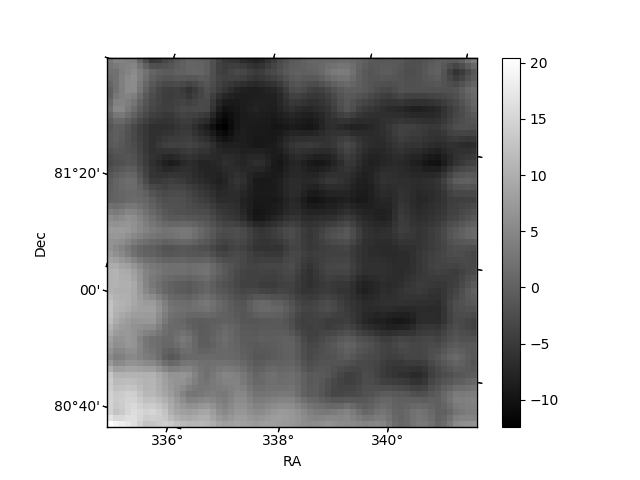
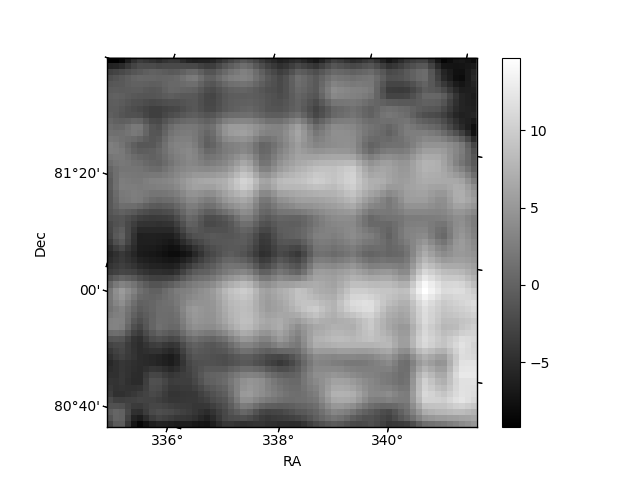
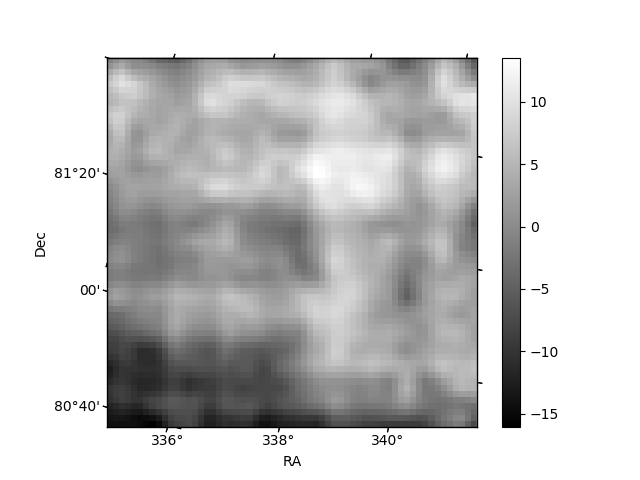
Histogram calculated using DETX and DETY for each event in the final _common_clean file
| Quadrant A | 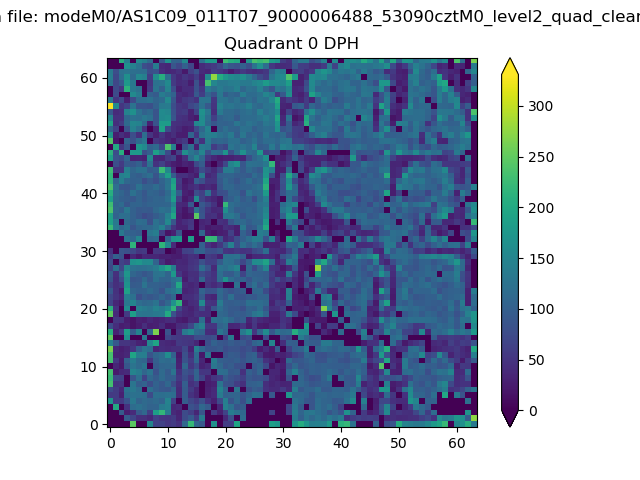 |
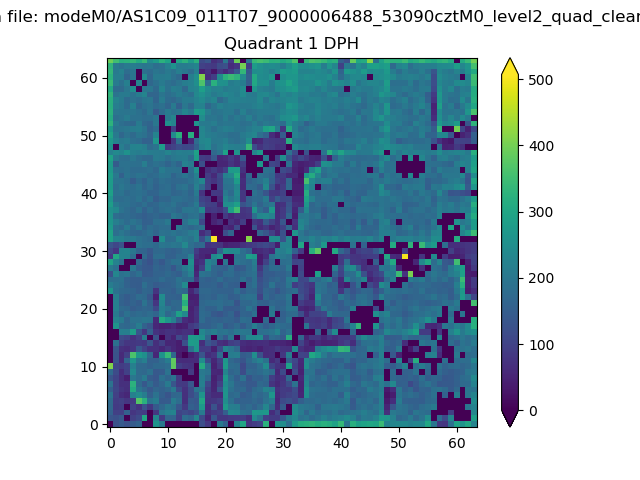 |
Quadrant B |
|---|---|---|---|
| Quadrant D | 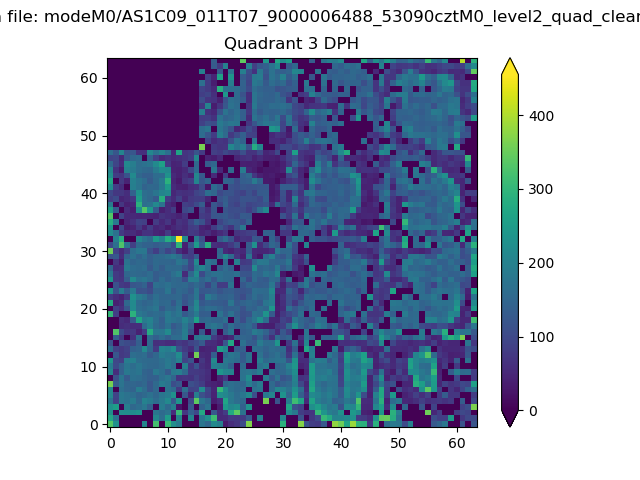 |
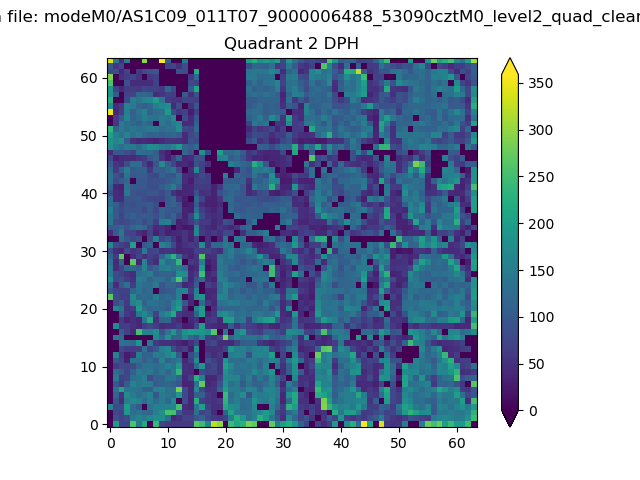 |
Quadrant C |
| Plot type | Count rate plots | Images |
|---|---|---|
| Comparison with Poisson distribution Blue bars denote a histogram of data divided into 1 sec bins. Red curve is a Poisson curve with rate = median count rate of data. |
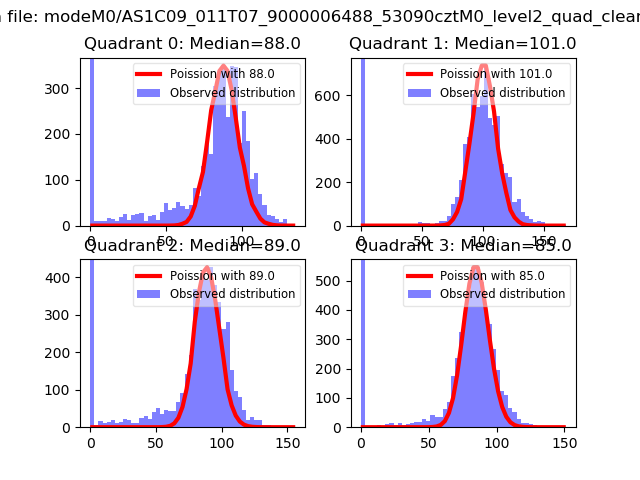 |
 |
| Quadrant-wise count rates Data is divided into 100 sec bins |
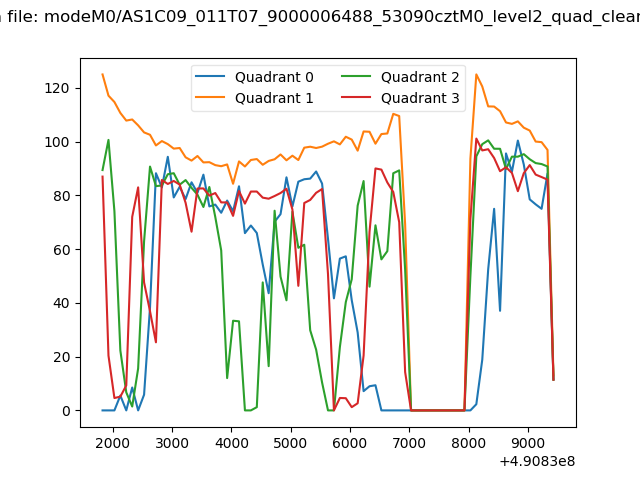 |
|
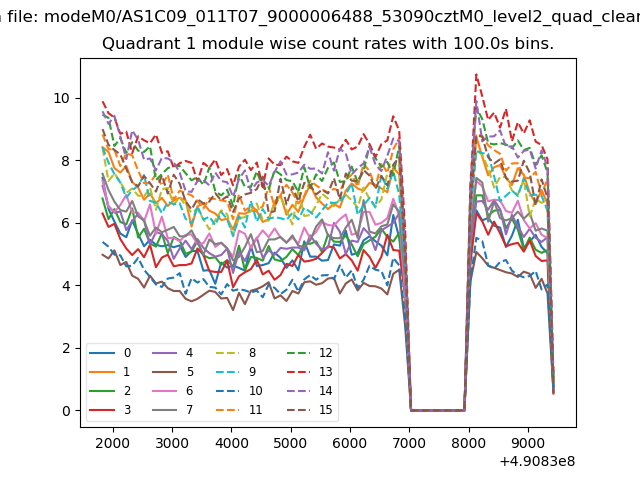
| Module-wise count rates for Quadrant A Data is divided into 100 sec bins |
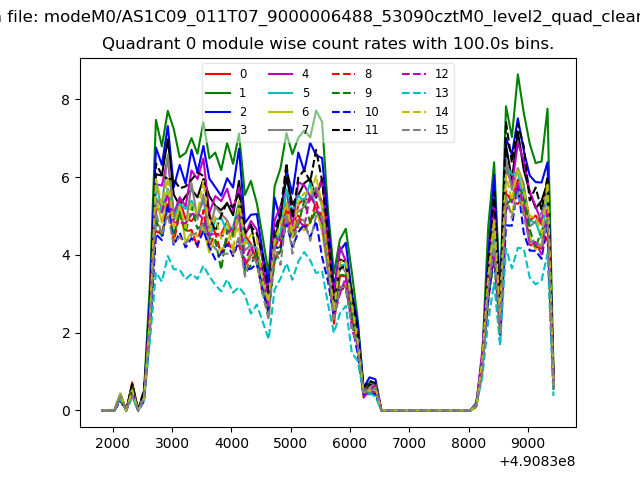 |
 |
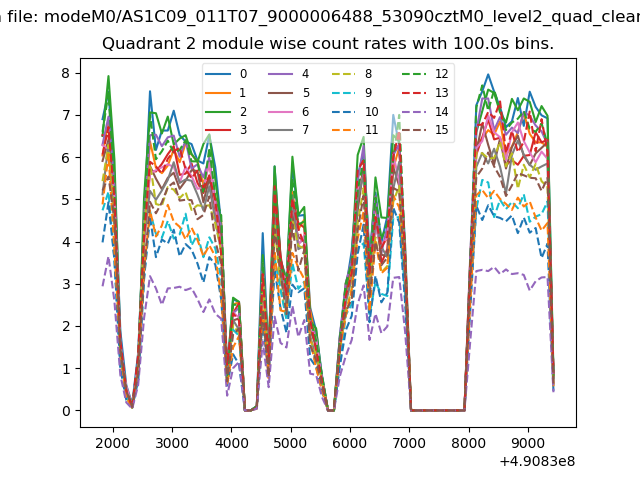
| Module-wise count rates for Quadrant B Data is divided into 100 sec bins |
 |
 |
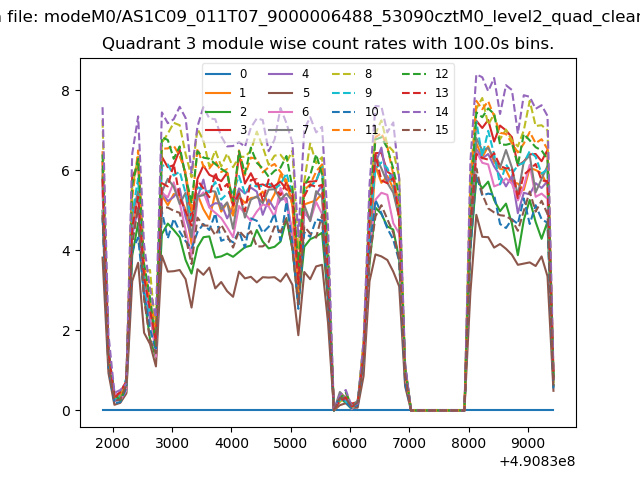
| Module-wise count rates for Quadrant C Data is divided into 100 sec bins |
 |
 |
| Module-wise count rates for Quadrant D Data is divided into 100 sec bins |
 |
 |
| Parameter | Plot |
|---|---|
| CZT HV Monitor | 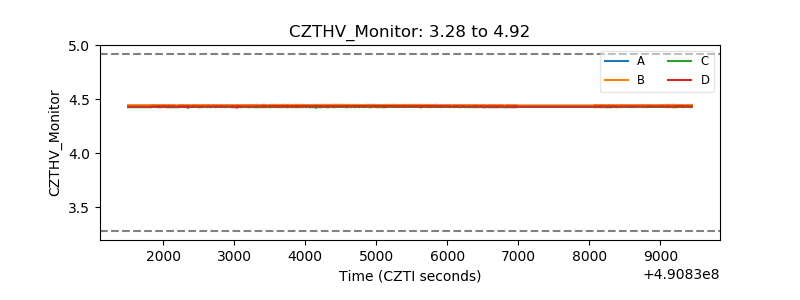 |
| D_VDD | 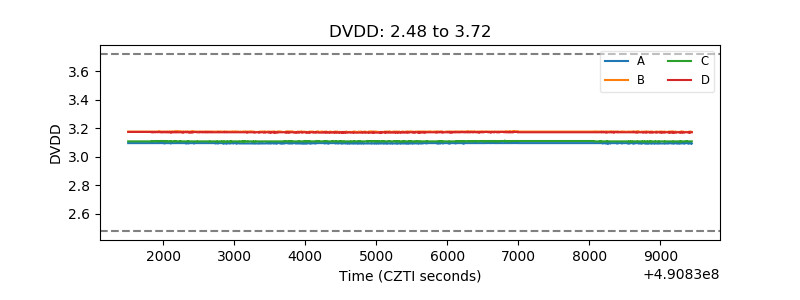 |
| Temperature 1 | 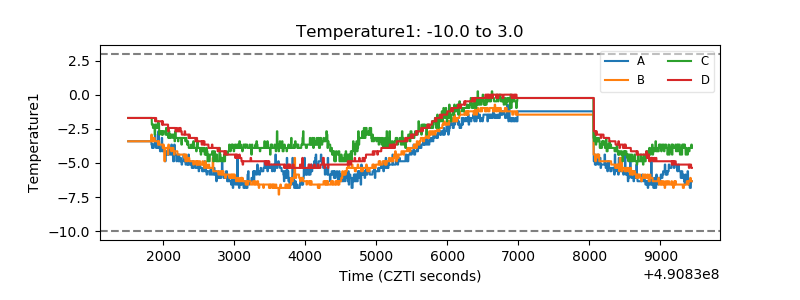 |
| Veto HV Monitor | 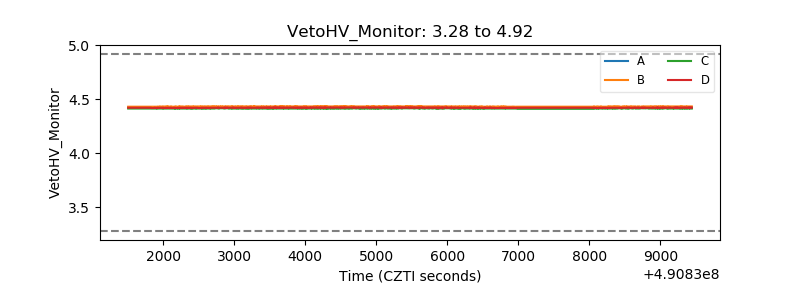 |
| Veto LLD | 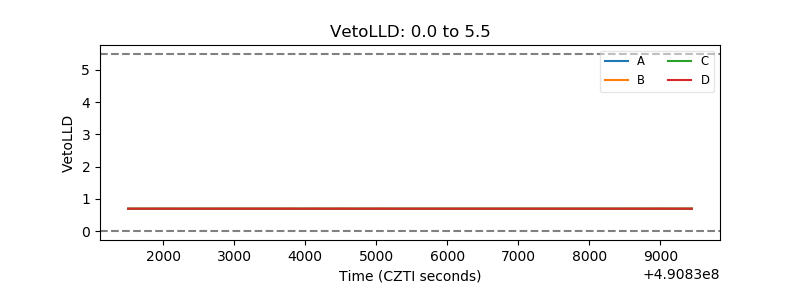 |
| Alpha Counter | 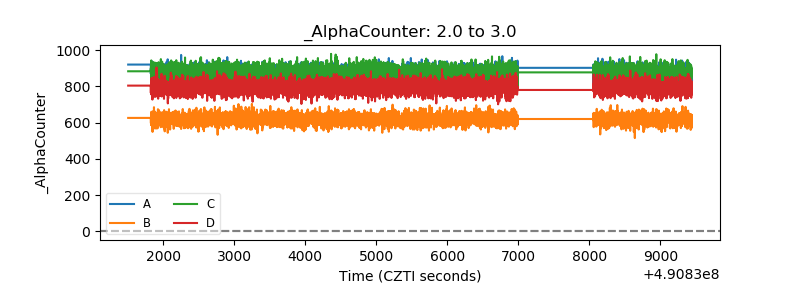 |
| _CPM_Rate | 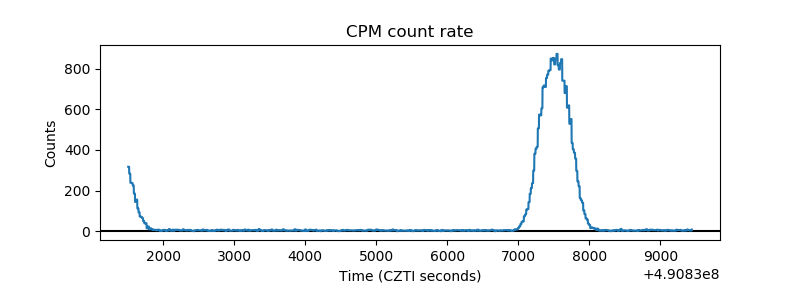 |
| CZT Counter | 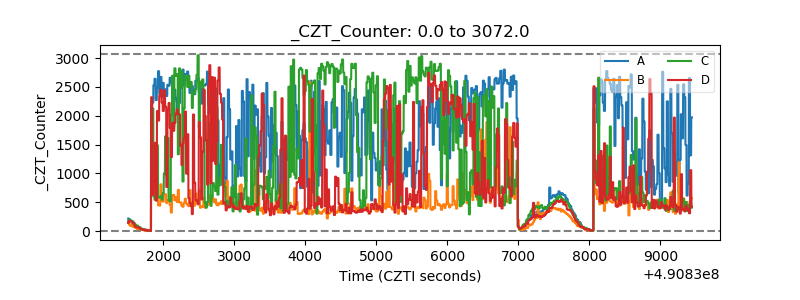 |
| +2.5 Volts monitor |  |
| +5 Volts monitor |  |
| _ROLL_ROT | 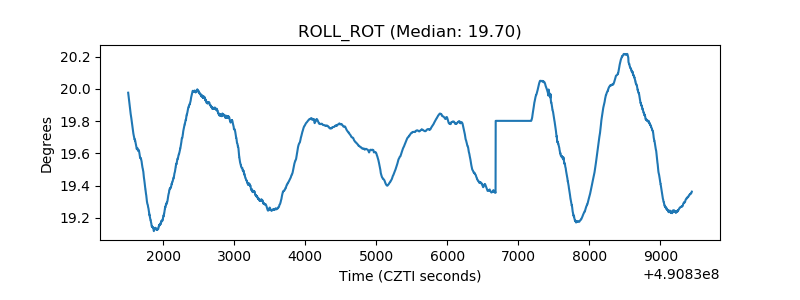 |
| _Roll_DEC | 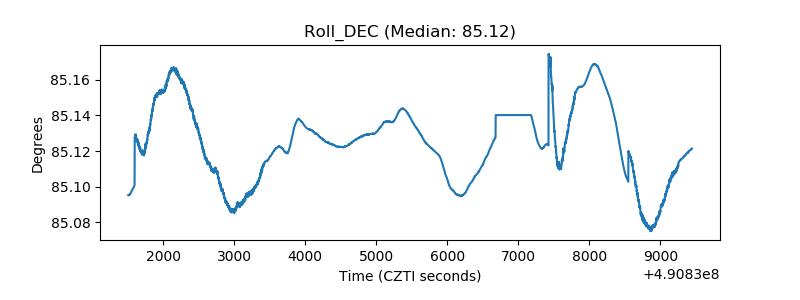 |
| _Roll_RA | 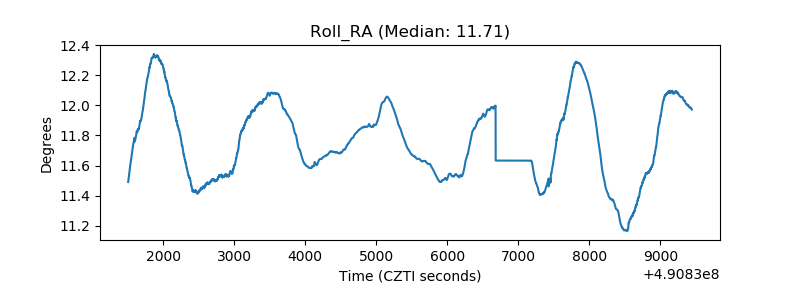 |
| Veto Counter | 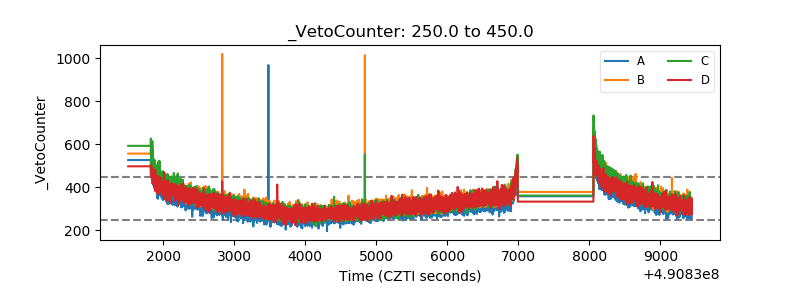 |