| Param | Original file | Final file |
|---|---|---|
| Filename | modeM0/AS1C09_011T07_9000006488_53092cztM0_level2.fits | modeM0/AS1C09_011T07_9000006488_53092cztM0_level2_quad_clean.evt |
| Size (bytes) | 813,890,880 | 65,102,400 |
| Size | 776.2 MB | 62.1 MB |
| Events in quadrant A | 12,509,151 | 198,477 |
| Events in quadrant B | 2,953,562 | 599,076 |
| Events in quadrant C | 11,057,451 | 273,785 |
| Events in quadrant D | 3,162,842 | 497,797 |
| Mode SS | |||
|---|---|---|---|
| Quadrant | BADHDUFLAG | Total packets | Discarded packets |
| A | 0 | 118 | 0 |
| B | 0 | 118 | 0 |
| C | 0 | 118 | 0 |
| D | 0 | 118 | 0 |
| Mode M9 | |||
|---|---|---|---|
| Quadrant | BADHDUFLAG | Total packets | Discarded packets |
| A | 0 | 12 | 0 |
| B | 0 | 12 | 0 |
| C | 0 | 12 | 0 |
| D | 0 | 12 | 0 |
| Mode M0 | |||
|---|---|---|---|
| Quadrant | BADHDUFLAG | Total packets | Discarded packets |
| A | 0 | 41044 | 1 |
| B | 0 | 13038 | 1 |
| C | 0 | 36727 | 1 |
| D | 0 | 13784 | 1 |
| Quadrant | Total seconds | Saturated seconds | Saturation percentage |
|---|---|---|---|
| A | 5742 | 4027 | 70.132358% |
| B | 5742 | 70 | 1.219087% |
| C | 5743 | 3088 | 53.769807% |
| D | 5743 | 121 | 2.106913% |
Noise dominated data is calculated using 1-second bins in cleaned event files. If a bin has >2000 counts, and if more than 50% of those come from <1% of pixels, then it is considered to be noise-dominated and hence unusable.
| Quadrant | # 1 sec bins | Bins with >0 counts | Bins with >2000 counts | High rate bins dominated by noise | Noise dominated (total time) | Noise dominated (detector-on time) | Marked lightcurve |
|---|---|---|---|---|---|---|---|
| A | 6962 | 5742 | 3657 | 3657 | 52.53% | 63.69% | 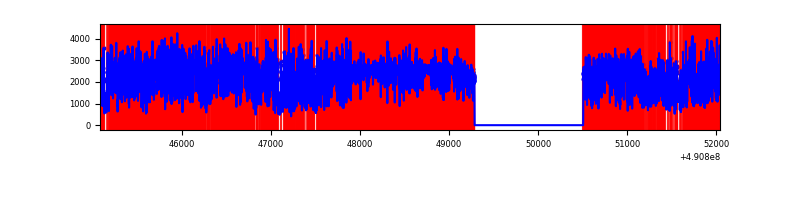 |
| B | 6962 | 5743 | 53 | 53 | 0.76% | 0.92% | 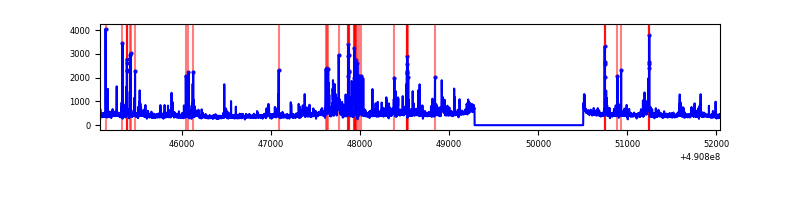 |
| C | 6963 | 5743 | 2937 | 2937 | 42.18% | 51.14% | 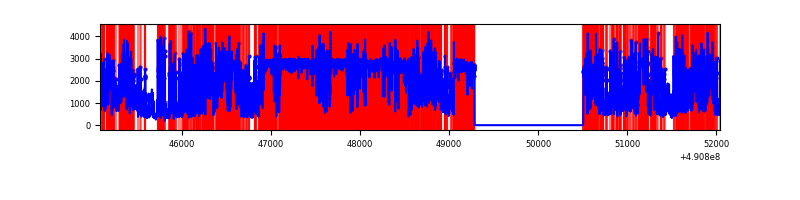 |
| D | 6963 | 5744 | 99 | 99 | 1.42% | 1.72% | 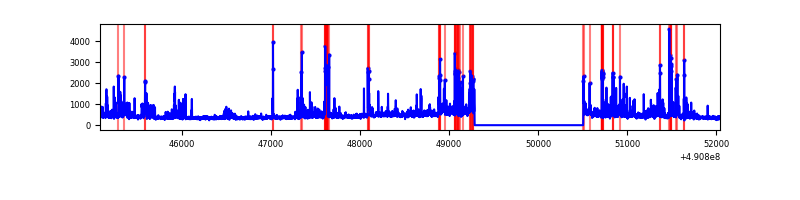 |
Top three noisy pixels from each quadrant. If the there are fewer than three noisy pixels in the level2.evt file, extra rows are filled as -1
| Pixel properties | Quadrant properties | ||||||
|---|---|---|---|---|---|---|---|
| Quadrant | DetID | PixID | Counts | Sigma | Mean | Median | Sigma |
| A | 9 | 191 | 7148509 | 70292.69 | 399 | 390 | 101.7 |
| A | 6 | 248 | 2893052 | 28445.67 | 399 | 390 | 101.7 |
| A | 12 | 80 | 272007 | 2671.01 | 399 | 390 | 101.7 |
| B | 2 | 249 | 274166 | 2208.7 | 582 | 565 | 123.9 |
| B | 0 | 213 | 87943 | 705.38 | 582 | 565 | 123.9 |
| B | 4 | 216 | 52185 | 416.71 | 582 | 565 | 123.9 |
| C | 1 | 241 | 5699851 | 51361.87 | 396 | 393 | 111.0 |
| C | 15 | 224 | 2325138 | 20949.93 | 396 | 393 | 111.0 |
| C | 9 | 38 | 954164 | 8595.11 | 396 | 393 | 111.0 |
| D | 11 | 245 | 240617 | 1487.72 | 558 | 532 | 161.4 |
| D | 2 | 62 | 123367 | 761.16 | 558 | 532 | 161.4 |
| D | 2 | 172 | 112936 | 696.53 | 558 | 532 | 161.4 |
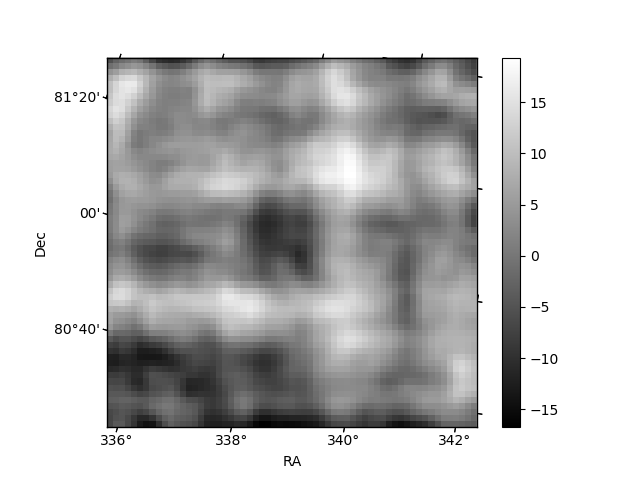
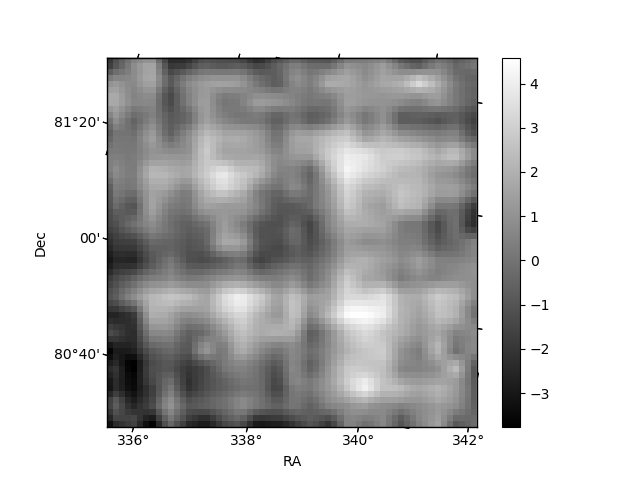
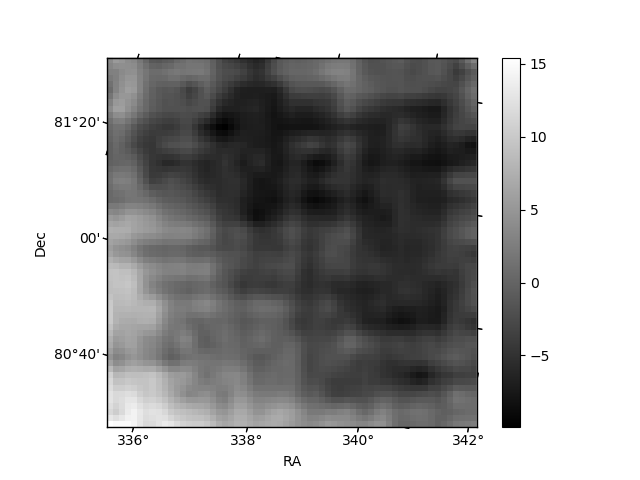
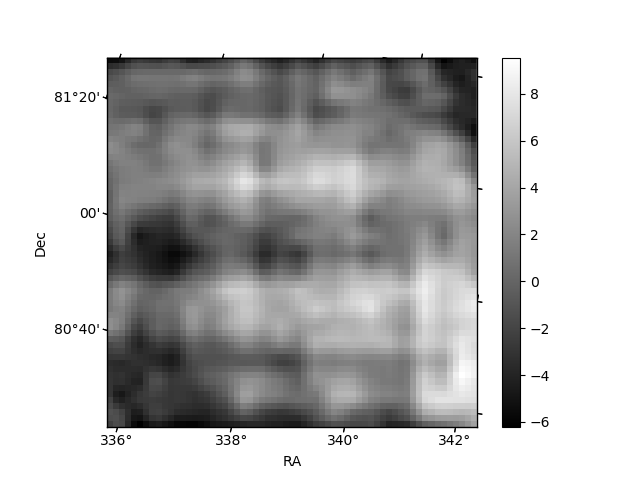
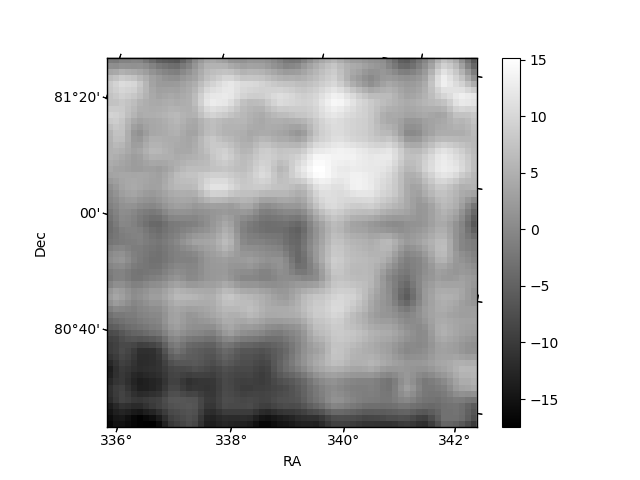
Histogram calculated using DETX and DETY for each event in the final _common_clean file
| Quadrant A | 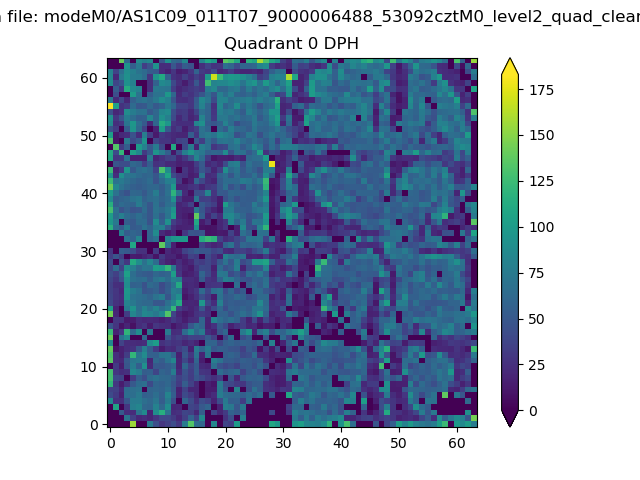 |
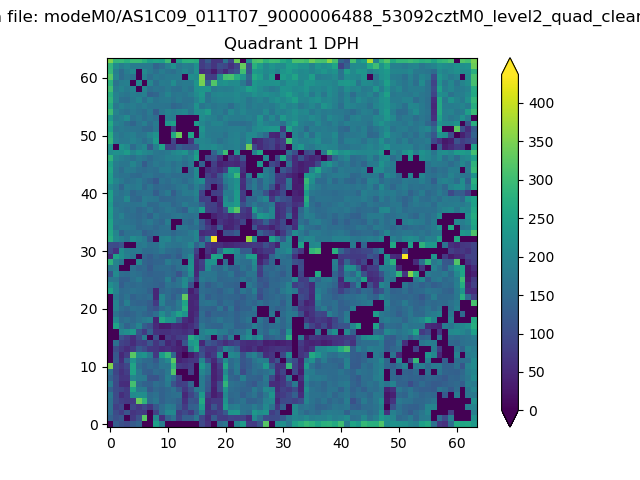 |
Quadrant B |
|---|---|---|---|
| Quadrant D | 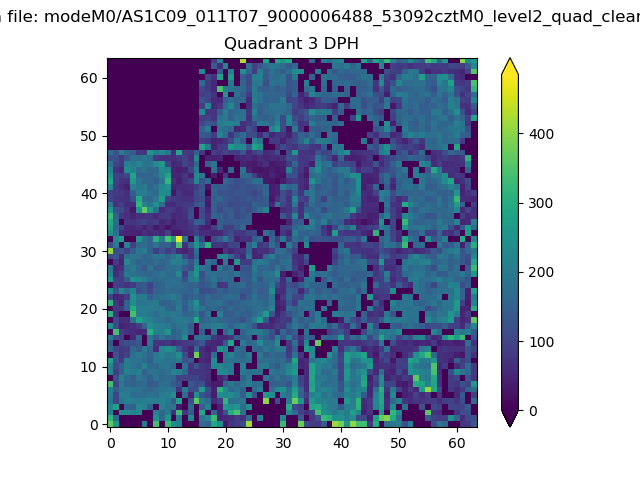 |
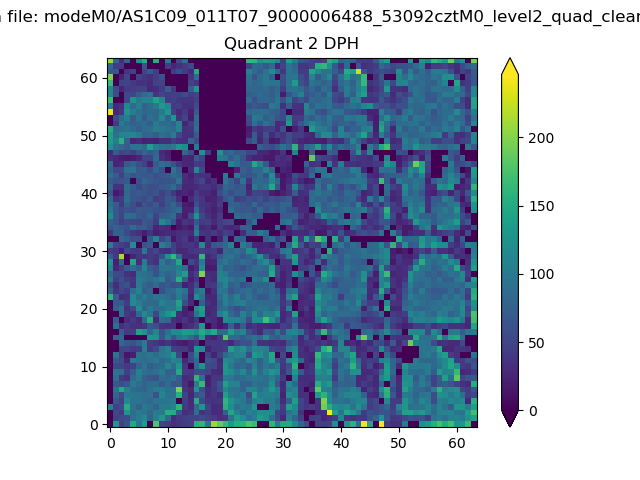 |
Quadrant C |
| Plot type | Count rate plots | Images |
|---|---|---|
| Comparison with Poisson distribution Blue bars denote a histogram of data divided into 1 sec bins. Red curve is a Poisson curve with rate = median count rate of data. |
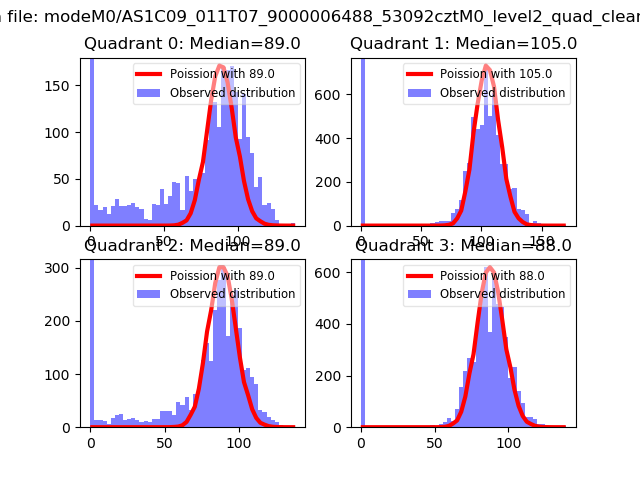 |
 |
| Quadrant-wise count rates Data is divided into 100 sec bins |
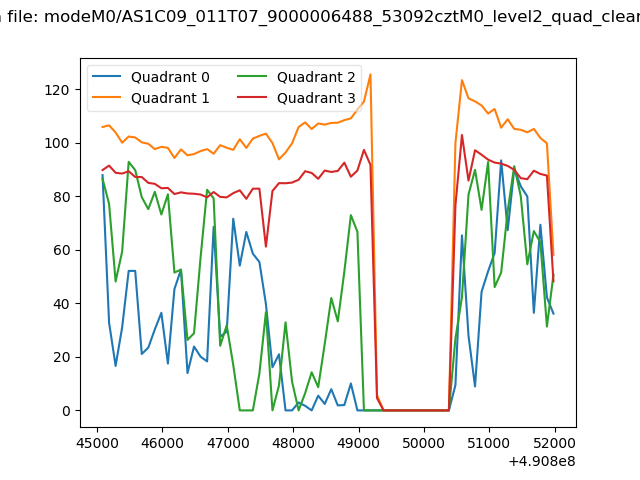 |
|
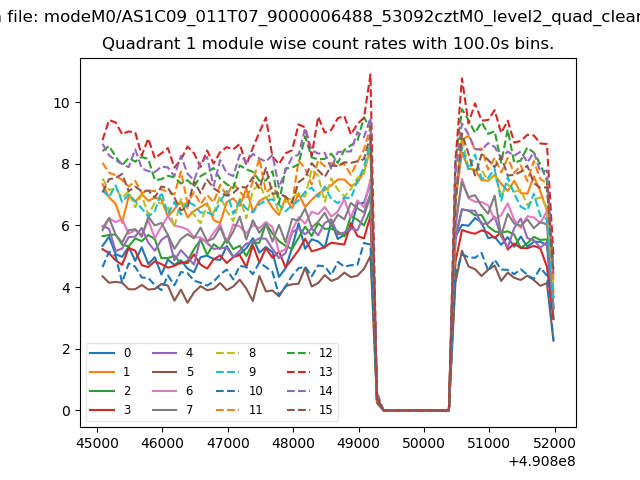
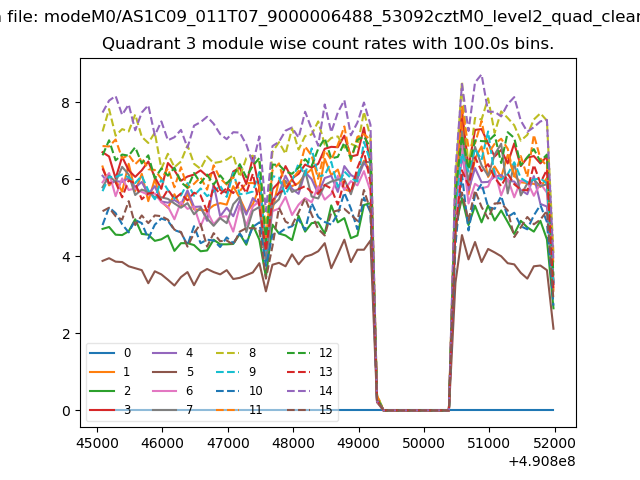
| Module-wise count rates for Quadrant A Data is divided into 100 sec bins |
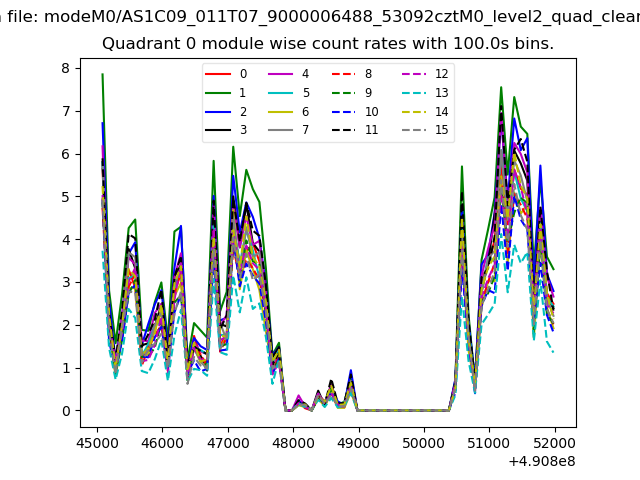 |
 |
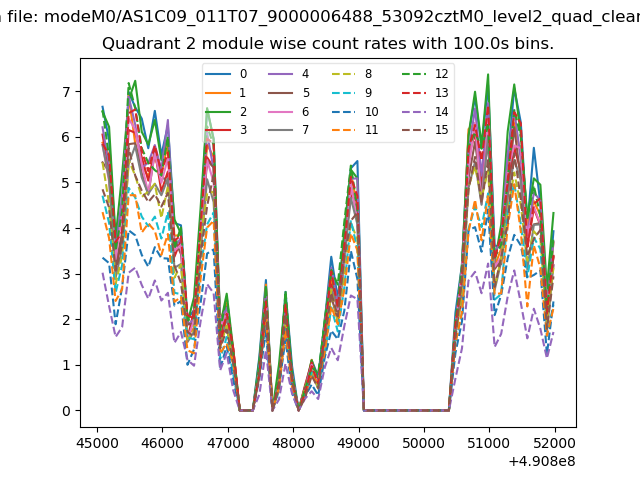
| Module-wise count rates for Quadrant B Data is divided into 100 sec bins |
 |
 |
| Module-wise count rates for Quadrant C Data is divided into 100 sec bins |
 |
 |
| Module-wise count rates for Quadrant D Data is divided into 100 sec bins |
 |
 |
| Parameter | Plot |
|---|---|
| CZT HV Monitor |  |
| D_VDD | 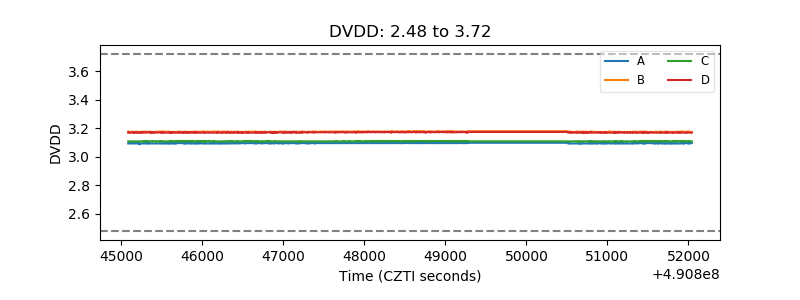 |
| Temperature 1 | 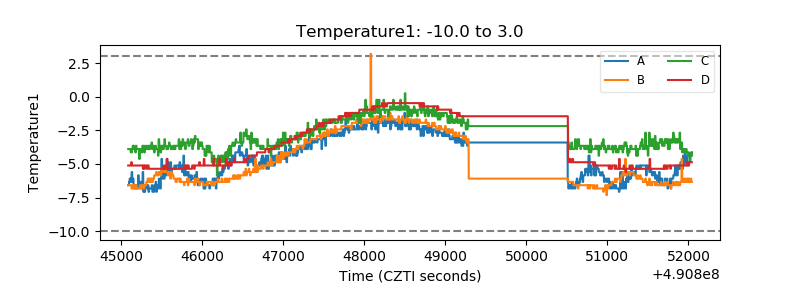 |
| Veto HV Monitor | 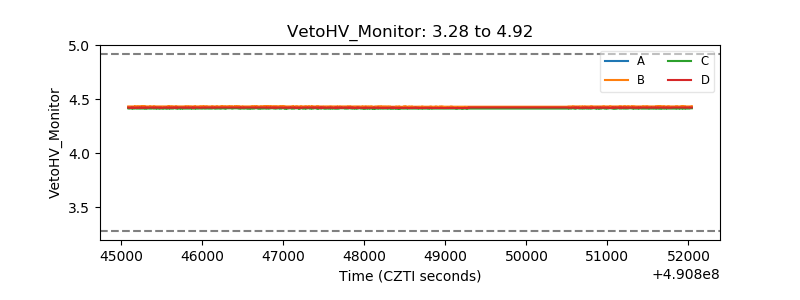 |
| Veto LLD | 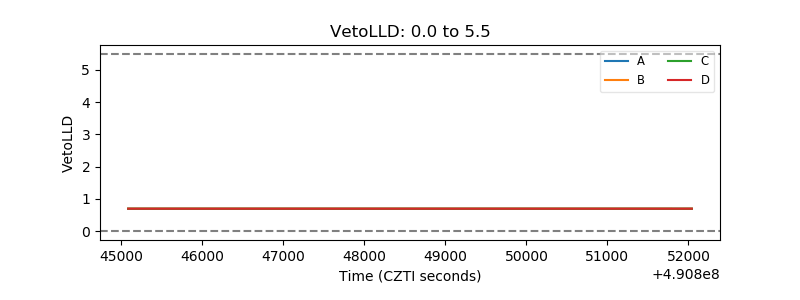 |
| Alpha Counter | 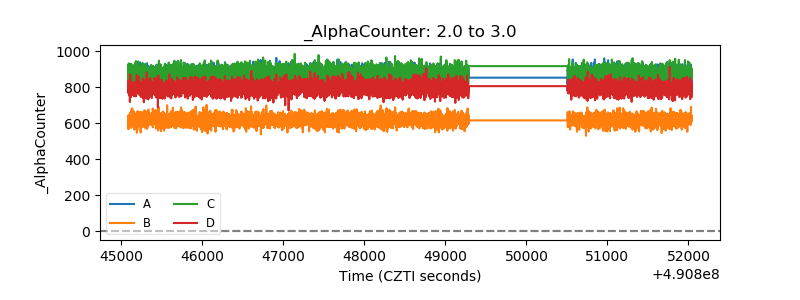 |
| _CPM_Rate | 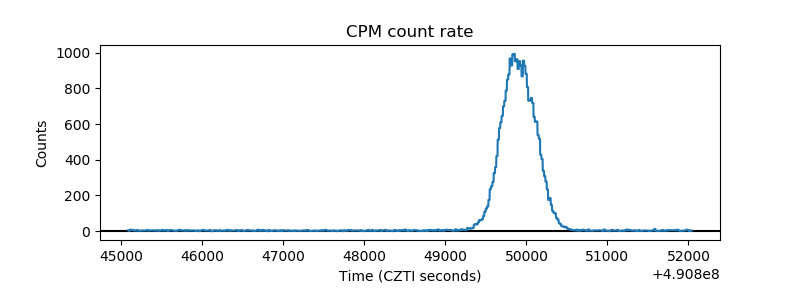 |
| CZT Counter | 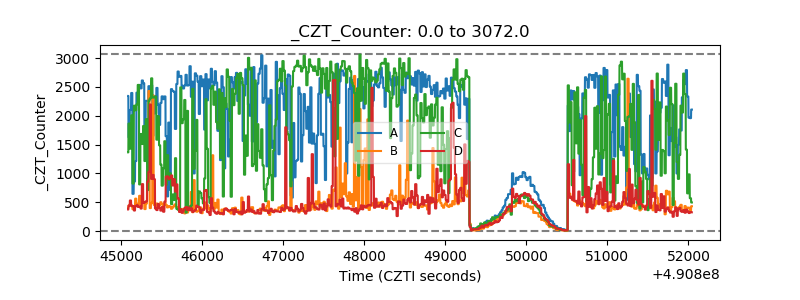 |
| +2.5 Volts monitor | 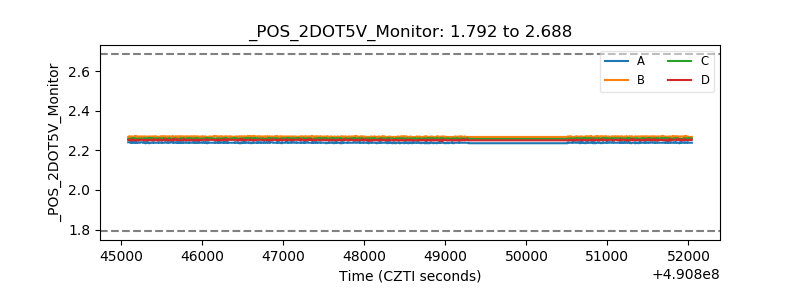 |
| +5 Volts monitor | 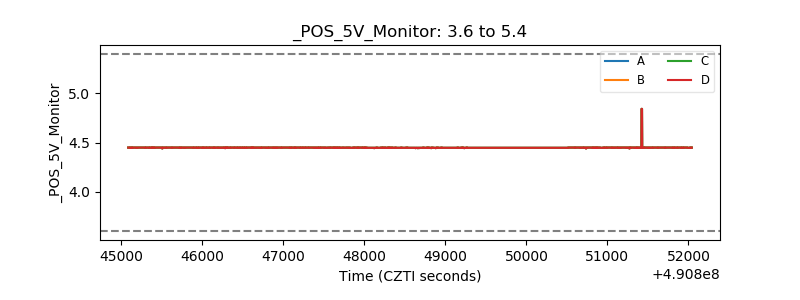 |
| _ROLL_ROT | 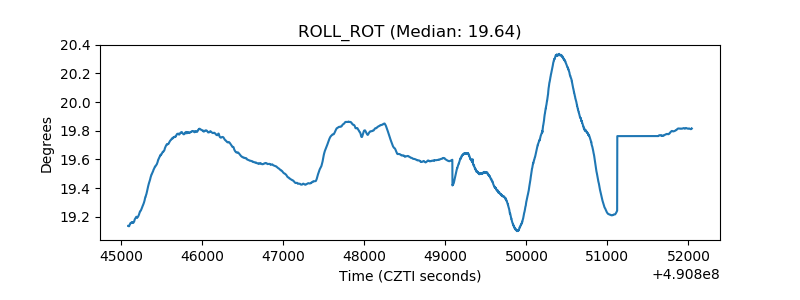 |
| _Roll_DEC | 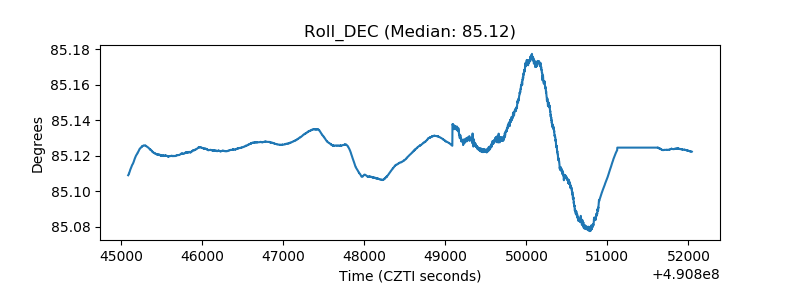 |
| _Roll_RA | 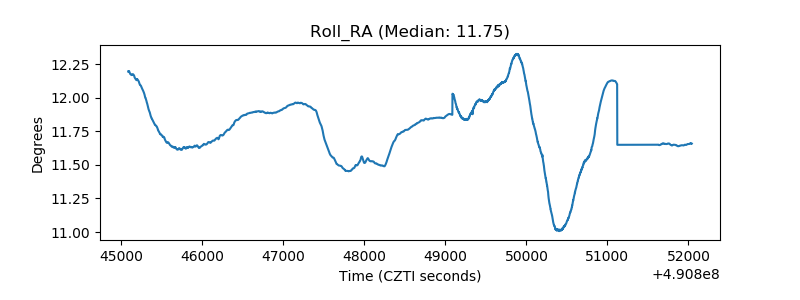 |
| Veto Counter | 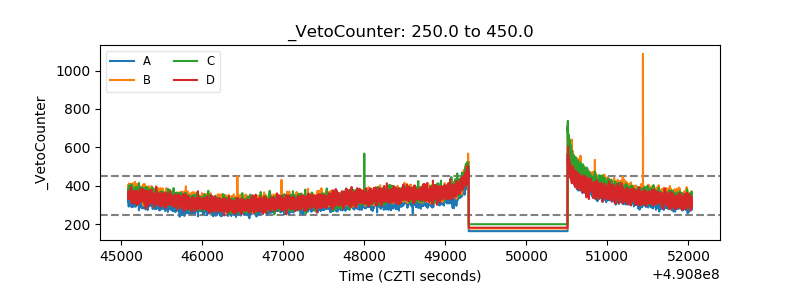 |