| Param | Original file | Final file |
|---|---|---|
| Filename | modeM0/AS1C09_011T07_9000006488_53095cztM0_level2.fits | modeM0/AS1C09_011T07_9000006488_53095cztM0_level2_quad_clean.evt |
| Size (bytes) | 961,813,440 | 69,730,560 |
| Size | 917.3 MB | 66.5 MB |
| Events in quadrant A | 14,397,535 | 161,649 |
| Events in quadrant B | 4,460,205 | 641,212 |
| Events in quadrant C | 11,533,468 | 331,865 |
| Events in quadrant D | 4,707,698 | 520,572 |
| Mode SS | |||
|---|---|---|---|
| Quadrant | BADHDUFLAG | Total packets | Discarded packets |
| A | 0 | 135 | 1 |
| B | 0 | 136 | 0 |
| C | 0 | 136 | 0 |
| D | 0 | 136 | 0 |
| Mode M9 | |||
|---|---|---|---|
| Quadrant | BADHDUFLAG | Total packets | Discarded packets |
| A | 0 | 7 | 0 |
| B | 0 | 7 | 0 |
| C | 0 | 7 | 0 |
| D | 0 | 7 | 0 |
| Mode M0 | |||
|---|---|---|---|
| Quadrant | BADHDUFLAG | Total packets | Discarded packets |
| A | 0 | 47637 | 374 |
| B | 0 | 17927 | 64 |
| C | 0 | 39020 | 298 |
| D | 0 | 18831 | 116 |
| Quadrant | Total seconds | Saturated seconds | Saturation percentage |
|---|---|---|---|
| A | 6507 | 5083 | 78.115875% |
| B | 6539 | 257 | 3.930265% |
| C | 6515 | 3119 | 47.874137% |
| D | 6530 | 499 | 7.641654% |
Noise dominated data is calculated using 1-second bins in cleaned event files. If a bin has >2000 counts, and if more than 50% of those come from <1% of pixels, then it is considered to be noise-dominated and hence unusable.
| Quadrant | # 1 sec bins | Bins with >0 counts | Bins with >2000 counts | High rate bins dominated by noise | Noise dominated (total time) | Noise dominated (detector-on time) | Marked lightcurve |
|---|---|---|---|---|---|---|---|
| A | 7315 | 6535 | 4526 | 4526 | 61.87% | 69.26% | 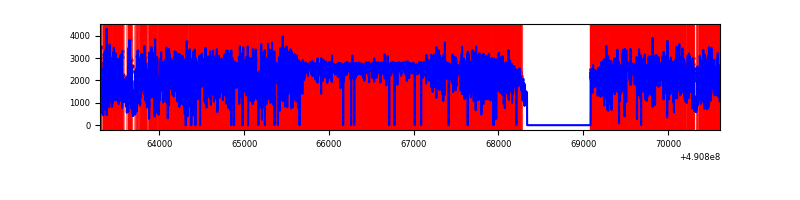 |
| B | 7314 | 6558 | 114 | 114 | 1.56% | 1.74% | 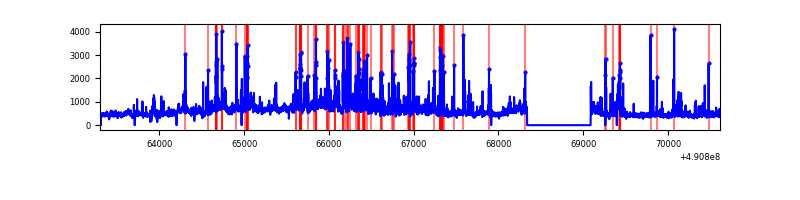 |
| C | 7315 | 6538 | 2801 | 2801 | 38.29% | 42.84% | 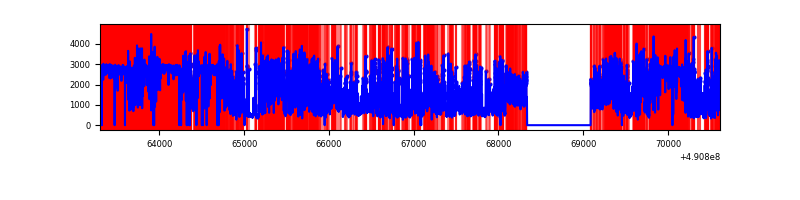 |
| D | 7315 | 6553 | 401 | 401 | 5.48% | 6.12% | 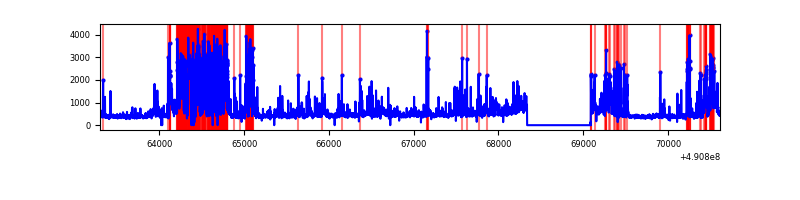 |
Top three noisy pixels from each quadrant. If the there are fewer than three noisy pixels in the level2.evt file, extra rows are filled as -1
| Pixel properties | Quadrant properties | ||||||
|---|---|---|---|---|---|---|---|
| Quadrant | DetID | PixID | Counts | Sigma | Mean | Median | Sigma |
| A | 9 | 191 | 11408748 | 106591.63 | 426 | 414 | 107.0 |
| A | 7 | 206 | 560135 | 5229.64 | 426 | 414 | 107.0 |
| A | 6 | 248 | 284921 | 2658.23 | 426 | 414 | 107.0 |
| B | 14 | 167 | 787186 | 5672.84 | 656 | 636 | 138.7 |
| B | 2 | 249 | 402482 | 2898.23 | 656 | 636 | 138.7 |
| B | 10 | 247 | 176593 | 1269.05 | 656 | 636 | 138.7 |
| C | 9 | 38 | 3590518 | 26428.01 | 492 | 486 | 135.8 |
| C | 1 | 241 | 2378216 | 17503.65 | 492 | 486 | 135.8 |
| C | 15 | 224 | 2108113 | 15515.29 | 492 | 486 | 135.8 |
| D | 12 | 17 | 1323119 | 7274.81 | 630 | 600 | 181.8 |
| D | 10 | 172 | 222579 | 1221.04 | 630 | 600 | 181.8 |
| D | 8 | 176 | 196092 | 1075.35 | 630 | 600 | 181.8 |
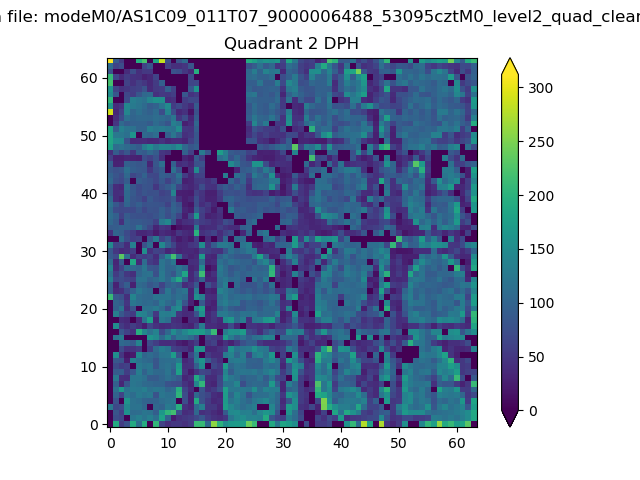
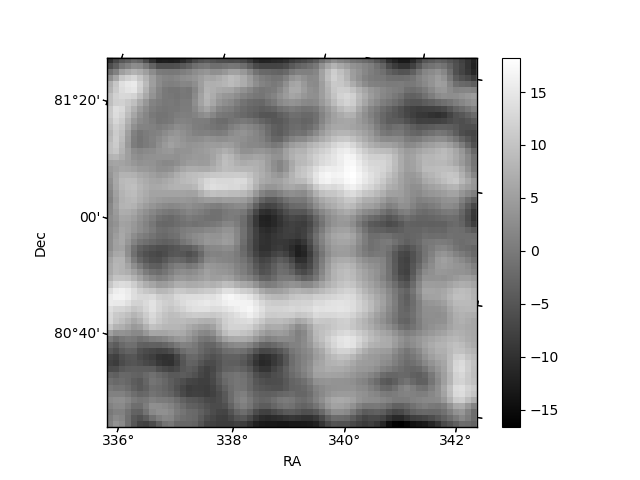
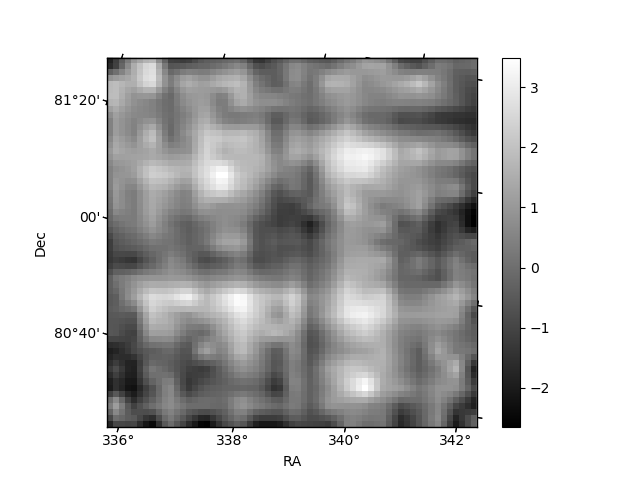
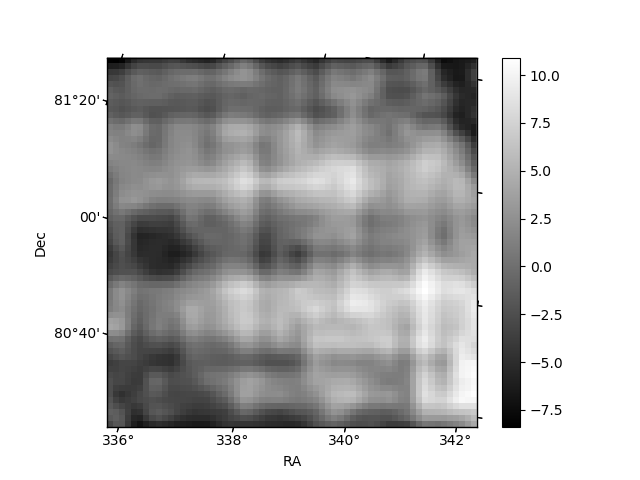
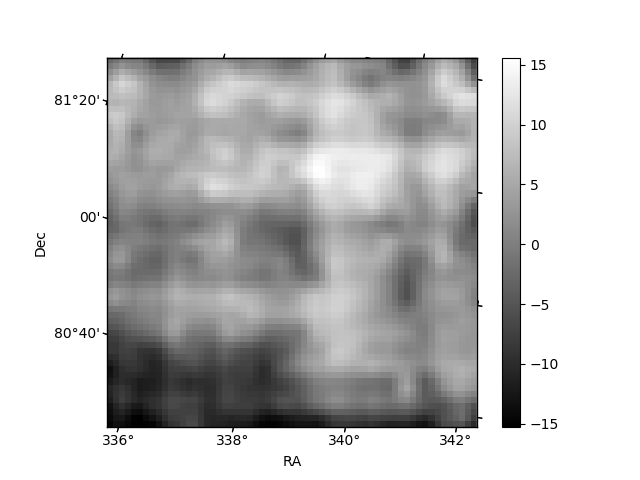
Histogram calculated using DETX and DETY for each event in the final _common_clean file
| Quadrant A | 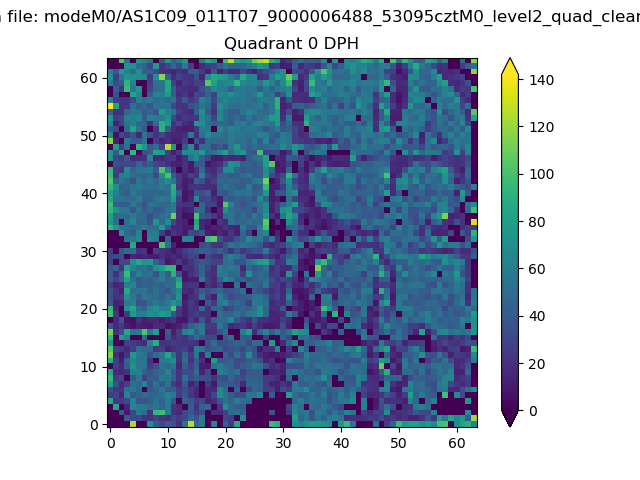 |
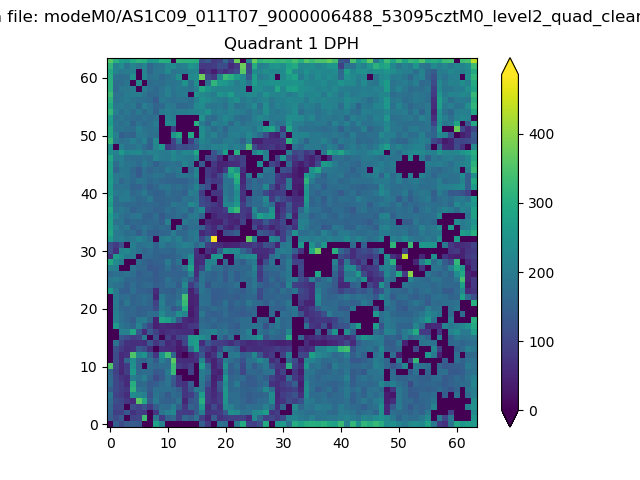 |
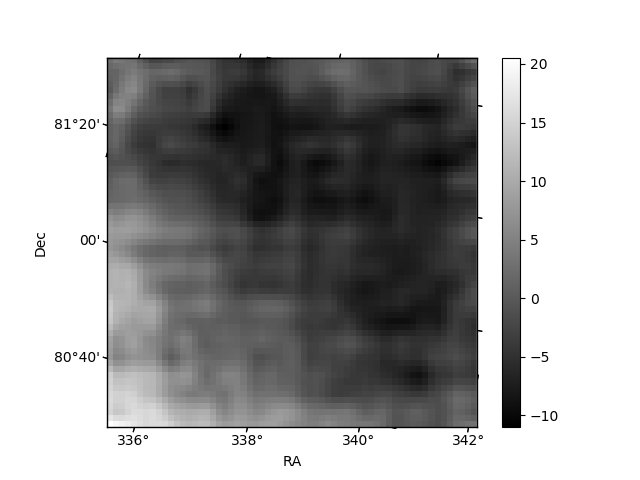
Quadrant B |
|---|---|---|---|
| Quadrant D | 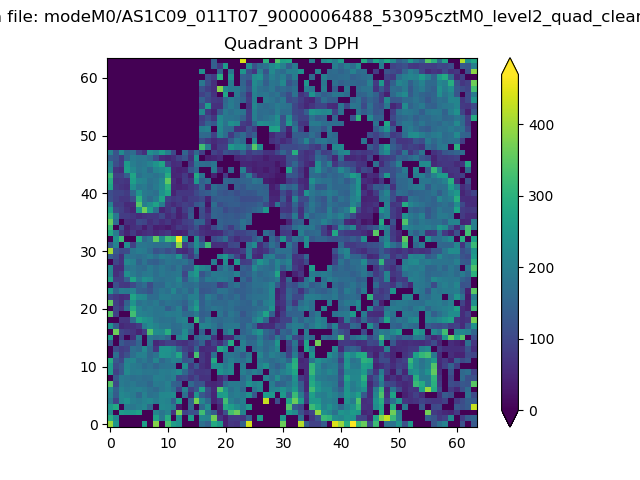 |
 |
Quadrant C |
| Plot type | Count rate plots | Images |
|---|---|---|
| Comparison with Poisson distribution Blue bars denote a histogram of data divided into 1 sec bins. Red curve is a Poisson curve with rate = median count rate of data. |
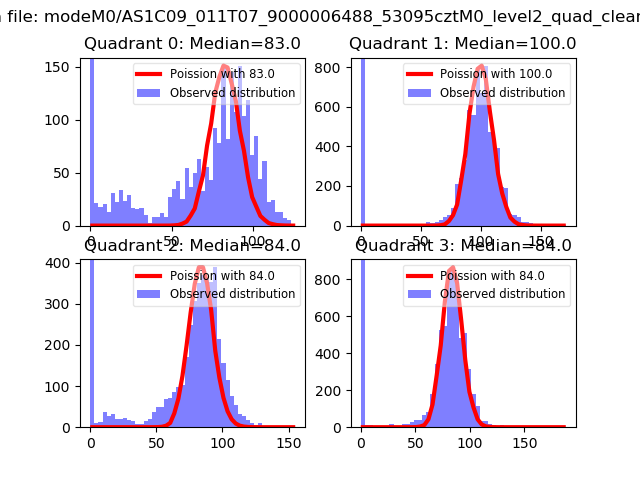 |
 |
| Quadrant-wise count rates Data is divided into 100 sec bins |
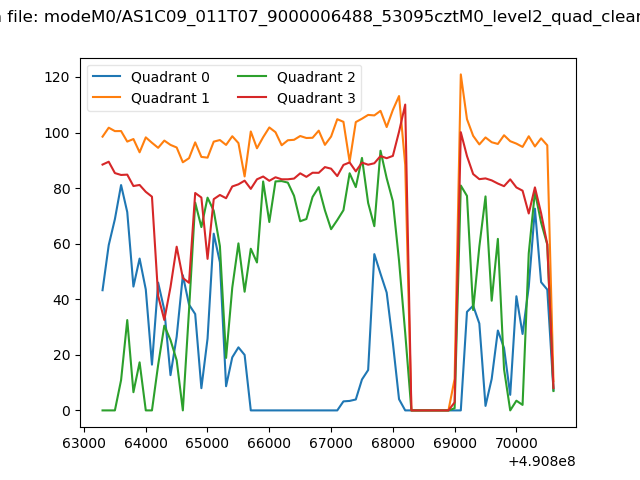 |
|
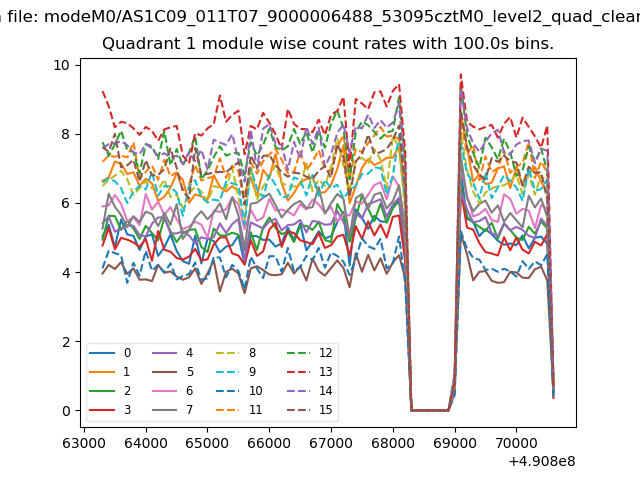
| Module-wise count rates for Quadrant A Data is divided into 100 sec bins |
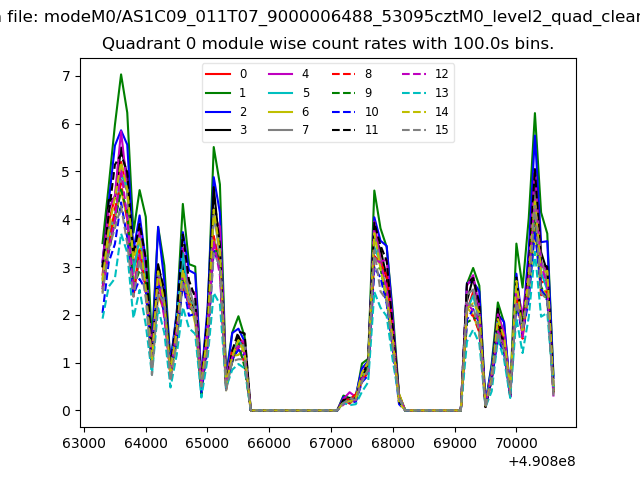 |
 |
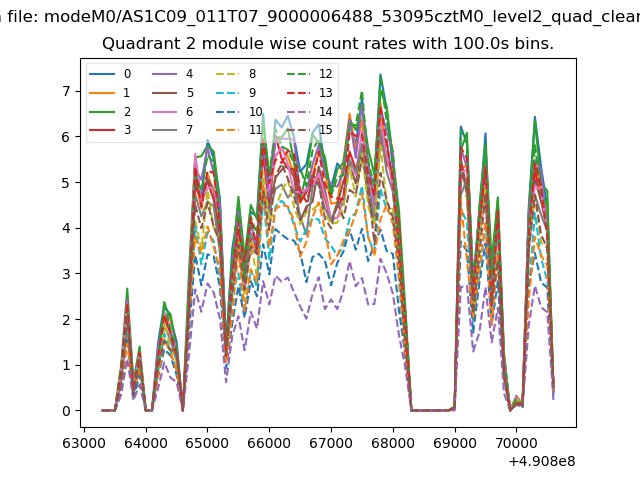
| Module-wise count rates for Quadrant B Data is divided into 100 sec bins |
 |
 |
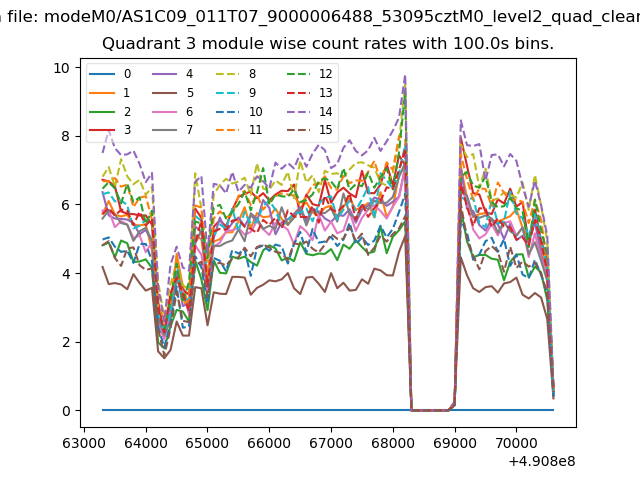
| Module-wise count rates for Quadrant C Data is divided into 100 sec bins |
 |
 |
| Module-wise count rates for Quadrant D Data is divided into 100 sec bins |
 |
 |
| Parameter | Plot |
|---|---|
| CZT HV Monitor | 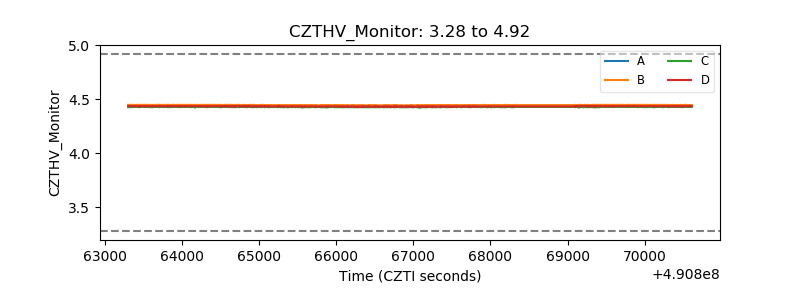 |
| D_VDD | 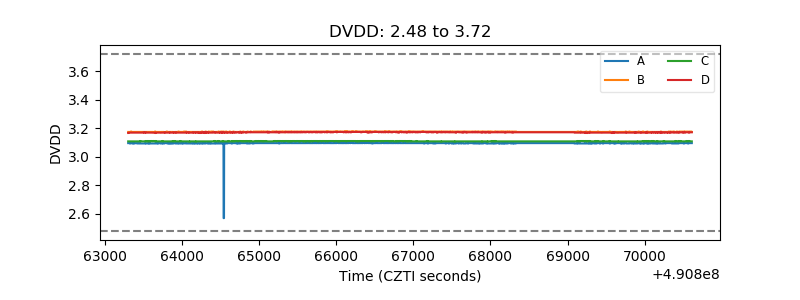 |
| Temperature 1 |  |
| Veto HV Monitor | 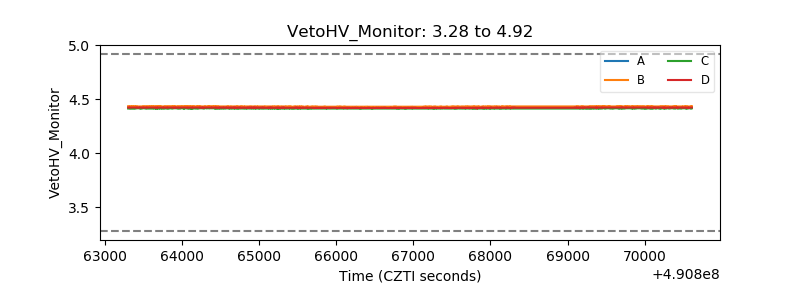 |
| Veto LLD | 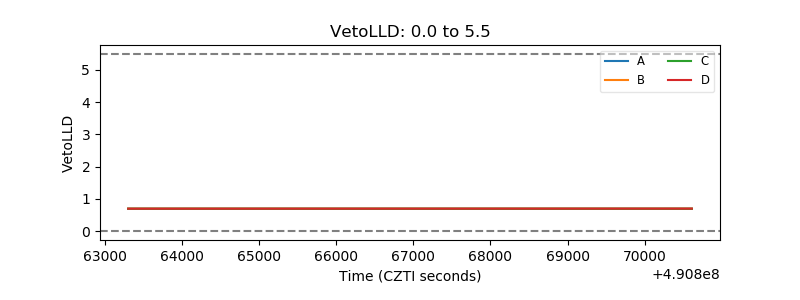 |
| Alpha Counter | 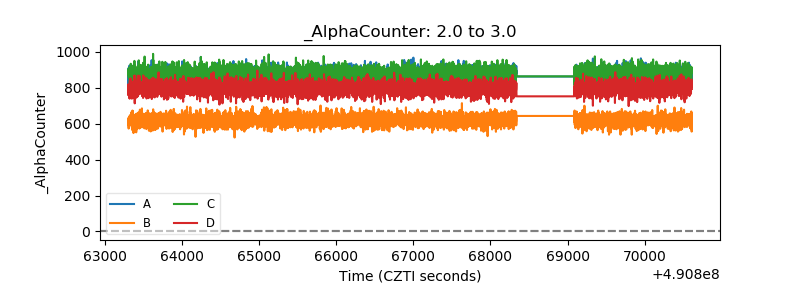 |
| _CPM_Rate | 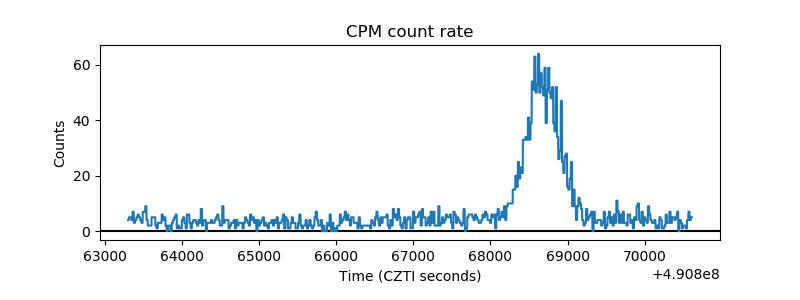 |
| CZT Counter | 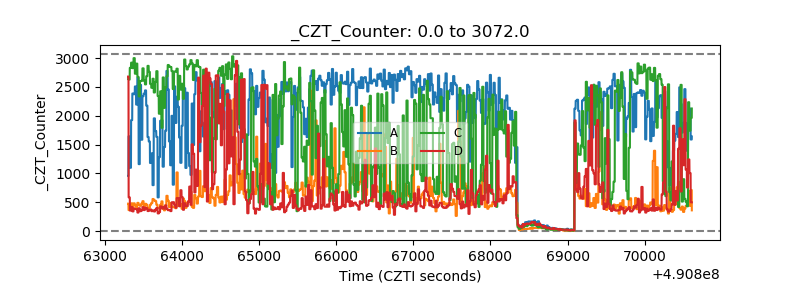 |
| +2.5 Volts monitor | 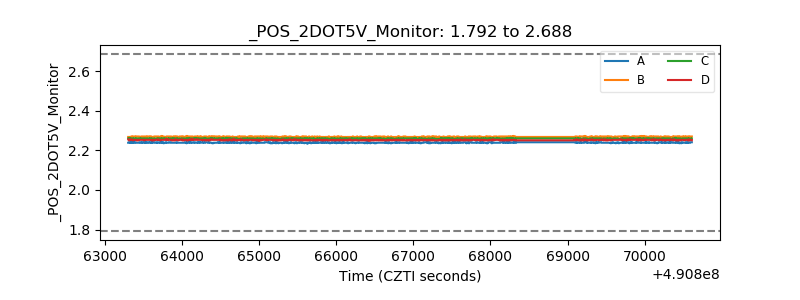 |
| +5 Volts monitor |  |
| _ROLL_ROT | 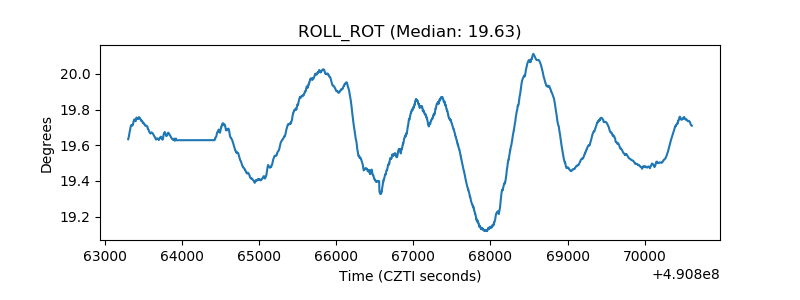 |
| _Roll_DEC | 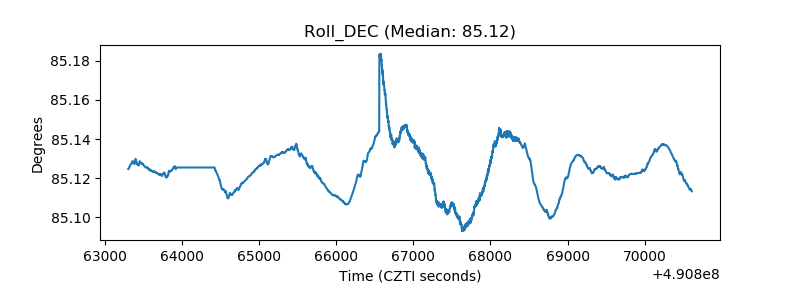 |
| _Roll_RA | 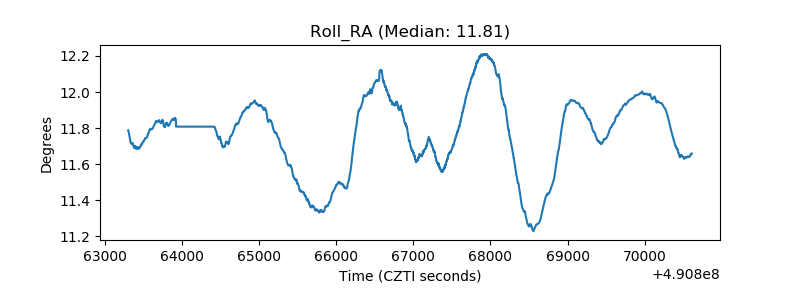 |
| Veto Counter | 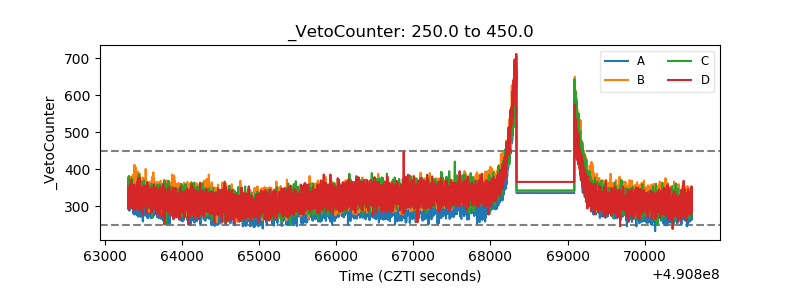 |