| Param | Original file | Final file |
|---|---|---|
| Filename | modeM0/AS1C09_011T07_9000006488_53096cztM0_level2.fits | modeM0/AS1C09_011T07_9000006488_53096cztM0_level2_quad_clean.evt |
| Size (bytes) | 2,706,148,800 | 192,061,440 |
| Size | 2.5 GB | 183.2 MB |
| Events in quadrant A | 40,777,002 | 475,877 |
| Events in quadrant B | 11,313,560 | 1,813,988 |
| Events in quadrant C | 34,514,148 | 795,640 |
| Events in quadrant D | 12,153,776 | 1,461,908 |
| Mode SS | |||
|---|---|---|---|
| Quadrant | BADHDUFLAG | Total packets | Discarded packets |
| A | 0 | 374 | 0 |
| B | 0 | 374 | 0 |
| C | 0 | 374 | 0 |
| D | 0 | 374 | 0 |
| Mode M9 | |||
|---|---|---|---|
| Quadrant | BADHDUFLAG | Total packets | Discarded packets |
| A | 0 | 30 | 0 |
| B | 0 | 30 | 0 |
| C | 0 | 30 | 0 |
| D | 0 | 30 | 0 |
| Mode M0 | |||
|---|---|---|---|
| Quadrant | BADHDUFLAG | Total packets | Discarded packets |
| A | 0 | 133702 | 4 |
| B | 0 | 46903 | 4 |
| C | 0 | 115053 | 4 |
| D | 0 | 49633 | 4 |
| Quadrant | Total seconds | Saturated seconds | Saturation percentage |
|---|---|---|---|
| A | 18375 | 14066 | 76.549660% |
| B | 18375 | 594 | 3.232653% |
| C | 18376 | 10124 | 55.093600% |
| D | 18376 | 1031 | 5.610579% |
Noise dominated data is calculated using 1-second bins in cleaned event files. If a bin has >2000 counts, and if more than 50% of those come from <1% of pixels, then it is considered to be noise-dominated and hence unusable.
| Quadrant | # 1 sec bins | Bins with >0 counts | Bins with >2000 counts | High rate bins dominated by noise | Noise dominated (total time) | Noise dominated (detector-on time) | Marked lightcurve |
|---|---|---|---|---|---|---|---|
| A | 21405 | 18376 | 12803 | 12803 | 59.81% | 69.67% | 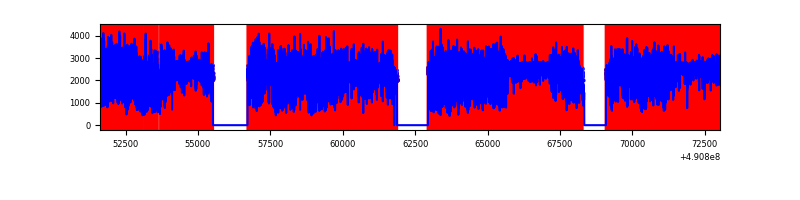 |
| B | 21405 | 18379 | 317 | 317 | 1.48% | 1.72% | 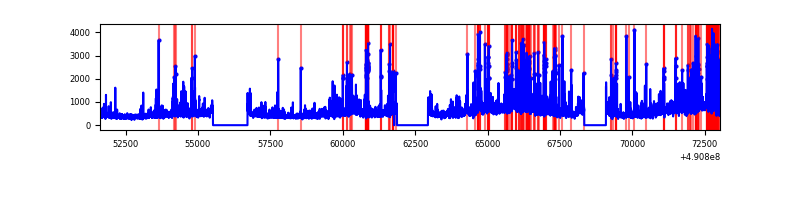 |
| C | 21406 | 18378 | 9330 | 9330 | 43.59% | 50.77% | 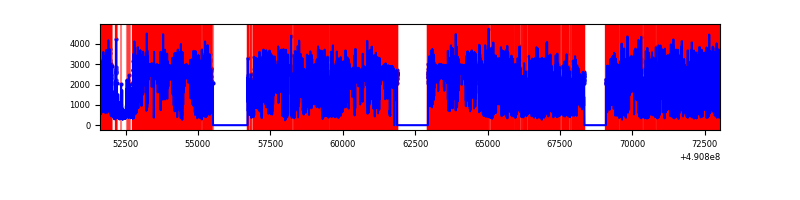 |
| D | 21406 | 18380 | 864 | 864 | 4.04% | 4.70% | 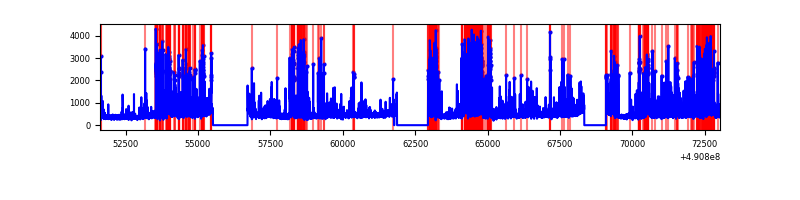 |
Top three noisy pixels from each quadrant. If the there are fewer than three noisy pixels in the level2.evt file, extra rows are filled as -1
| Pixel properties | Quadrant properties | ||||||
|---|---|---|---|---|---|---|---|
| Quadrant | DetID | PixID | Counts | Sigma | Mean | Median | Sigma |
| A | 9 | 191 | 30067613 | 103576.29 | 1174 | 1148 | 290.3 |
| A | 6 | 248 | 1928378 | 6639.14 | 1174 | 1148 | 290.3 |
| A | 7 | 206 | 1846322 | 6356.46 | 1174 | 1148 | 290.3 |
| B | 14 | 167 | 1533137 | 3950.2 | 1846 | 1787 | 387.7 |
| B | 2 | 249 | 1135078 | 2923.38 | 1846 | 1787 | 387.7 |
| B | 10 | 247 | 307398 | 788.34 | 1846 | 1787 | 387.7 |
| C | 1 | 241 | 10218121 | 28775.97 | 1285 | 1272 | 355.0 |
| C | 15 | 224 | 6959697 | 19598.55 | 1285 | 1272 | 355.0 |
| C | 9 | 38 | 6254981 | 17613.7 | 1285 | 1272 | 355.0 |
| D | 12 | 17 | 2017628 | 3913.28 | 1791 | 1710 | 515.1 |
| D | 12 | 3 | 737220 | 1427.76 | 1791 | 1710 | 515.1 |
| D | 2 | 62 | 457091 | 883.98 | 1791 | 1710 | 515.1 |
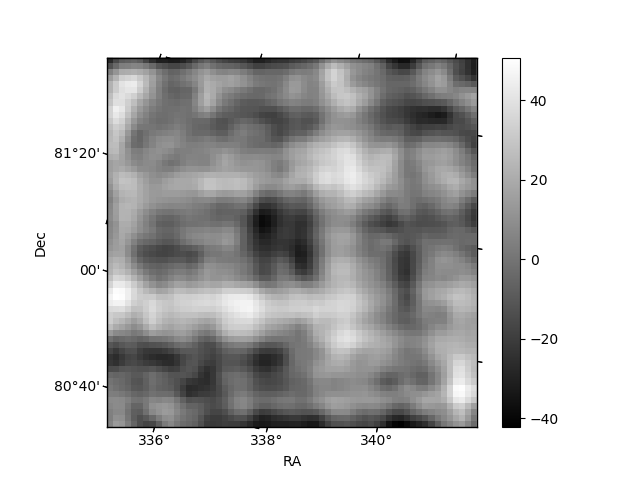
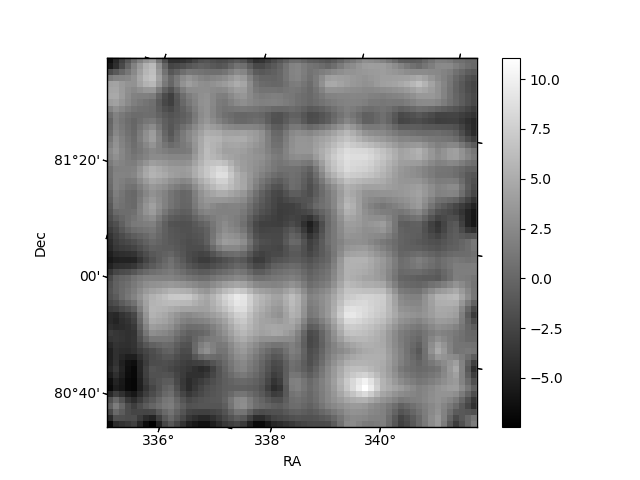
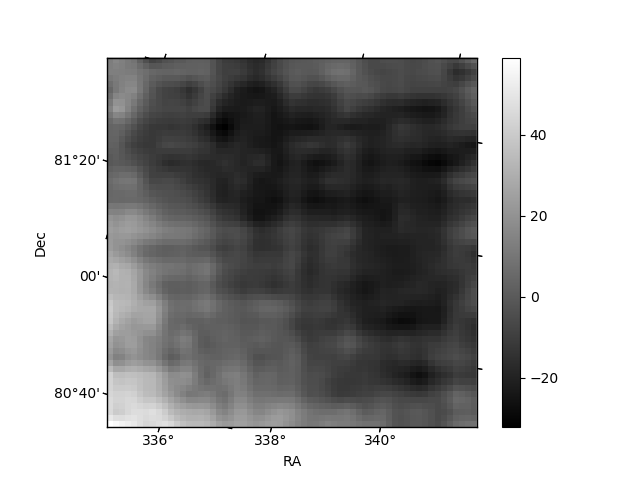
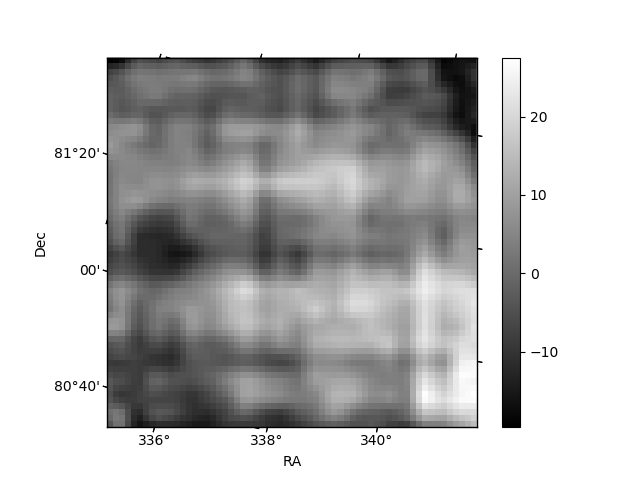
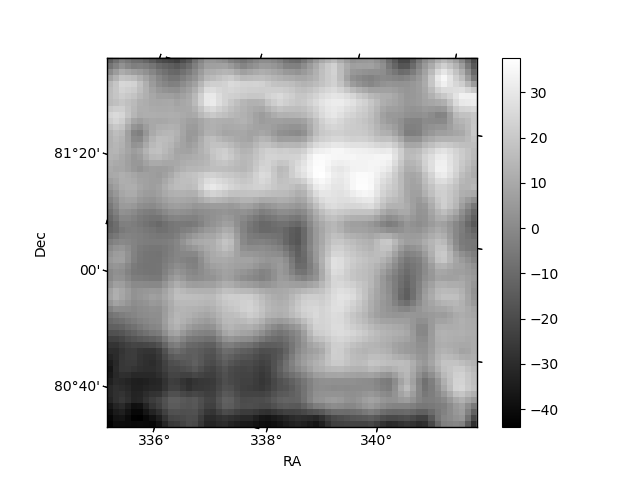
Histogram calculated using DETX and DETY for each event in the final _common_clean file
| Quadrant A | 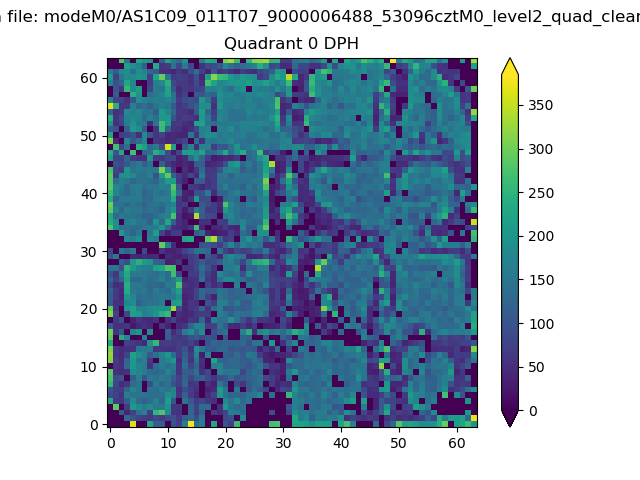 |
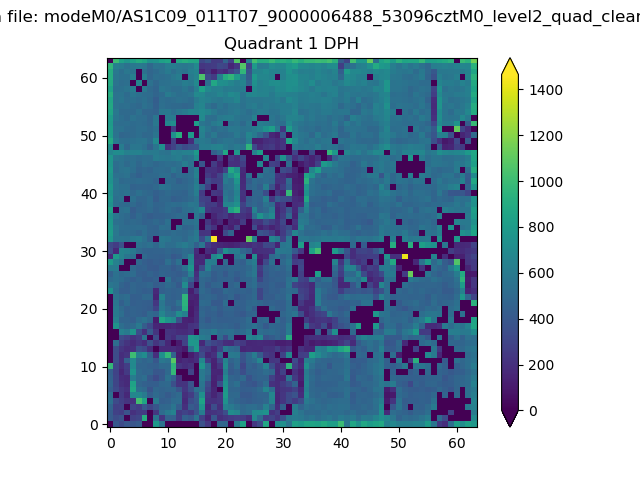 |
Quadrant B |
|---|---|---|---|
| Quadrant D | 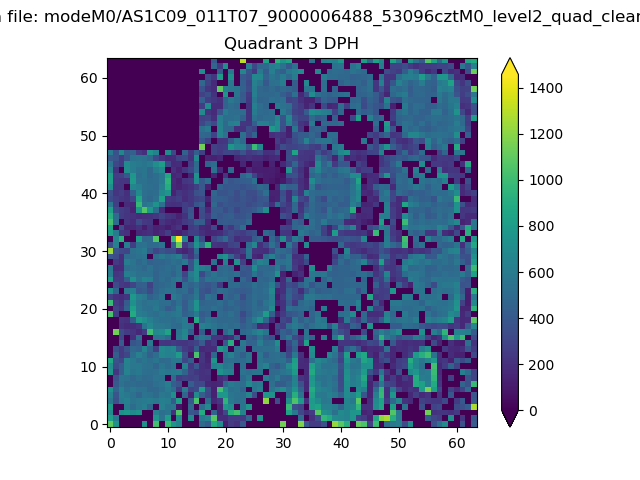 |
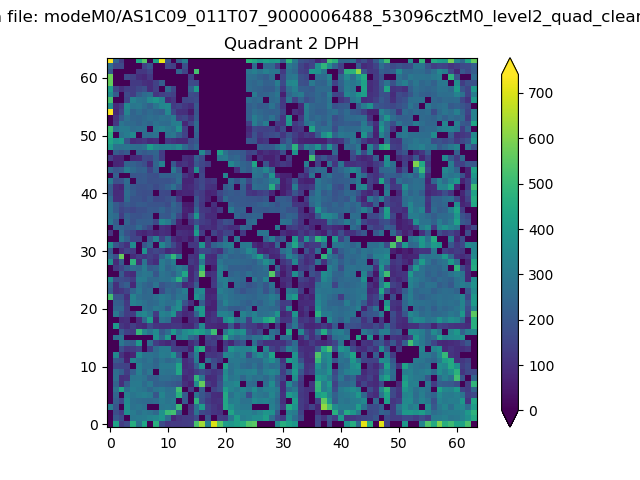 |
Quadrant C |
| Plot type | Count rate plots | Images |
|---|---|---|
| Comparison with Poisson distribution Blue bars denote a histogram of data divided into 1 sec bins. Red curve is a Poisson curve with rate = median count rate of data. |
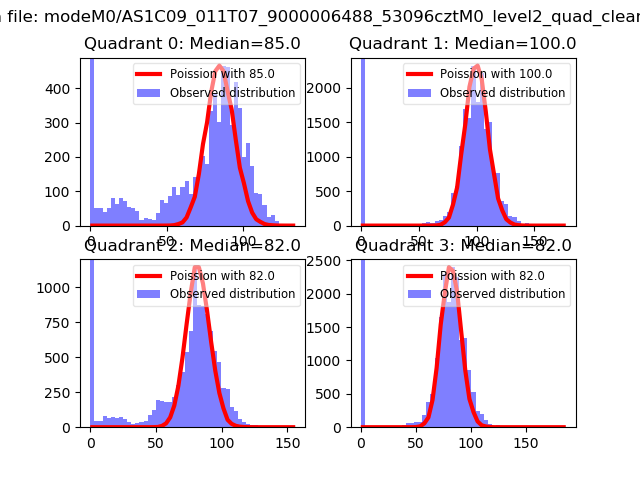 |
 |
| Quadrant-wise count rates Data is divided into 100 sec bins |
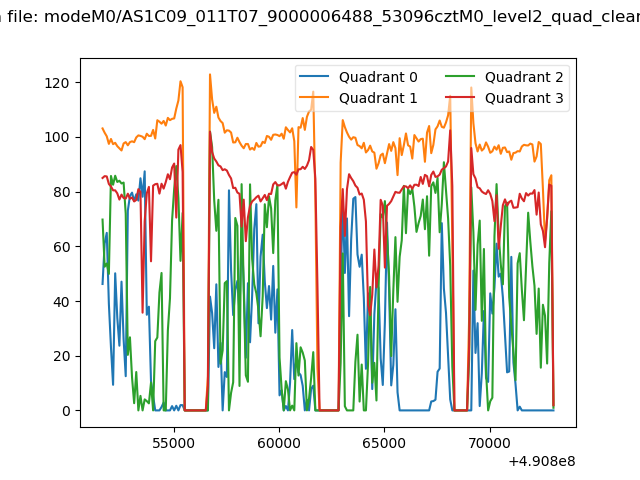 |
|
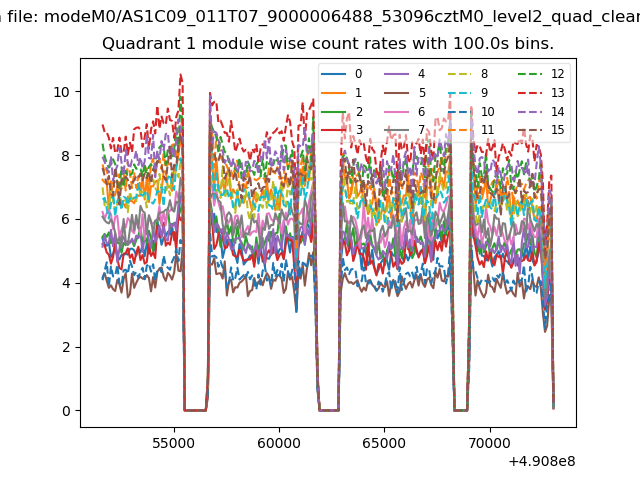
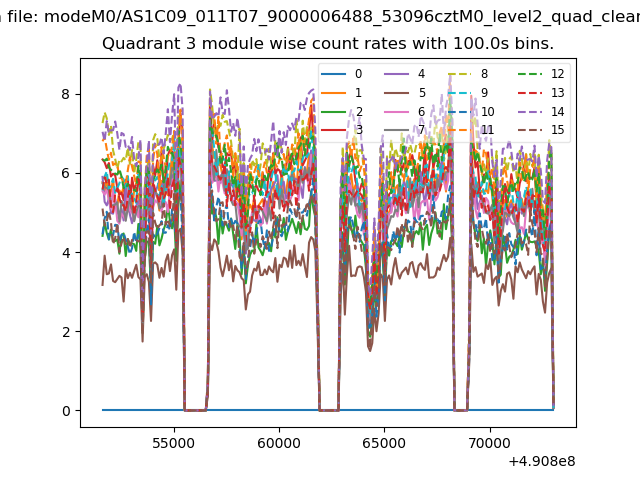
| Module-wise count rates for Quadrant A Data is divided into 100 sec bins |
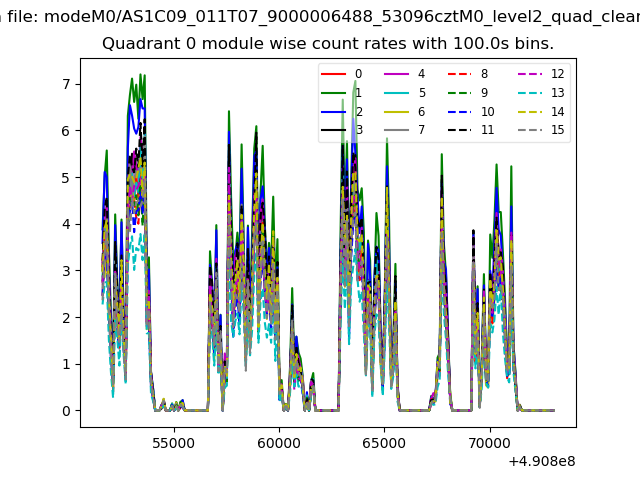 |
 |
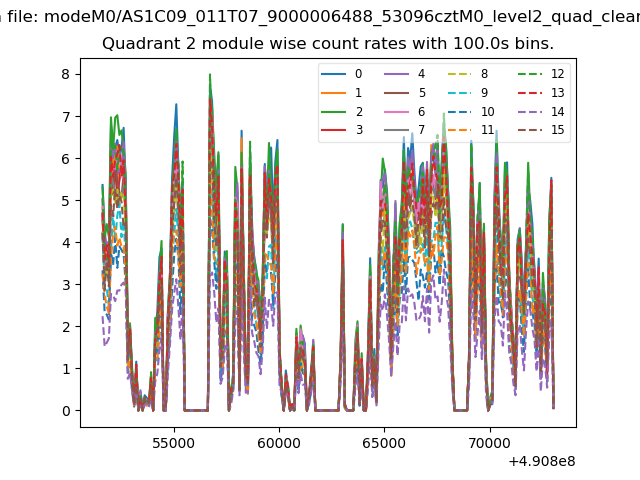
| Module-wise count rates for Quadrant B Data is divided into 100 sec bins |
 |
 |
| Module-wise count rates for Quadrant C Data is divided into 100 sec bins |
 |
 |
| Module-wise count rates for Quadrant D Data is divided into 100 sec bins |
 |
 |
| Parameter | Plot |
|---|---|
| CZT HV Monitor | 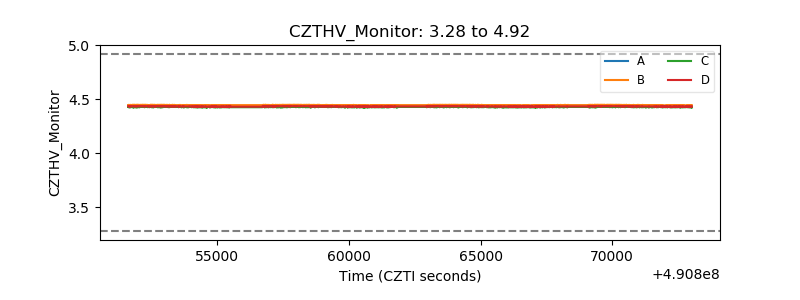 |
| D_VDD | 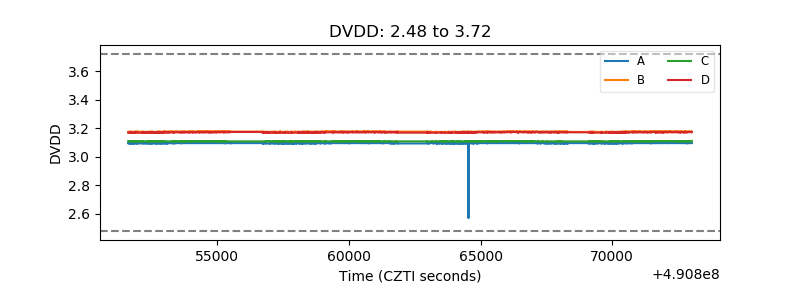 |
| Temperature 1 | 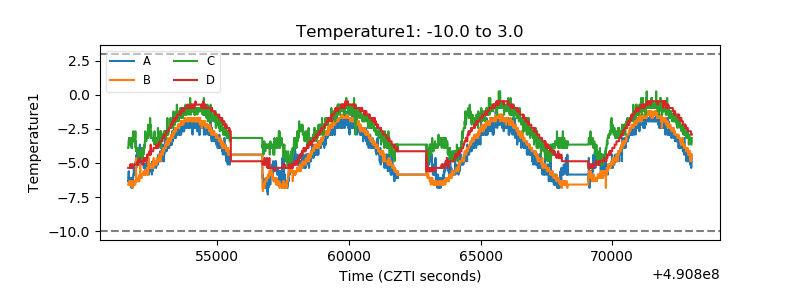 |
| Veto HV Monitor | 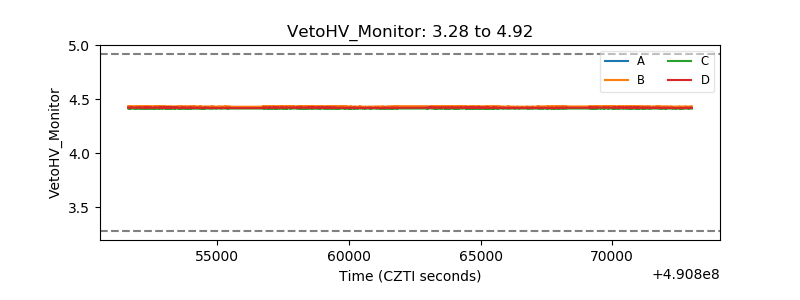 |
| Veto LLD | 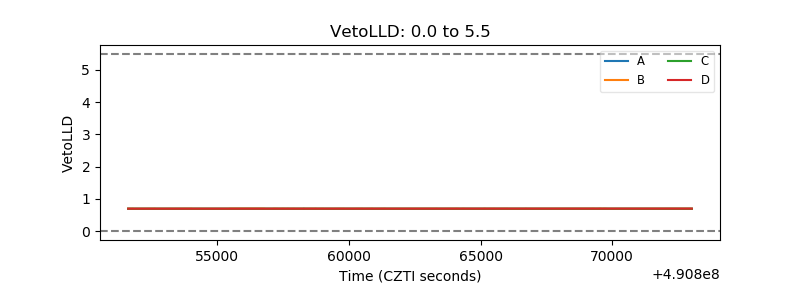 |
| Alpha Counter | 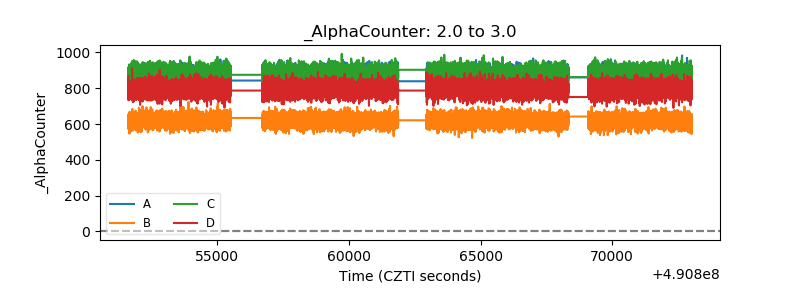 |
| _CPM_Rate | 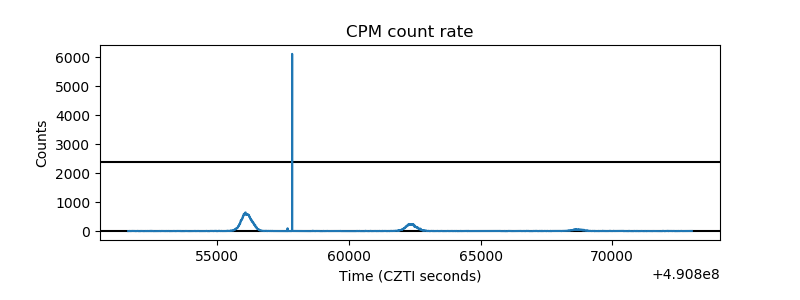 |
| CZT Counter | 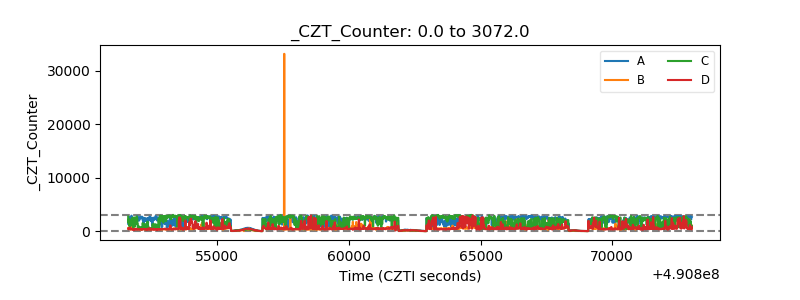 |
| +2.5 Volts monitor |  |
| +5 Volts monitor |  |
| _ROLL_ROT | 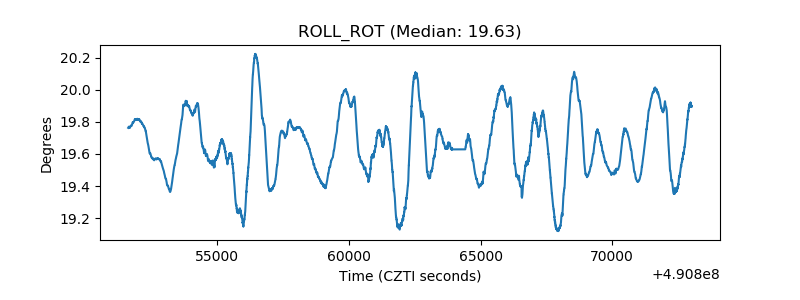 |
| _Roll_DEC | 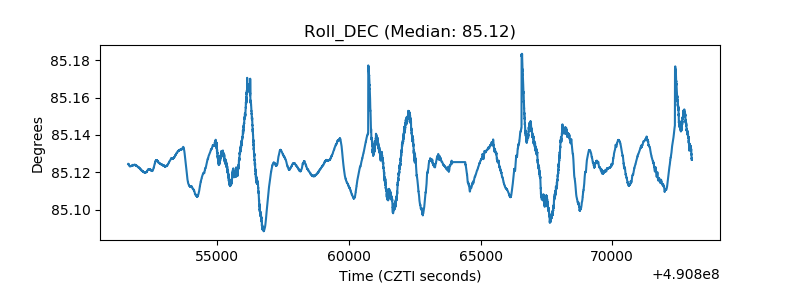 |
| _Roll_RA | 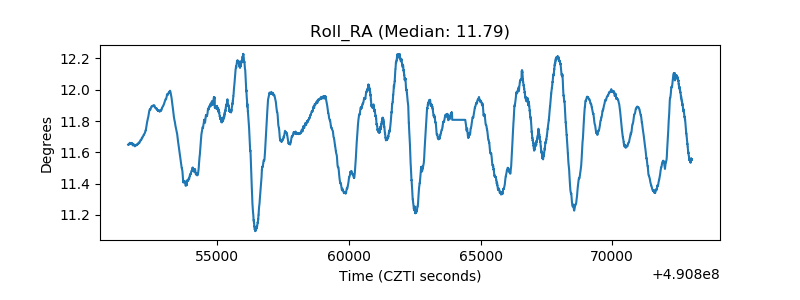 |
| Veto Counter | 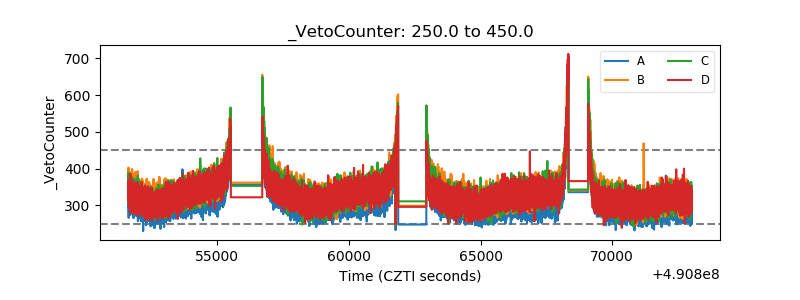 |