| Param | Original file | Final file |
|---|---|---|
| Filename | modeM0/AS1C09_011T07_9000006488_53098cztM0_level2.fits | modeM0/AS1C09_011T07_9000006488_53098cztM0_level2_quad_clean.evt |
| Size (bytes) | 1,202,650,560 | 67,288,320 |
| Size | 1.1 GB | 64.2 MB |
| Events in quadrant A | 17,216,934 | 100,737 |
| Events in quadrant B | 4,025,069 | 725,708 |
| Events in quadrant C | 16,967,230 | 105,306 |
| Events in quadrant D | 5,737,563 | 590,347 |
| Mode SS | |||
|---|---|---|---|
| Quadrant | BADHDUFLAG | Total packets | Discarded packets |
| A | 0 | 148 | 0 |
| B | 0 | 148 | 0 |
| C | 0 | 148 | 0 |
| D | 0 | 148 | 0 |
| Mode M0 | |||
|---|---|---|---|
| Quadrant | BADHDUFLAG | Total packets | Discarded packets |
| A | 0 | 56098 | 0 |
| B | 0 | 17298 | 0 |
| C | 0 | 55376 | 0 |
| D | 0 | 22154 | 0 |
| Quadrant | Total seconds | Saturated seconds | Saturation percentage |
|---|---|---|---|
| A | 7394 | 6529 | 88.301325% |
| B | 7395 | 175 | 2.366464% |
| C | 7395 | 6320 | 85.463151% |
| D | 7395 | 500 | 6.761325% |
Noise dominated data is calculated using 1-second bins in cleaned event files. If a bin has >2000 counts, and if more than 50% of those come from <1% of pixels, then it is considered to be noise-dominated and hence unusable.
| Quadrant | # 1 sec bins | Bins with >0 counts | Bins with >2000 counts | High rate bins dominated by noise | Noise dominated (total time) | Noise dominated (detector-on time) | Marked lightcurve |
|---|---|---|---|---|---|---|---|
| A | 7393 | 7393 | 5949 | 5949 | 80.47% | 80.47% | 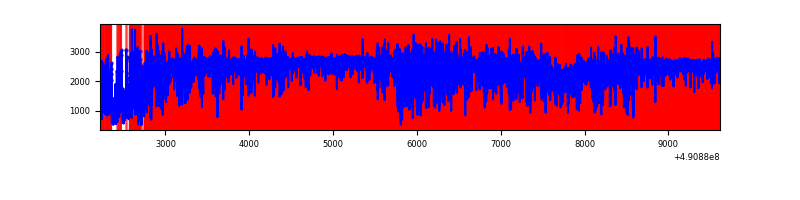 |
| B | 7395 | 7395 | 112 | 112 | 1.51% | 1.51% | 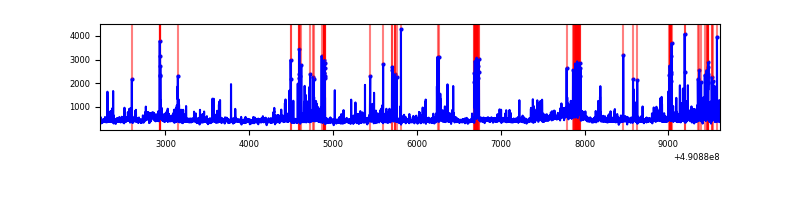 |
| C | 7394 | 7394 | 5681 | 5681 | 76.83% | 76.83% | 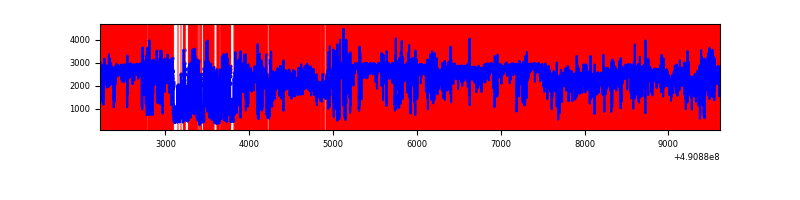 |
| D | 7395 | 7395 | 470 | 470 | 6.36% | 6.36% | 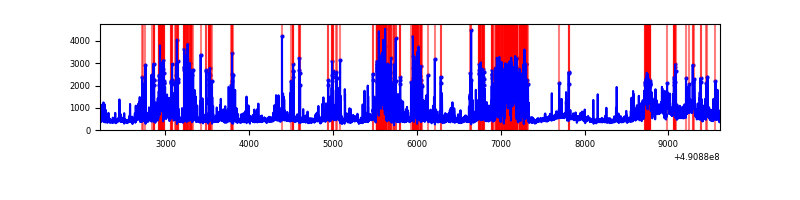 |
Top three noisy pixels from each quadrant. If the there are fewer than three noisy pixels in the level2.evt file, extra rows are filled as -1
| Pixel properties | Quadrant properties | ||||||
|---|---|---|---|---|---|---|---|
| Quadrant | DetID | PixID | Counts | Sigma | Mean | Median | Sigma |
| A | 9 | 191 | 14861197 | 137953.81 | 426 | 415 | 107.7 |
| A | 7 | 206 | 287193 | 2662.18 | 426 | 415 | 107.7 |
| A | 6 | 248 | 136604 | 1264.25 | 426 | 415 | 107.7 |
| B | 2 | 249 | 403476 | 2517.02 | 751 | 726 | 160.0 |
| B | 1 | 207 | 124950 | 776.35 | 751 | 726 | 160.0 |
| B | 0 | 213 | 116856 | 725.77 | 751 | 726 | 160.0 |
| C | 1 | 241 | 8146446 | 92274.96 | 320 | 317 | 88.3 |
| C | 15 | 157 | 5799642 | 65691.63 | 320 | 317 | 88.3 |
| C | 15 | 224 | 1125956 | 12750.63 | 320 | 317 | 88.3 |
| D | 10 | 172 | 1232966 | 5865.2 | 728 | 695 | 210.1 |
| D | 2 | 249 | 455124 | 2162.93 | 728 | 695 | 210.1 |
| D | 0 | 5 | 284029 | 1348.57 | 728 | 695 | 210.1 |
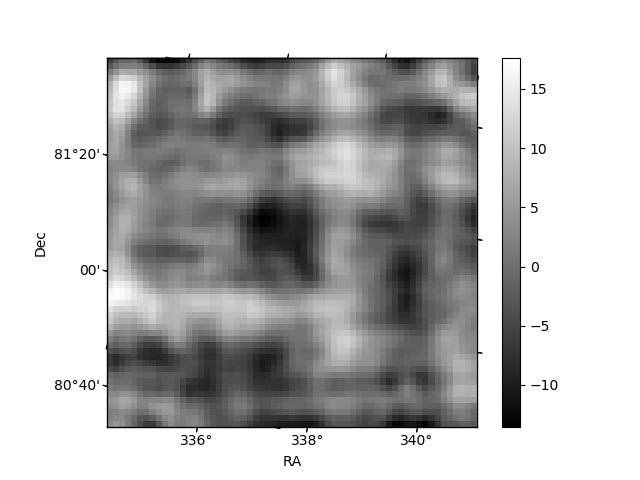
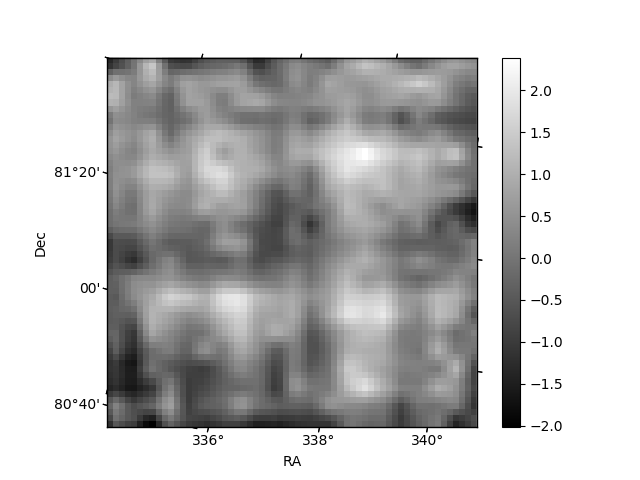
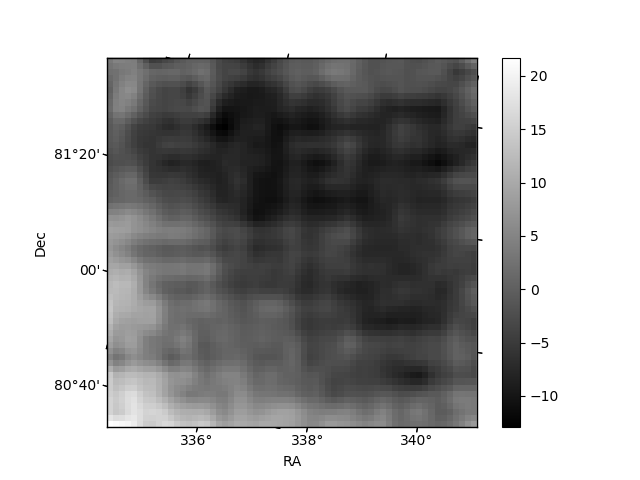
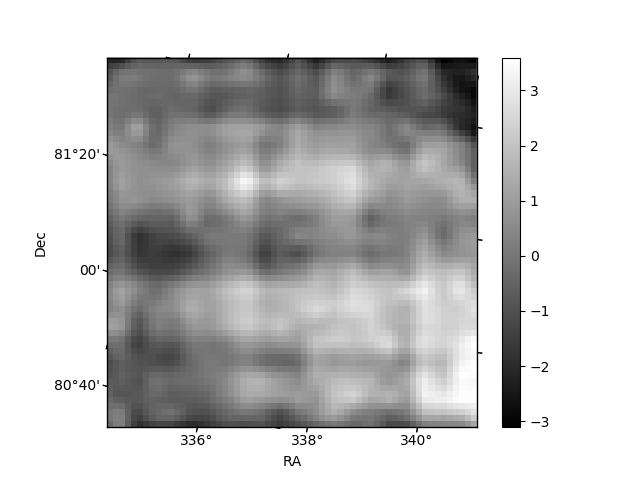
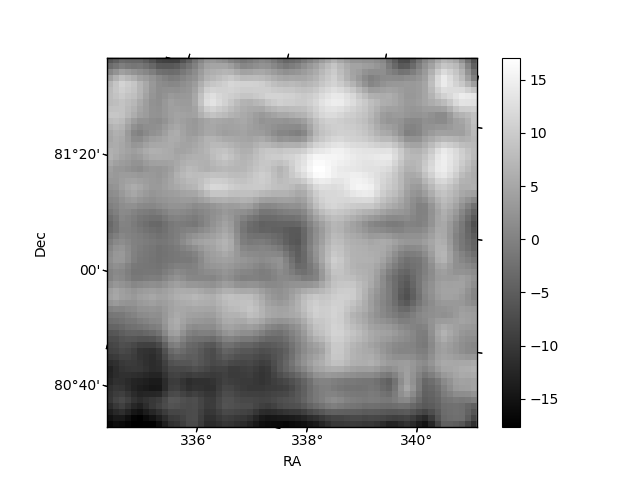
Histogram calculated using DETX and DETY for each event in the final _common_clean file
| Quadrant A | 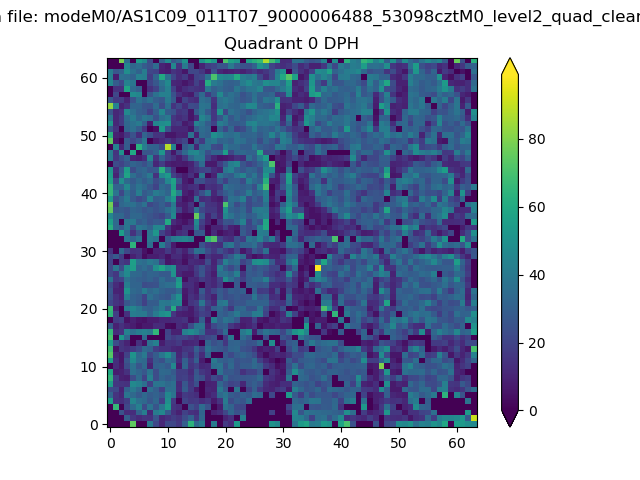 |
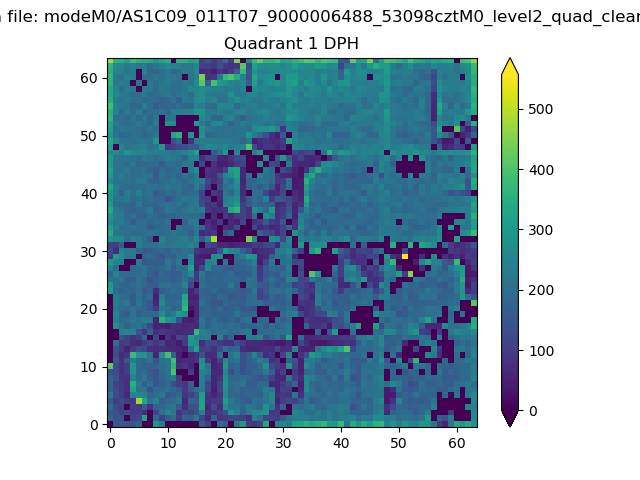 |
Quadrant B |
|---|---|---|---|
| Quadrant D |  |
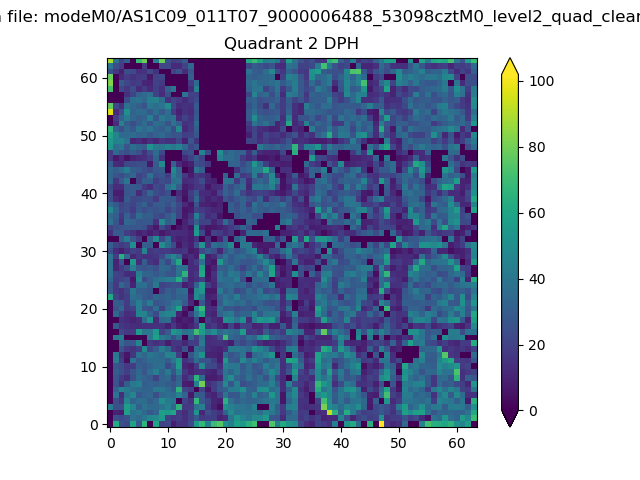 |
Quadrant C |
| Plot type | Count rate plots | Images |
|---|---|---|
| Comparison with Poisson distribution Blue bars denote a histogram of data divided into 1 sec bins. Red curve is a Poisson curve with rate = median count rate of data. |
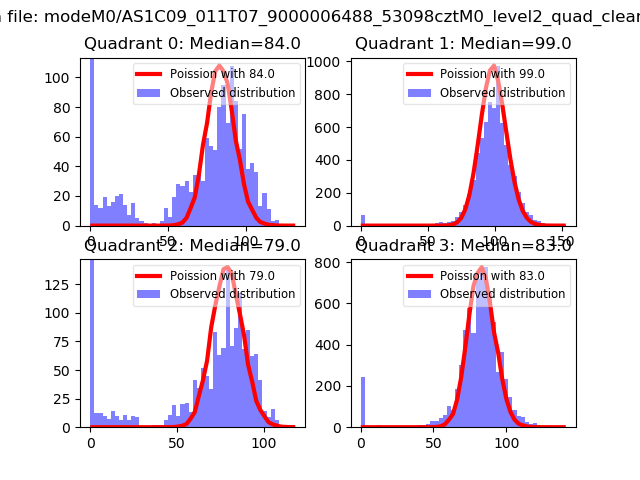 |
 |
| Quadrant-wise count rates Data is divided into 100 sec bins |
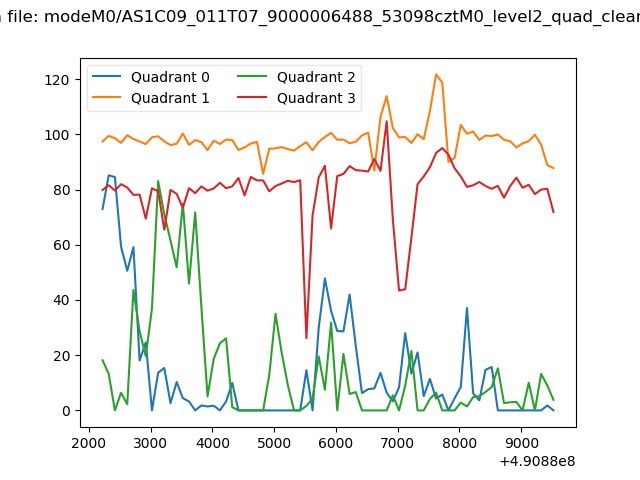 |
|
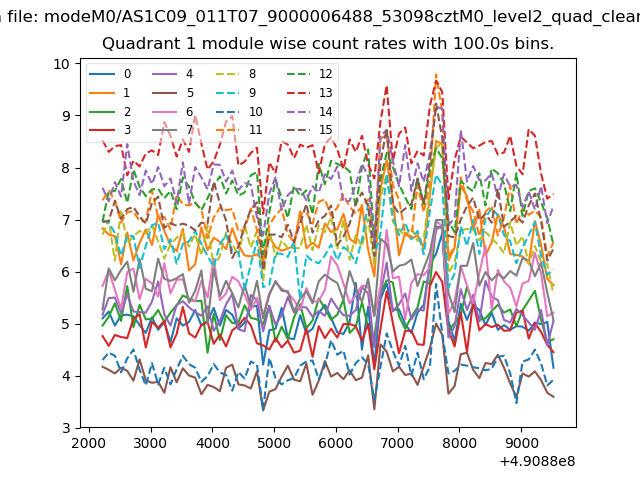
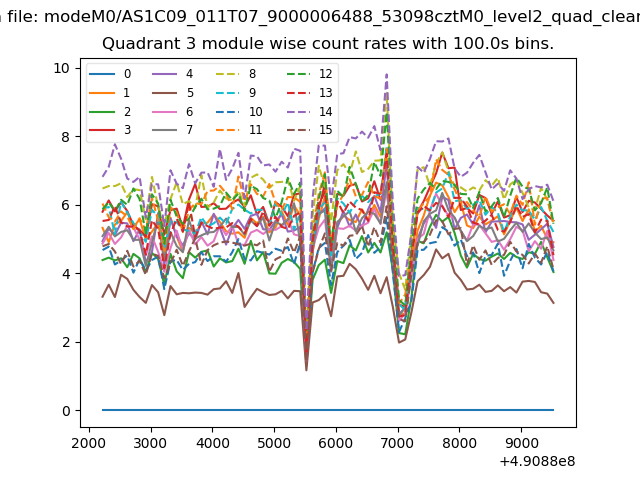
| Module-wise count rates for Quadrant A Data is divided into 100 sec bins |
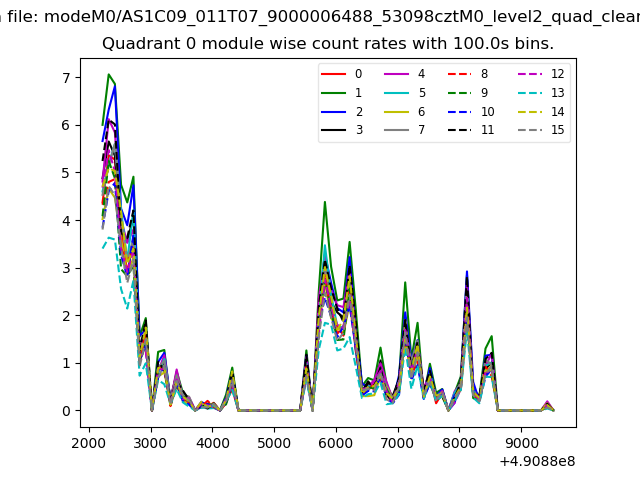 |
 |
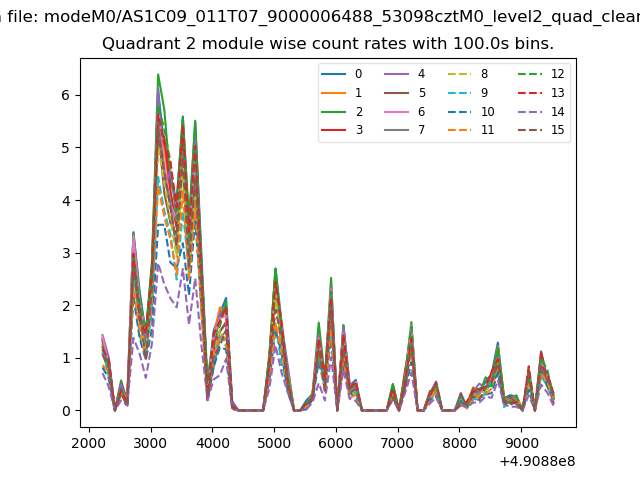
| Module-wise count rates for Quadrant B Data is divided into 100 sec bins |
 |
 |
| Module-wise count rates for Quadrant C Data is divided into 100 sec bins |
 |
 |
| Module-wise count rates for Quadrant D Data is divided into 100 sec bins |
 |
 |
| Parameter | Plot |
|---|---|
| CZT HV Monitor | 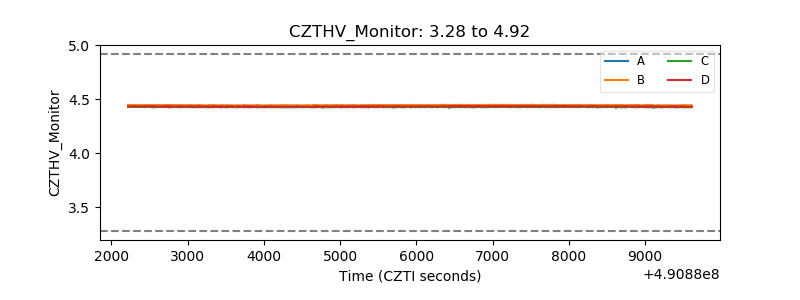 |
| D_VDD | 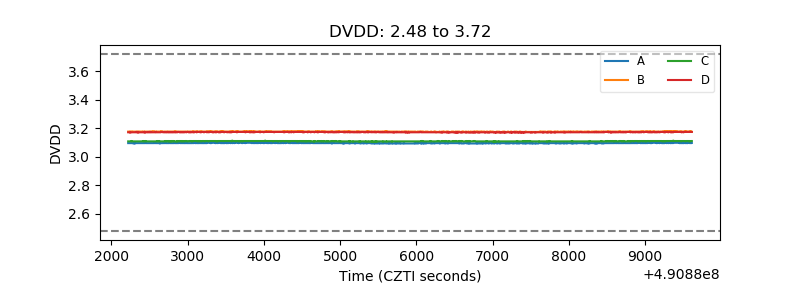 |
| Temperature 1 | 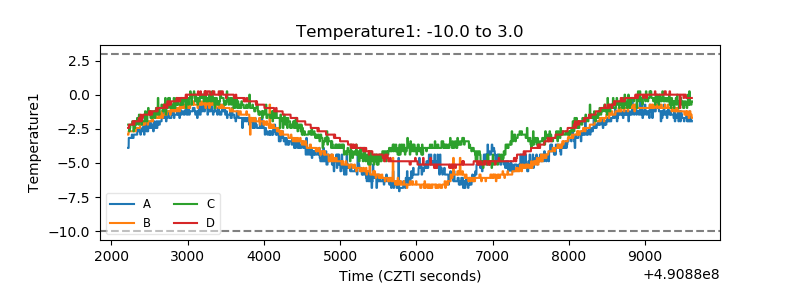 |
| Veto HV Monitor | 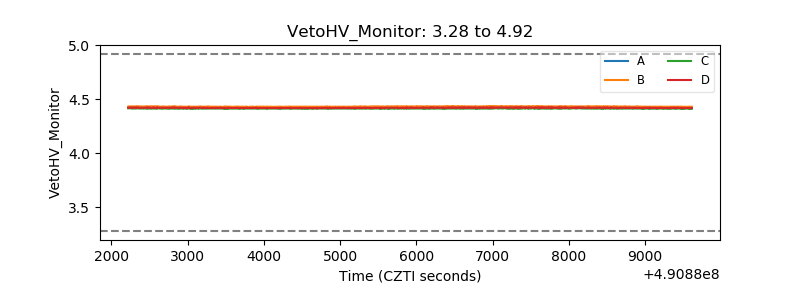 |
| Veto LLD | 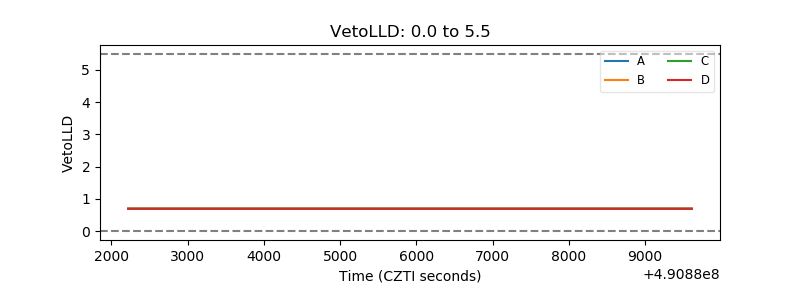 |
| Alpha Counter | 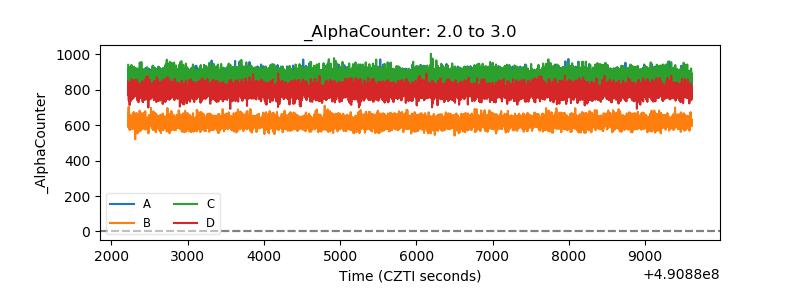 |
| _CPM_Rate | 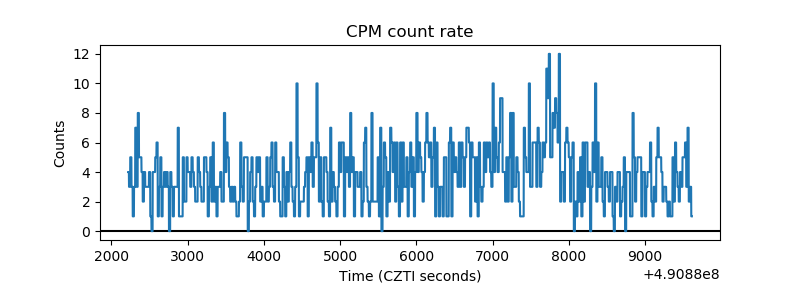 |
| CZT Counter | 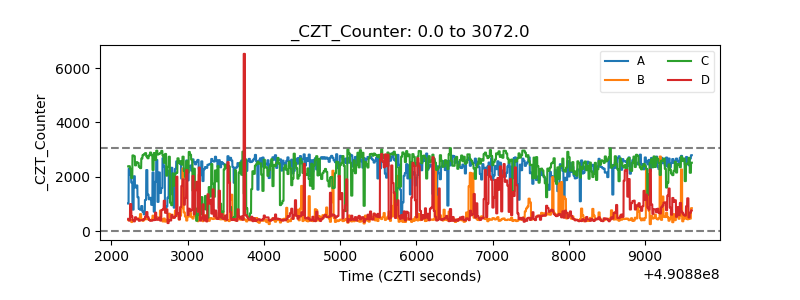 |
| +2.5 Volts monitor | 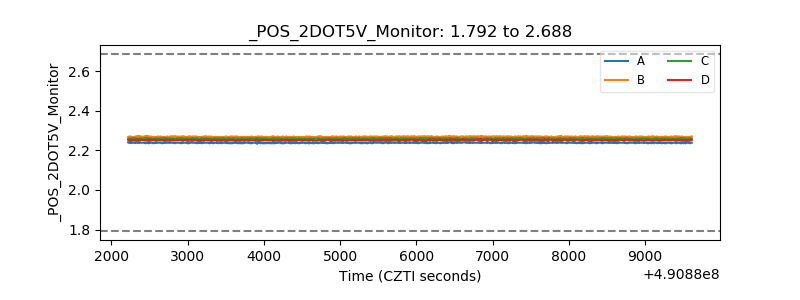 |
| +5 Volts monitor |  |
| _ROLL_ROT | 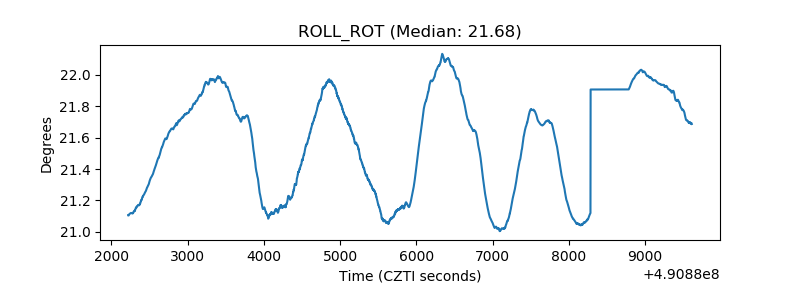 |
| _Roll_DEC | 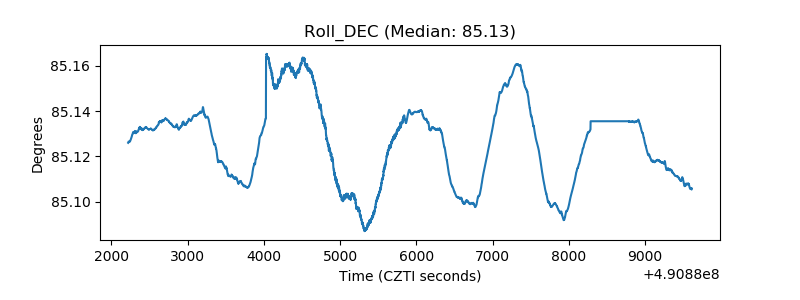 |
| _Roll_RA | 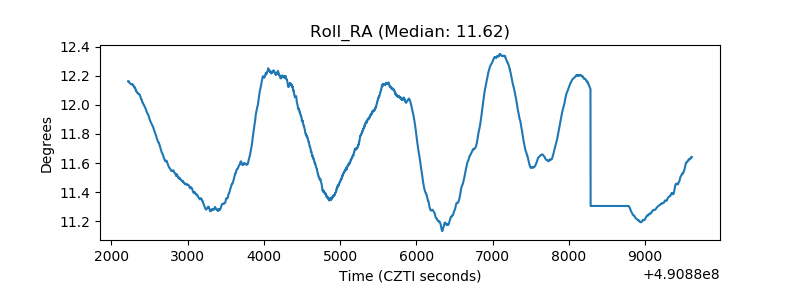 |
| Veto Counter | 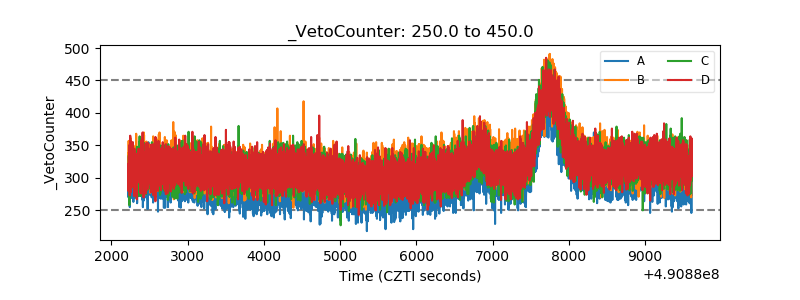 |