| Param | Original file | Final file |
|---|---|---|
| Filename | modeM0/AS1C09_011T07_9000006488_53101cztM0_level2.fits | modeM0/AS1C09_011T07_9000006488_53101cztM0_level2_quad_clean.evt |
| Size (bytes) | 2,554,119,360 | 192,700,800 |
| Size | 2.4 GB | 183.8 MB |
| Events in quadrant A | 40,799,579 | 393,529 |
| Events in quadrant B | 9,751,146 | 1,763,579 |
| Events in quadrant C | 28,603,345 | 1,008,375 |
| Events in quadrant D | 13,990,017 | 1,413,390 |
| Mode SS | |||
|---|---|---|---|
| Quadrant | BADHDUFLAG | Total packets | Discarded packets |
| A | 0 | 370 | 0 |
| B | 0 | 370 | 0 |
| C | 0 | 370 | 0 |
| D | 0 | 370 | 0 |
| Mode M9 | |||
|---|---|---|---|
| Quadrant | BADHDUFLAG | Total packets | Discarded packets |
| A | 0 | 12 | 0 |
| B | 0 | 12 | 0 |
| C | 0 | 12 | 0 |
| D | 0 | 12 | 0 |
| Mode M0 | |||
|---|---|---|---|
| Quadrant | BADHDUFLAG | Total packets | Discarded packets |
| A | 0 | 133461 | 4 |
| B | 0 | 41924 | 6 |
| C | 0 | 97582 | 4 |
| D | 0 | 54456 | 4 |
| Quadrant | Total seconds | Saturated seconds | Saturation percentage |
|---|---|---|---|
| A | 18186 | 14636 | 80.479490% |
| B | 18186 | 435 | 2.391950% |
| C | 18186 | 7385 | 40.608160% |
| D | 18186 | 1427 | 7.846695% |
Noise dominated data is calculated using 1-second bins in cleaned event files. If a bin has >2000 counts, and if more than 50% of those come from <1% of pixels, then it is considered to be noise-dominated and hence unusable.
| Quadrant | # 1 sec bins | Bins with >0 counts | Bins with >2000 counts | High rate bins dominated by noise | Noise dominated (total time) | Noise dominated (detector-on time) | Marked lightcurve |
|---|---|---|---|---|---|---|---|
| A | 19455 | 18186 | 13610 | 13610 | 69.96% | 74.84% | 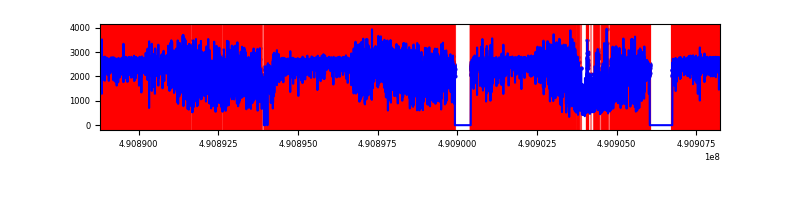 |
| B | 19456 | 18190 | 205 | 205 | 1.05% | 1.13% | 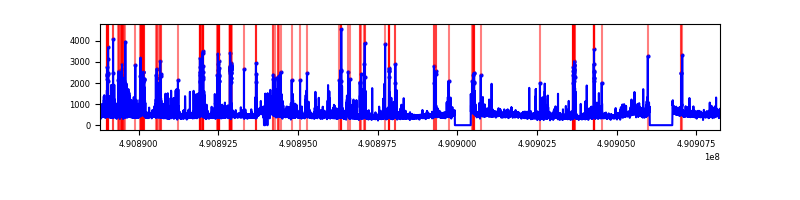 |
| C | 19456 | 18189 | 6509 | 6509 | 33.45% | 35.79% | 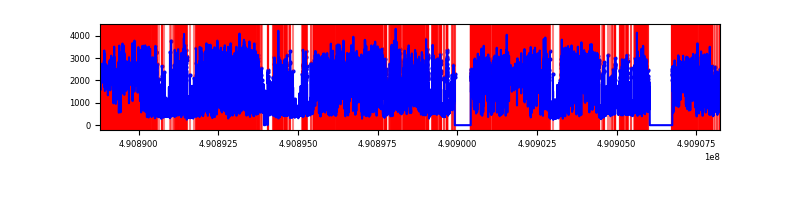 |
| D | 19456 | 18190 | 1274 | 1274 | 6.55% | 7.00% | 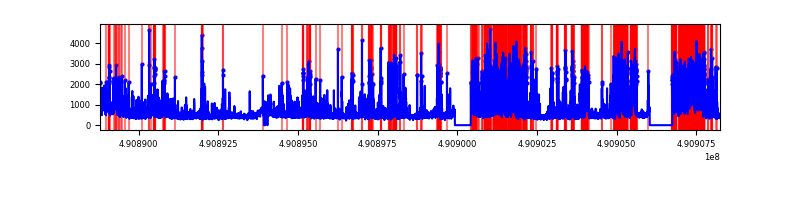 |
Top three noisy pixels from each quadrant. If the there are fewer than three noisy pixels in the level2.evt file, extra rows are filled as -1
| Pixel properties | Quadrant properties | ||||||
|---|---|---|---|---|---|---|---|
| Quadrant | DetID | PixID | Counts | Sigma | Mean | Median | Sigma |
| A | 9 | 191 | 34324539 | 127961.16 | 1064 | 1038 | 268.2 |
| A | 0 | 8 | 616745 | 2295.41 | 1064 | 1038 | 268.2 |
| A | 3 | 62 | 360204 | 1339.0 | 1064 | 1038 | 268.2 |
| B | 4 | 81 | 460242 | 1174.33 | 1859 | 1793 | 390.4 |
| B | 2 | 249 | 410982 | 1048.15 | 1859 | 1793 | 390.4 |
| B | 14 | 167 | 333081 | 848.6 | 1859 | 1793 | 390.4 |
| C | 15 | 157 | 7165617 | 17301.59 | 1507 | 1493 | 414.1 |
| C | 9 | 38 | 6205747 | 14983.48 | 1507 | 1493 | 414.1 |
| C | 15 | 224 | 5501334 | 13282.3 | 1507 | 1493 | 414.1 |
| D | 10 | 172 | 2148847 | 4139.73 | 1803 | 1723 | 518.7 |
| D | 0 | 5 | 1555893 | 2996.49 | 1803 | 1723 | 518.7 |
| D | 3 | 12 | 864295 | 1663.07 | 1803 | 1723 | 518.7 |
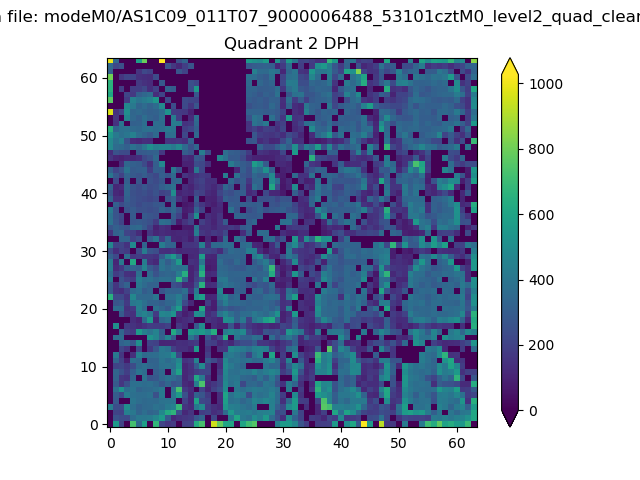
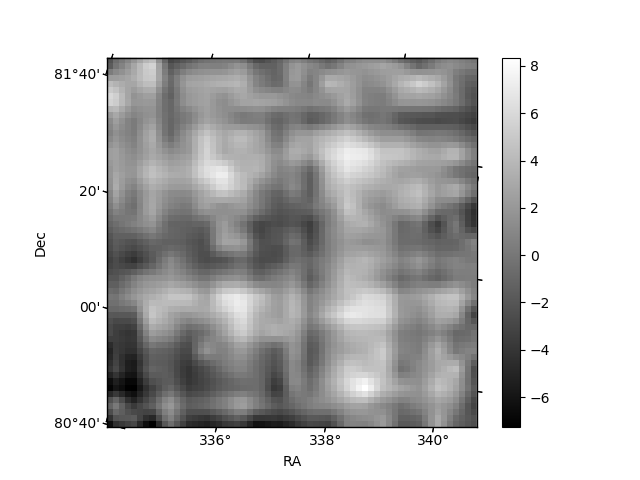
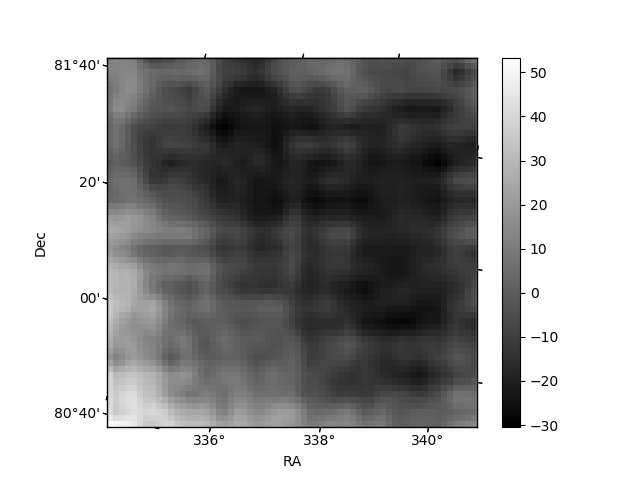
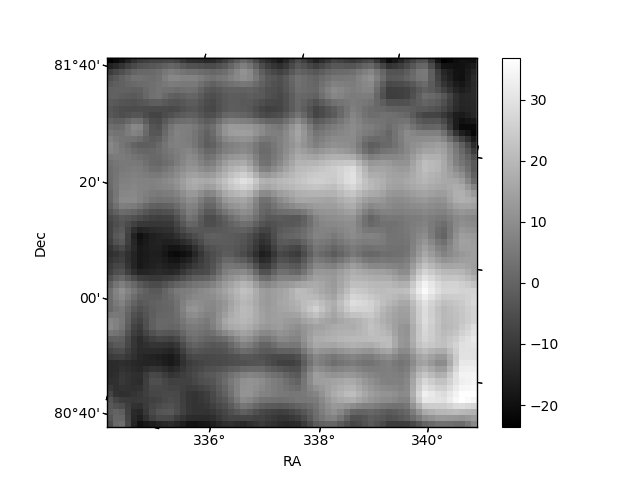
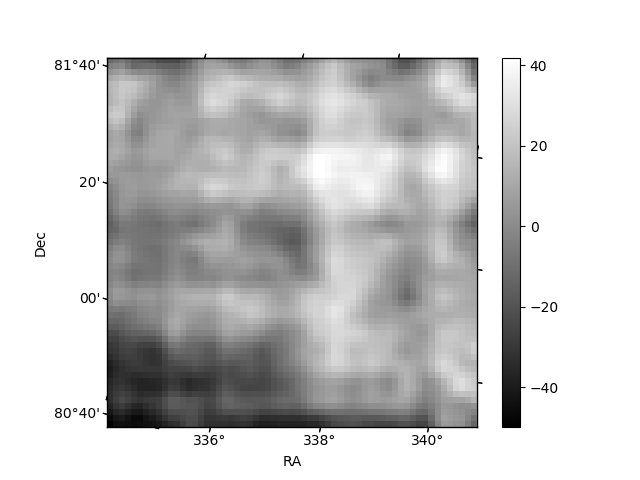
Histogram calculated using DETX and DETY for each event in the final _common_clean file
| Quadrant A | 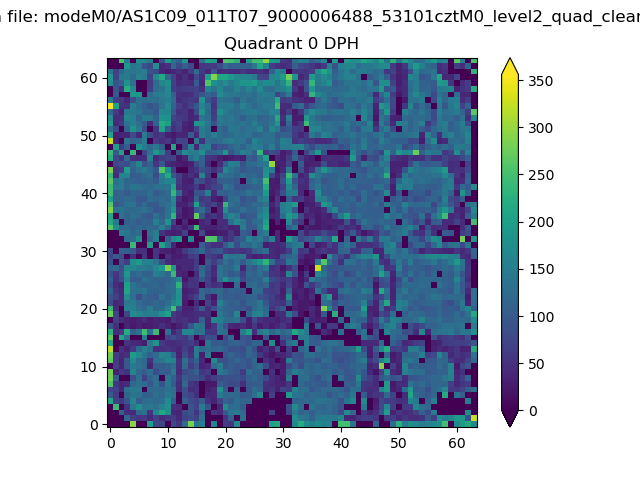 |
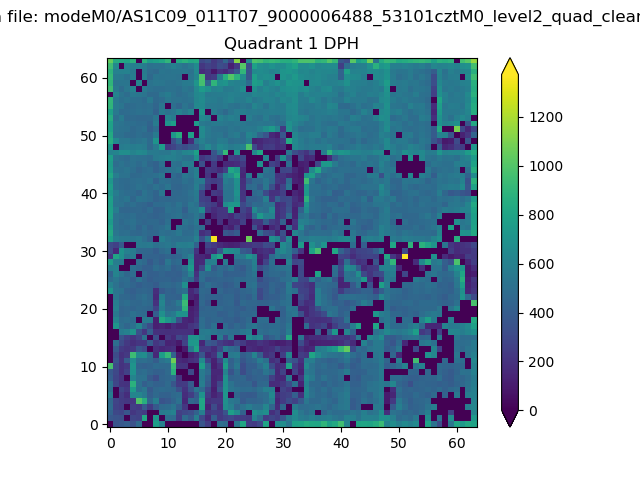 |
Quadrant B |
|---|---|---|---|
| Quadrant D | 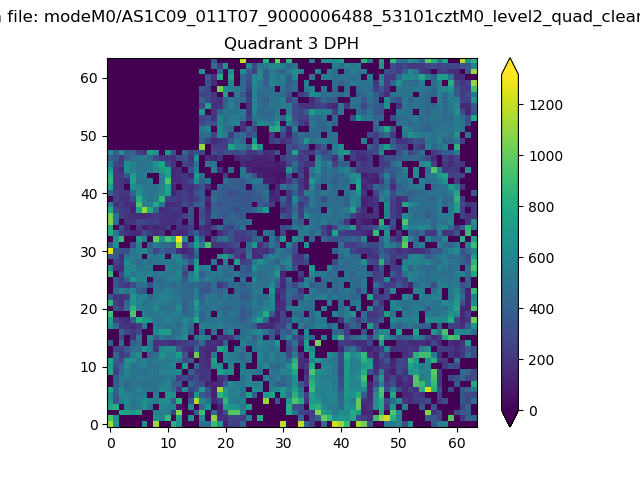 |
 |
Quadrant C |
| Plot type | Count rate plots | Images |
|---|---|---|
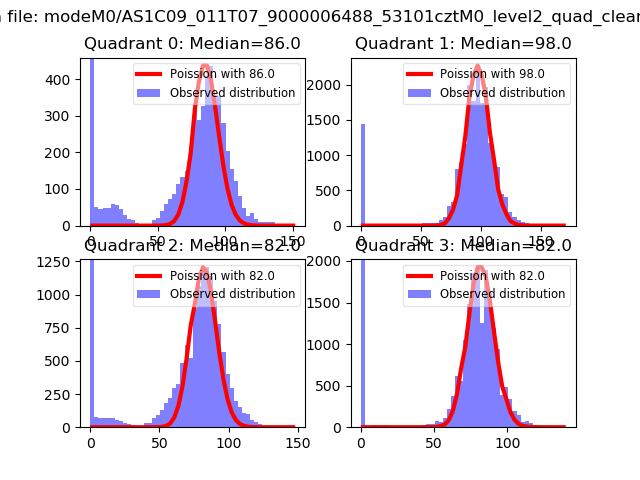
| Comparison with Poisson distribution Blue bars denote a histogram of data divided into 1 sec bins. Red curve is a Poisson curve with rate = median count rate of data. |
 |
 |
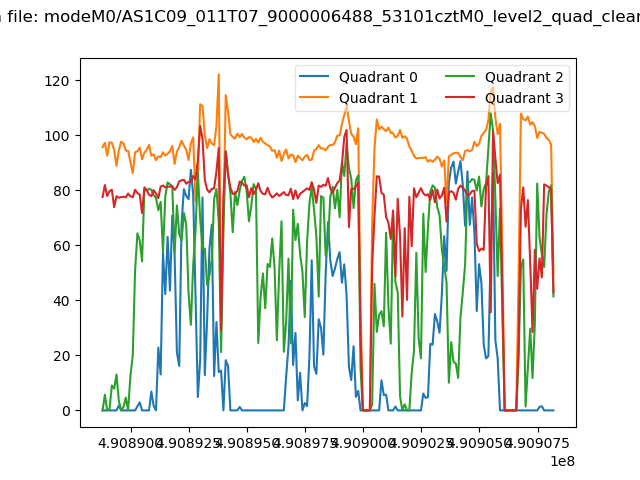
| Quadrant-wise count rates Data is divided into 100 sec bins |
 |
|
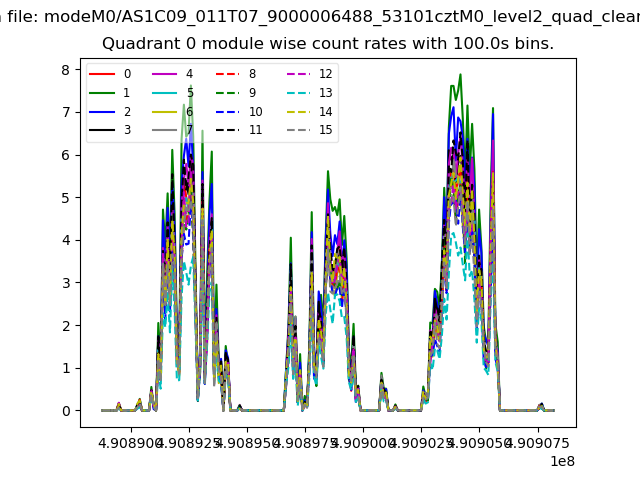
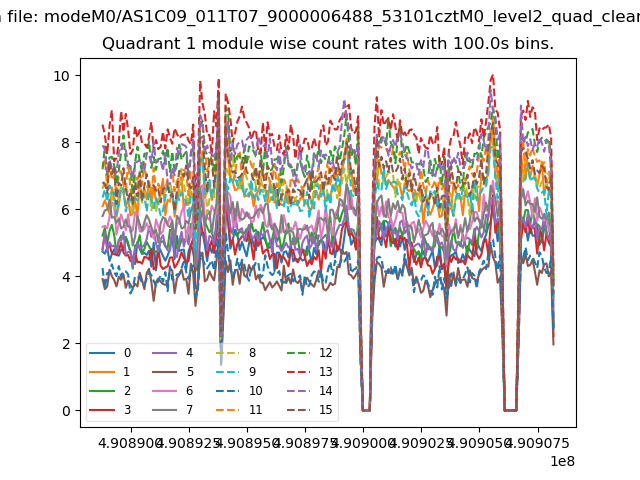
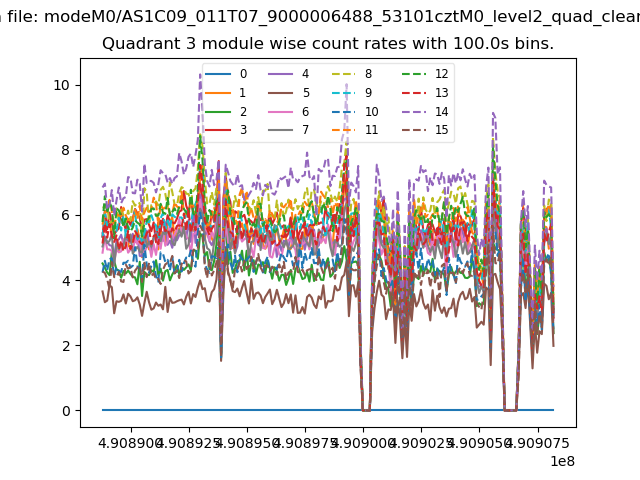
| Module-wise count rates for Quadrant A Data is divided into 100 sec bins |
 |
 |
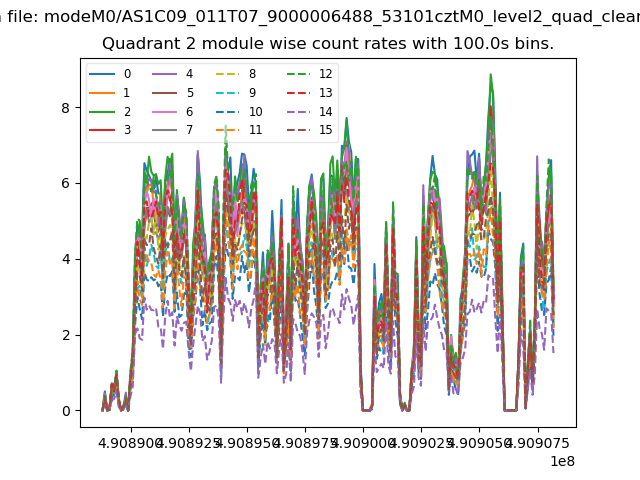
| Module-wise count rates for Quadrant B Data is divided into 100 sec bins |
 |
 |
| Module-wise count rates for Quadrant C Data is divided into 100 sec bins |
 |
 |
| Module-wise count rates for Quadrant D Data is divided into 100 sec bins |
 |
 |
| Parameter | Plot |
|---|---|
| CZT HV Monitor | 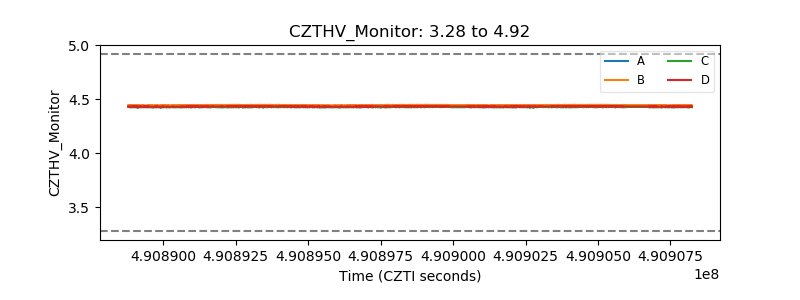 |
| D_VDD | 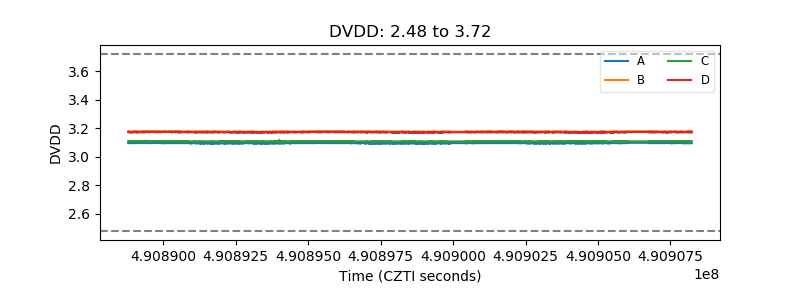 |
| Temperature 1 | 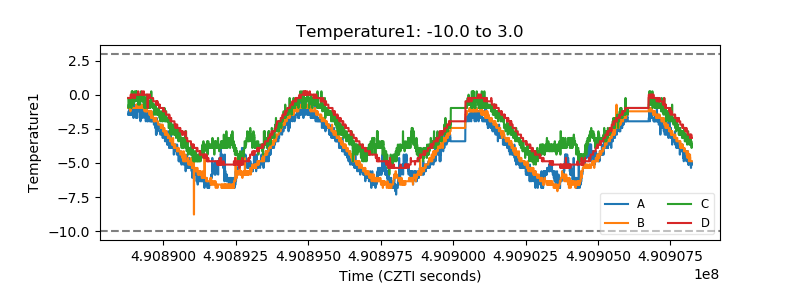 |
| Veto HV Monitor | 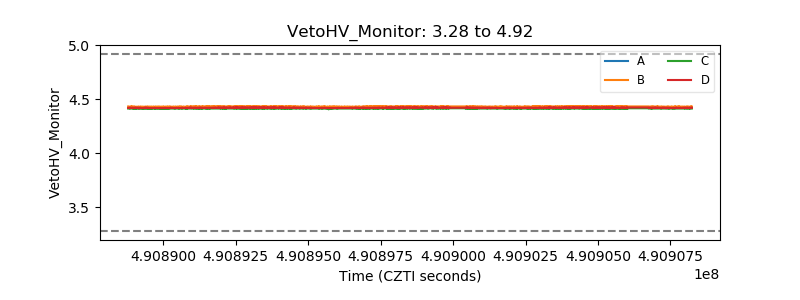 |
| Veto LLD | 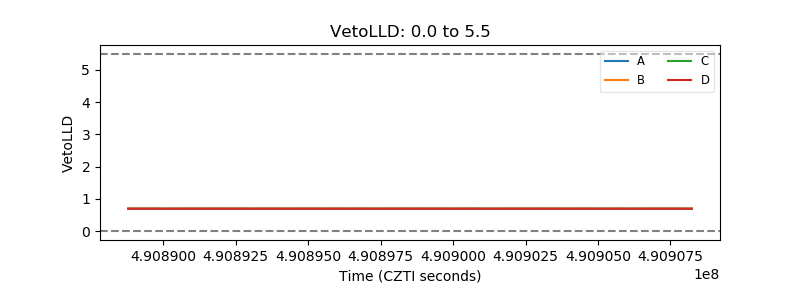 |
| Alpha Counter | 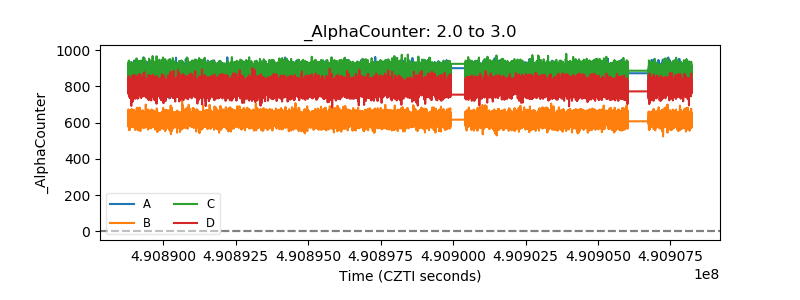 |
| _CPM_Rate | 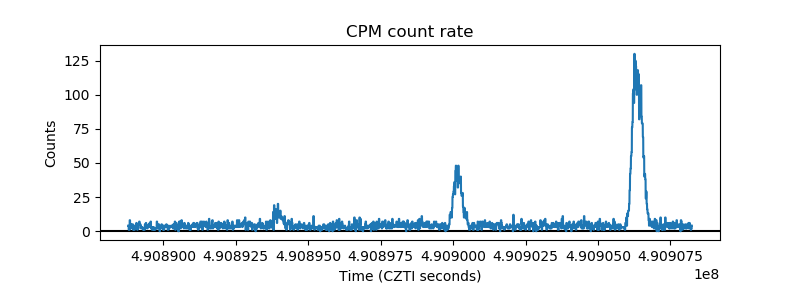 |
| CZT Counter | 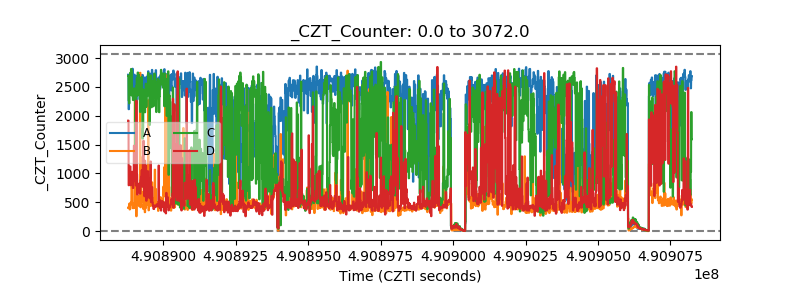 |
| +2.5 Volts monitor |  |
| +5 Volts monitor |  |
| _ROLL_ROT | 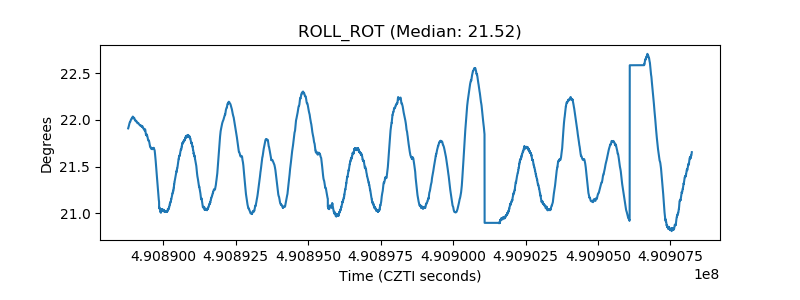 |
| _Roll_DEC | 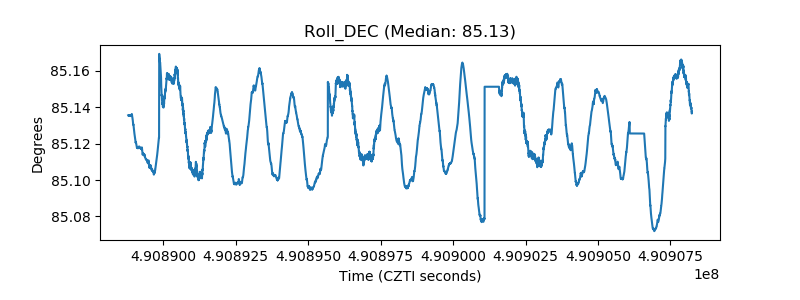 |
| _Roll_RA | 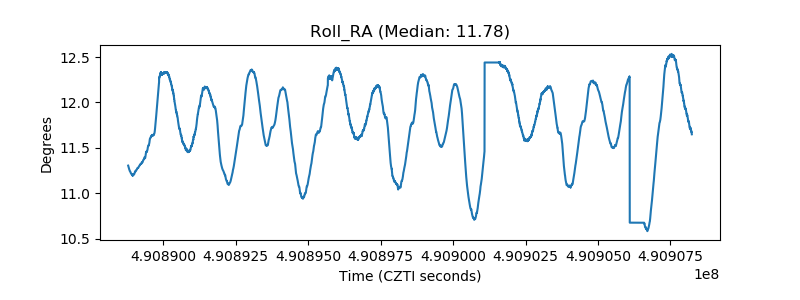 |
| Veto Counter | 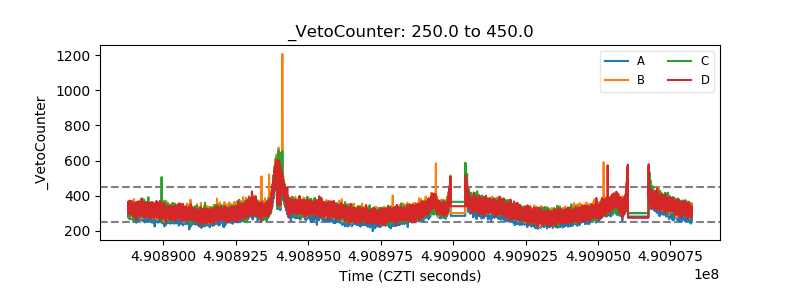 |