| Param | Original file | Final file |
|---|---|---|
| Filename | modeM0/AS1C09_011T07_9000006488_53106cztM0_level2.fits | modeM0/AS1C09_011T07_9000006488_53106cztM0_level2_quad_clean.evt |
| Size (bytes) | 783,368,640 | 80,896,320 |
| Size | 747.1 MB | 77.1 MB |
| Events in quadrant A | 13,613,934 | 219,186 |
| Events in quadrant B | 4,165,460 | 663,447 |
| Events in quadrant C | 5,568,269 | 577,674 |
| Events in quadrant D | 5,151,675 | 540,226 |
| Mode SS | |||
|---|---|---|---|
| Quadrant | BADHDUFLAG | Total packets | Discarded packets |
| A | 0 | 130 | 0 |
| B | 0 | 130 | 0 |
| C | 0 | 130 | 0 |
| D | 0 | 130 | 0 |
| Mode M9 | |||
|---|---|---|---|
| Quadrant | BADHDUFLAG | Total packets | Discarded packets |
| A | 0 | 12 | 0 |
| B | 0 | 12 | 0 |
| C | 0 | 12 | 0 |
| D | 0 | 12 | 0 |
| Mode M0 | |||
|---|---|---|---|
| Quadrant | BADHDUFLAG | Total packets | Discarded packets |
| A | 0 | 44805 | 2 |
| B | 0 | 16969 | 1 |
| C | 0 | 21050 | 1 |
| D | 0 | 19952 | 1 |
| Quadrant | Total seconds | Saturated seconds | Saturation percentage |
|---|---|---|---|
| A | 6433 | 4564 | 70.946681% |
| B | 6433 | 203 | 3.155604% |
| C | 6434 | 460 | 7.149518% |
| D | 6434 | 522 | 8.113149% |
Noise dominated data is calculated using 1-second bins in cleaned event files. If a bin has >2000 counts, and if more than 50% of those come from <1% of pixels, then it is considered to be noise-dominated and hence unusable.
| Quadrant | # 1 sec bins | Bins with >0 counts | Bins with >2000 counts | High rate bins dominated by noise | Noise dominated (total time) | Noise dominated (detector-on time) | Marked lightcurve |
|---|---|---|---|---|---|---|---|
| A | 7642 | 6432 | 4356 | 4356 | 57.00% | 67.72% | 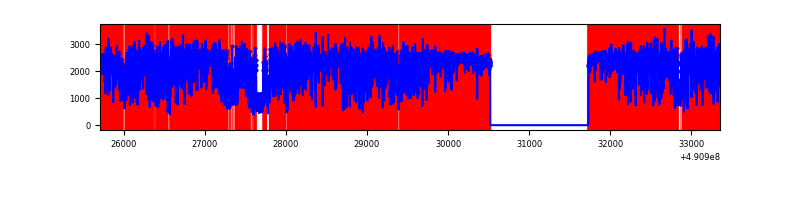 |
| B | 7643 | 6433 | 114 | 114 | 1.49% | 1.77% | 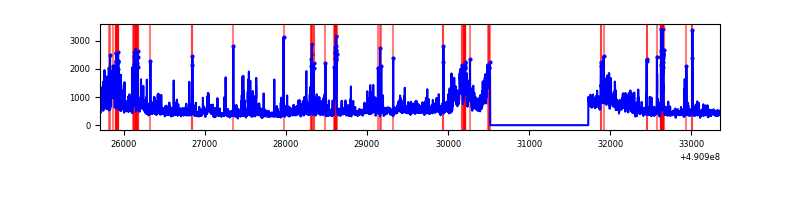 |
| C | 7644 | 6435 | 498 | 498 | 6.51% | 7.74% | 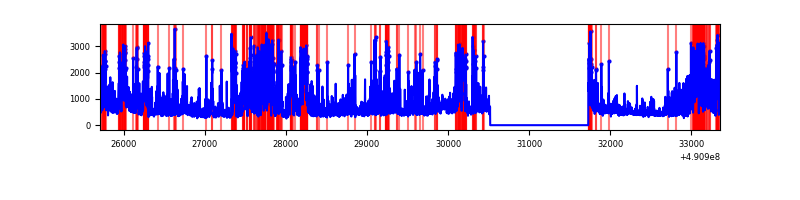 |
| D | 7644 | 6435 | 545 | 545 | 7.13% | 8.47% | 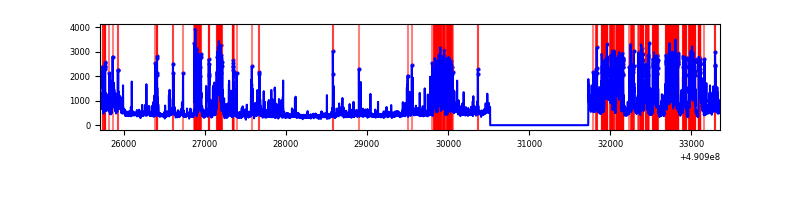 |
Top three noisy pixels from each quadrant. If the there are fewer than three noisy pixels in the level2.evt file, extra rows are filled as -1
| Pixel properties | Quadrant properties | ||||||
|---|---|---|---|---|---|---|---|
| Quadrant | DetID | PixID | Counts | Sigma | Mean | Median | Sigma |
| A | 9 | 191 | 11138715 | 94740.94 | 464 | 452 | 117.6 |
| A | 12 | 80 | 231271 | 1963.32 | 464 | 452 | 117.6 |
| A | 6 | 248 | 145899 | 1237.16 | 464 | 452 | 117.6 |
| B | 4 | 171 | 327147 | 2372.26 | 655 | 633 | 137.6 |
| B | 10 | 254 | 318152 | 2306.9 | 655 | 633 | 137.6 |
| B | 14 | 167 | 185174 | 1340.76 | 655 | 633 | 137.6 |
| C | 15 | 224 | 1393819 | 7935.99 | 632 | 625 | 175.6 |
| C | 0 | 240 | 779670 | 4437.64 | 632 | 625 | 175.6 |
| C | 15 | 157 | 241475 | 1371.94 | 632 | 625 | 175.6 |
| D | 12 | 3 | 1294354 | 7191.91 | 622 | 593 | 179.9 |
| D | 2 | 249 | 707023 | 3926.99 | 622 | 593 | 179.9 |
| D | 10 | 172 | 177898 | 985.62 | 622 | 593 | 179.9 |
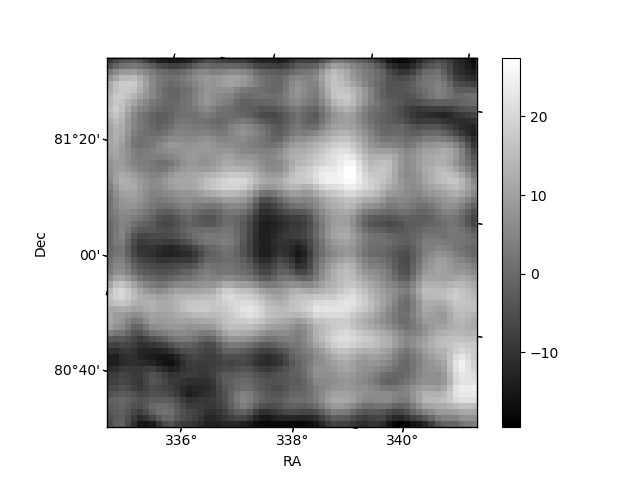
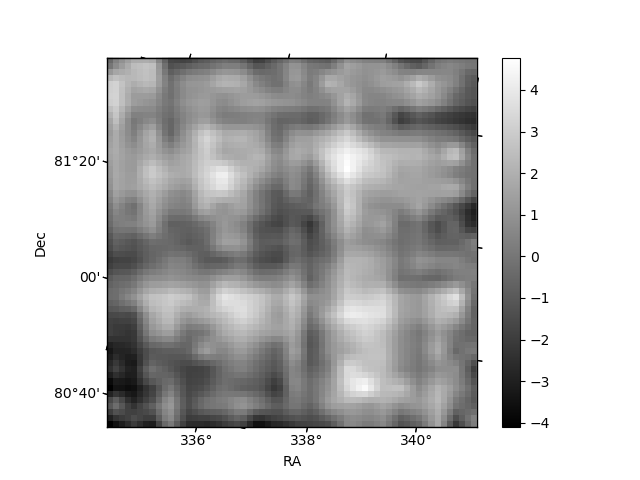
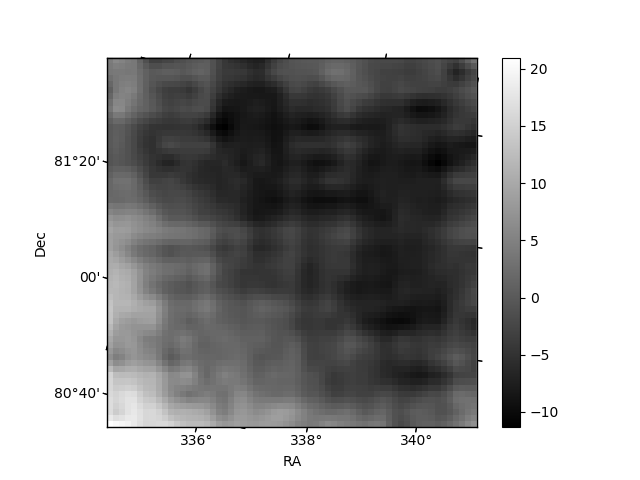
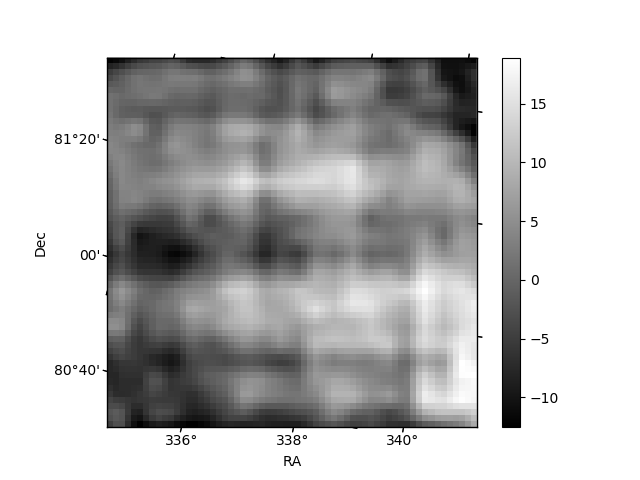
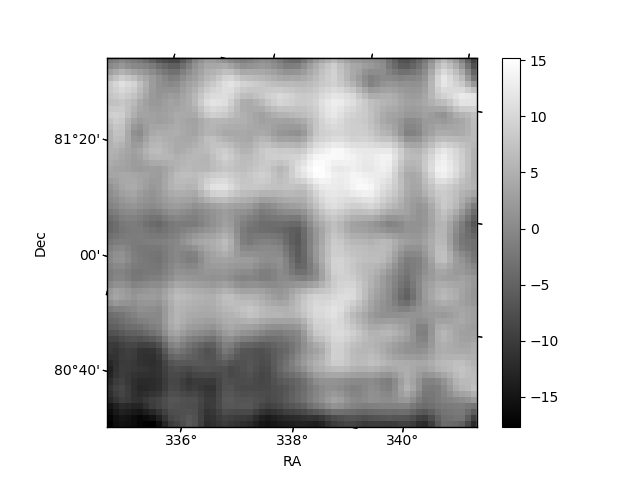
Histogram calculated using DETX and DETY for each event in the final _common_clean file
| Quadrant A | 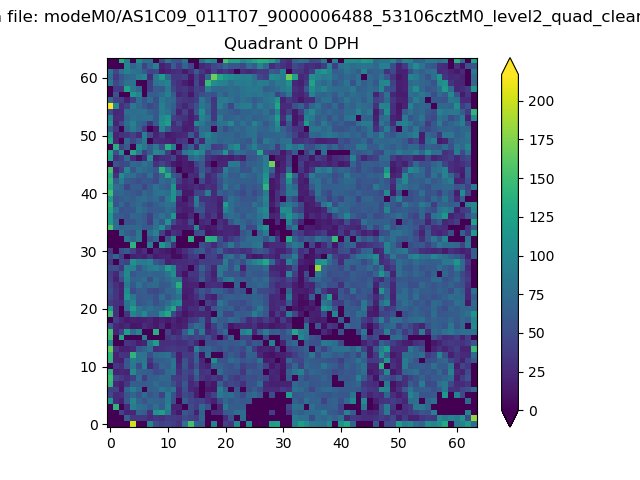 |
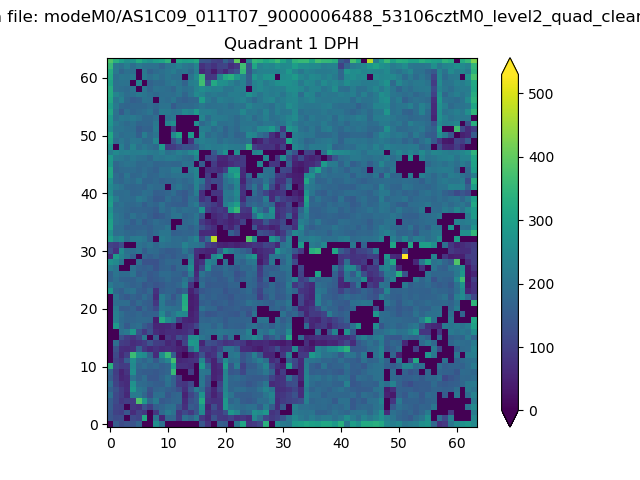 |
Quadrant B |
|---|---|---|---|
| Quadrant D | 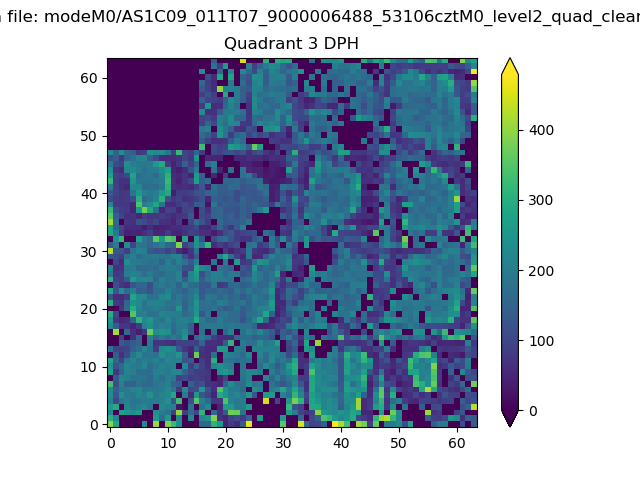 |
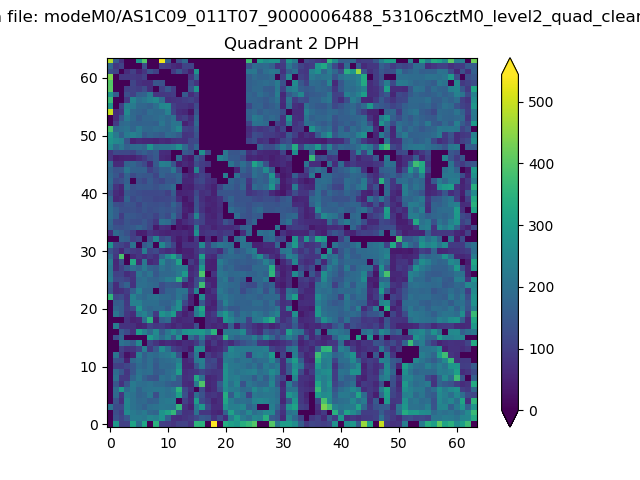 |
Quadrant C |
| Plot type | Count rate plots | Images |
|---|---|---|
| Comparison with Poisson distribution Blue bars denote a histogram of data divided into 1 sec bins. Red curve is a Poisson curve with rate = median count rate of data. |
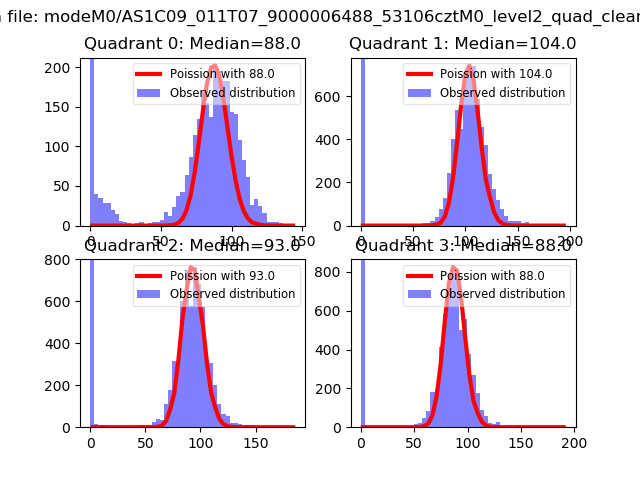 |
 |
| Quadrant-wise count rates Data is divided into 100 sec bins |
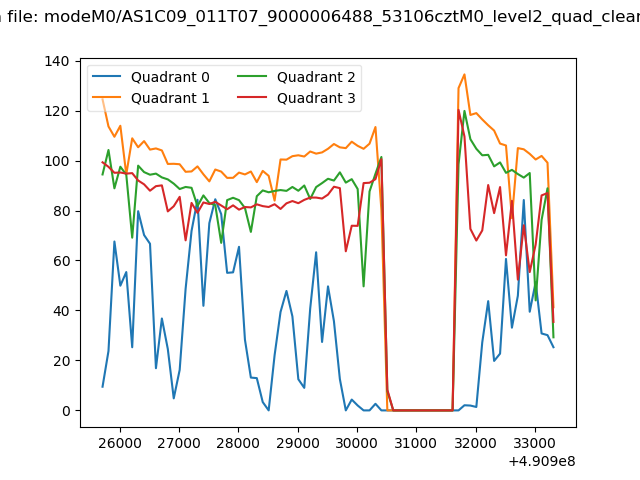 |
|
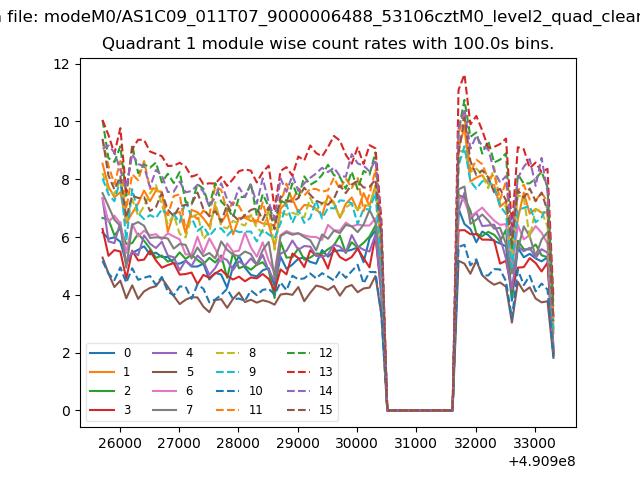
| Module-wise count rates for Quadrant A Data is divided into 100 sec bins |
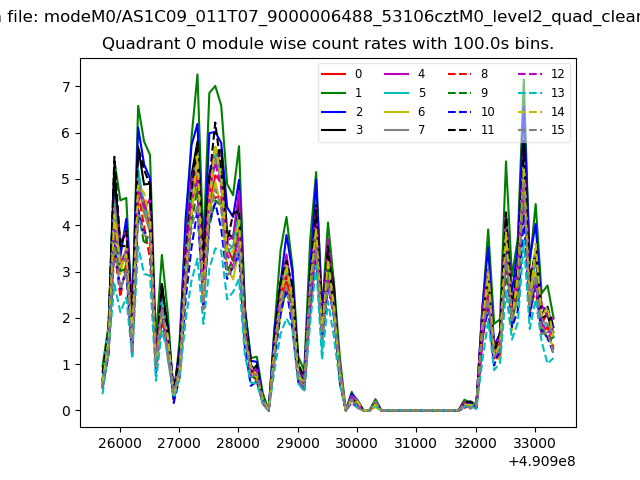 |
 |
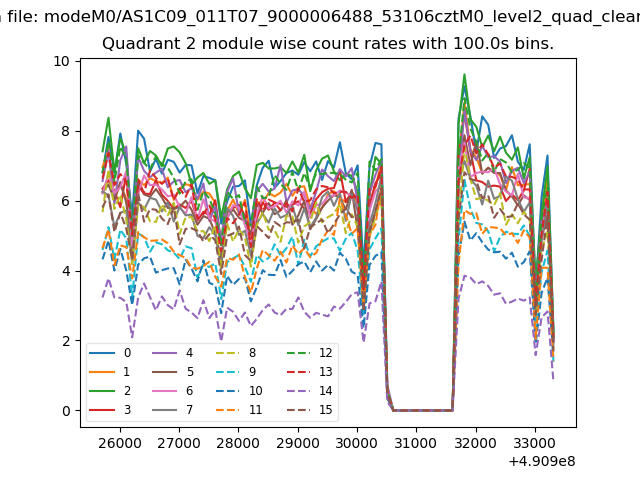
| Module-wise count rates for Quadrant B Data is divided into 100 sec bins |
 |
 |
| Module-wise count rates for Quadrant C Data is divided into 100 sec bins |
 |
 |
| Module-wise count rates for Quadrant D Data is divided into 100 sec bins |
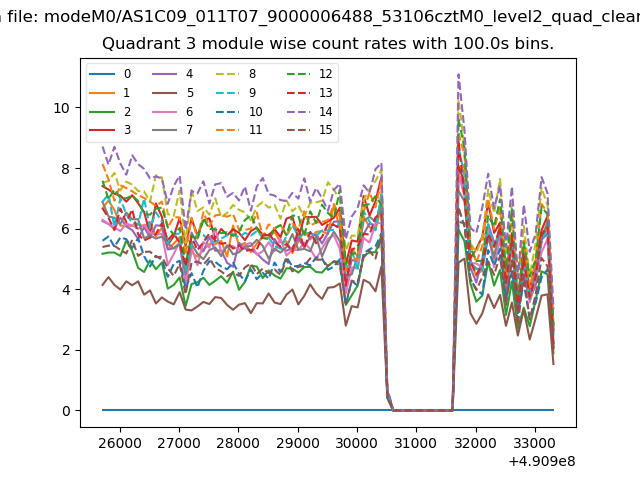 |
 |
| Parameter | Plot |
|---|---|
| CZT HV Monitor |  |
| D_VDD | 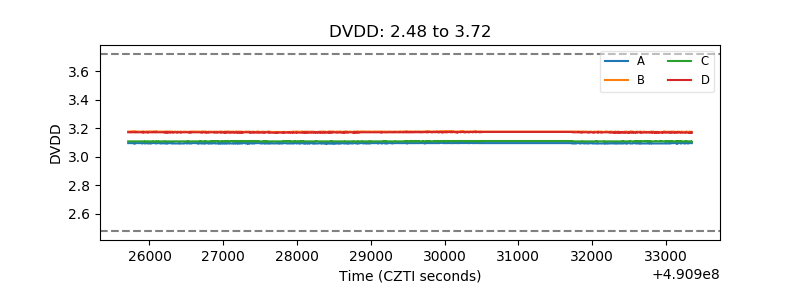 |
| Temperature 1 | 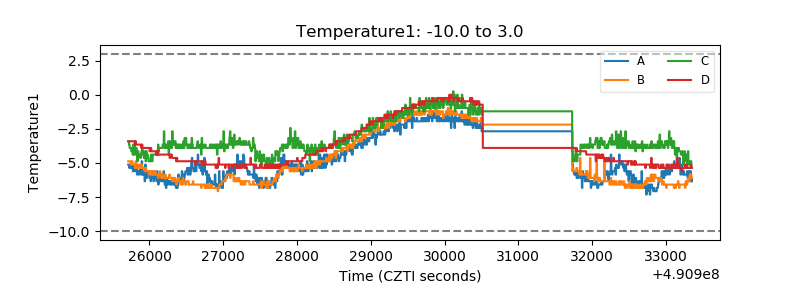 |
| Veto HV Monitor | 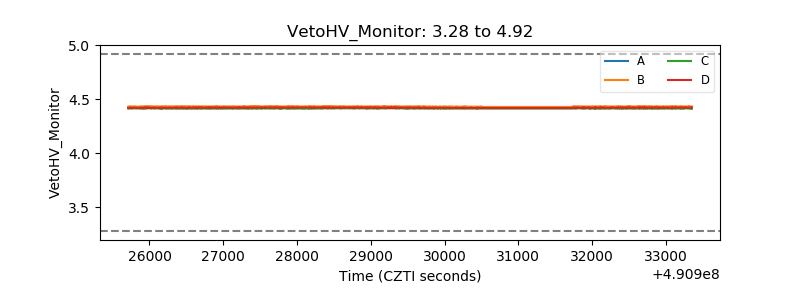 |
| Veto LLD | 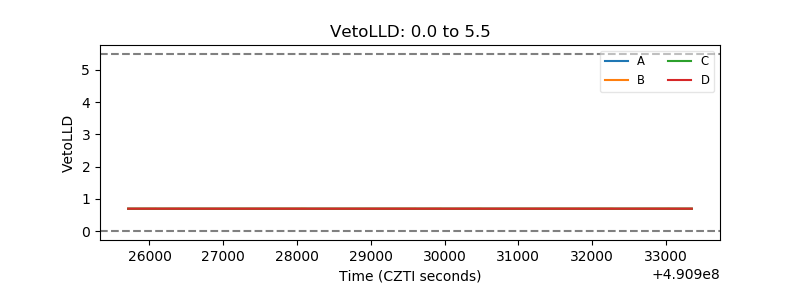 |
| Alpha Counter | 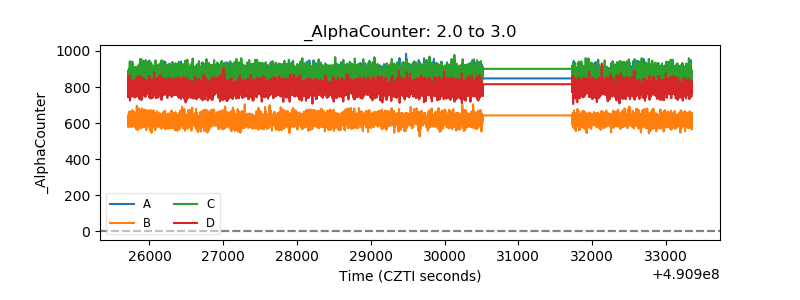 |
| _CPM_Rate | 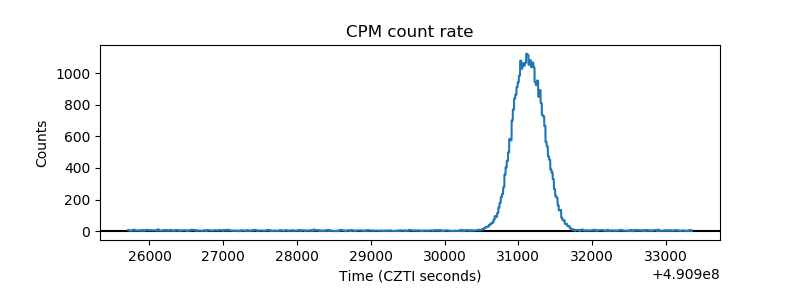 |
| CZT Counter | 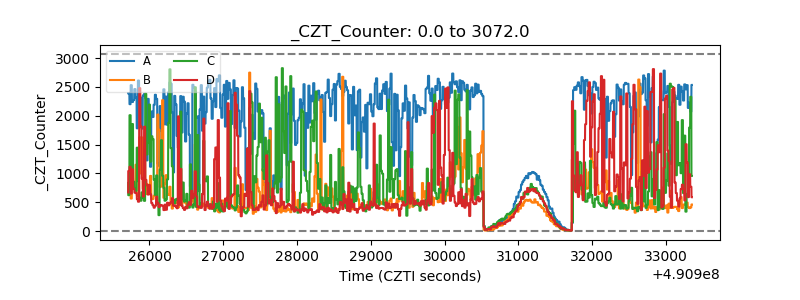 |
| +2.5 Volts monitor | 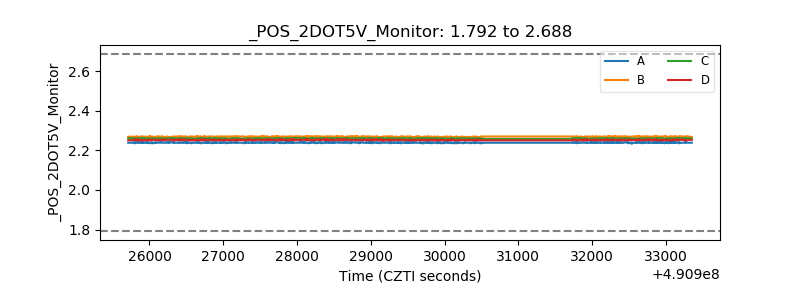 |
| +5 Volts monitor |  |
| _ROLL_ROT | 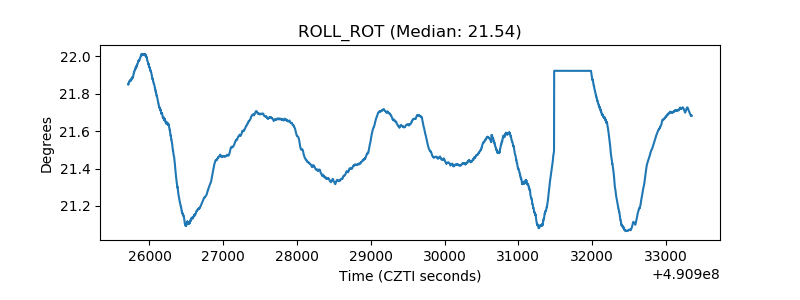 |
| _Roll_DEC | 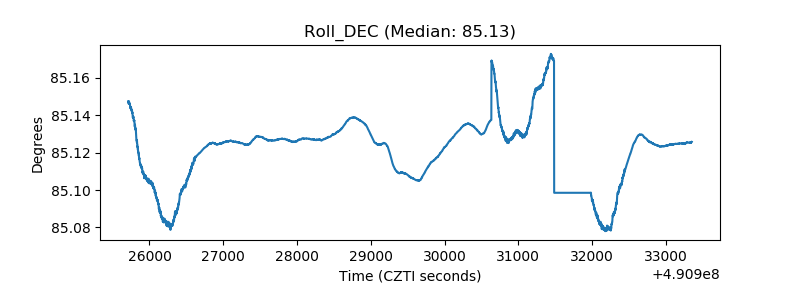 |
| _Roll_RA | 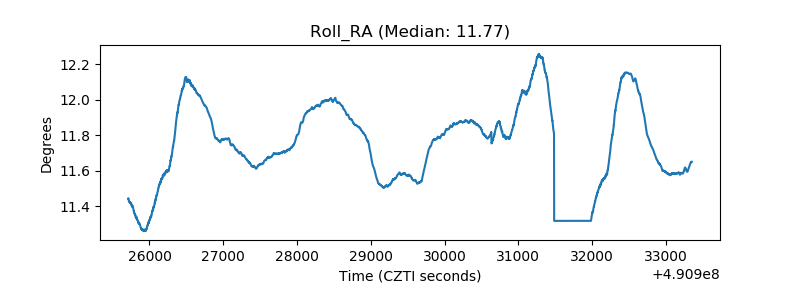 |
| Veto Counter | 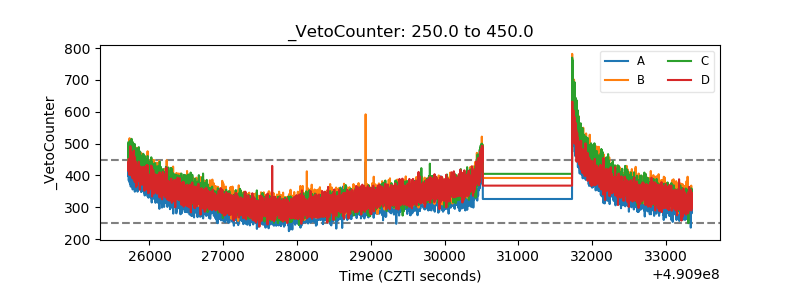 |