| Param | Original file | Final file |
|---|---|---|
| Filename | modeM0/AS1C09_011T07_9000006488_53107cztM0_level2.fits | modeM0/AS1C09_011T07_9000006488_53107cztM0_level2_quad_clean.evt |
| Size (bytes) | 818,714,880 | 79,280,640 |
| Size | 780.8 MB | 75.6 MB |
| Events in quadrant A | 11,529,192 | 358,853 |
| Events in quadrant B | 6,388,122 | 601,558 |
| Events in quadrant C | 5,369,555 | 552,683 |
| Events in quadrant D | 6,530,538 | 445,635 |
| Mode SS | |||
|---|---|---|---|
| Quadrant | BADHDUFLAG | Total packets | Discarded packets |
| A | 0 | 130 | 0 |
| B | 0 | 130 | 0 |
| C | 0 | 130 | 0 |
| D | 0 | 130 | 0 |
| Mode M9 | |||
|---|---|---|---|
| Quadrant | BADHDUFLAG | Total packets | Discarded packets |
| A | 0 | 12 | 0 |
| B | 0 | 12 | 0 |
| C | 0 | 12 | 0 |
| D | 0 | 12 | 0 |
| Mode M0 | |||
|---|---|---|---|
| Quadrant | BADHDUFLAG | Total packets | Discarded packets |
| A | 0 | 38629 | 1 |
| B | 0 | 23450 | 1 |
| C | 0 | 20424 | 1 |
| D | 0 | 23828 | 1 |
| Quadrant | Total seconds | Saturated seconds | Saturation percentage |
|---|---|---|---|
| A | 6321 | 3091 | 48.900490% |
| B | 6321 | 792 | 12.529663% |
| C | 6321 | 555 | 8.780256% |
| D | 6321 | 1567 | 24.790381% |
Noise dominated data is calculated using 1-second bins in cleaned event files. If a bin has >2000 counts, and if more than 50% of those come from <1% of pixels, then it is considered to be noise-dominated and hence unusable.
| Quadrant | # 1 sec bins | Bins with >0 counts | Bins with >2000 counts | High rate bins dominated by noise | Noise dominated (total time) | Noise dominated (detector-on time) | Marked lightcurve |
|---|---|---|---|---|---|---|---|
| A | 7526 | 6321 | 2879 | 2879 | 38.25% | 45.55% | 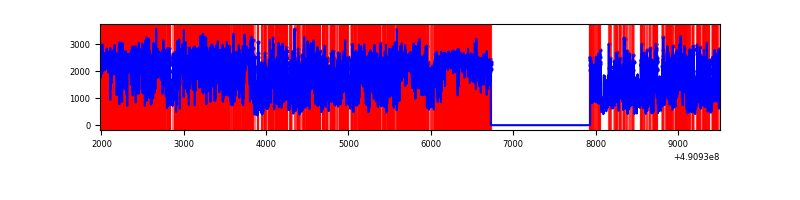 |
| B | 7526 | 6322 | 646 | 646 | 8.58% | 10.22% | 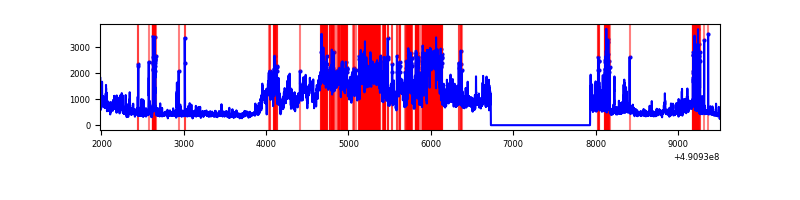 |
| C | 7526 | 6322 | 555 | 555 | 7.37% | 8.78% | 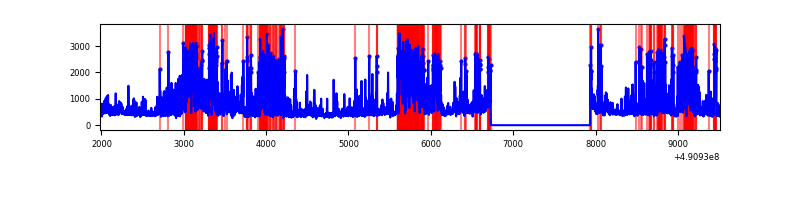 |
| D | 7526 | 6321 | 969 | 969 | 12.88% | 15.33% | 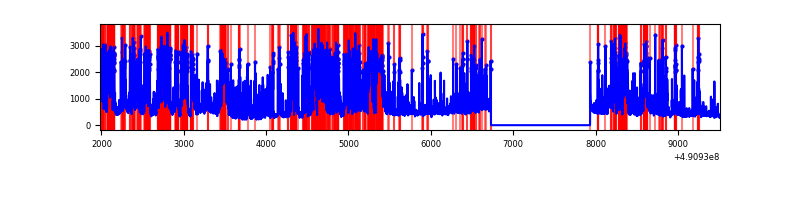 |
Top three noisy pixels from each quadrant. If the there are fewer than three noisy pixels in the level2.evt file, extra rows are filled as -1
| Pixel properties | Quadrant properties | ||||||
|---|---|---|---|---|---|---|---|
| Quadrant | DetID | PixID | Counts | Sigma | Mean | Median | Sigma |
| A | 9 | 191 | 8379055 | 62111.72 | 535 | 521 | 134.9 |
| A | 3 | 62 | 418775 | 3100.6 | 535 | 521 | 134.9 |
| A | 6 | 248 | 258161 | 1909.94 | 535 | 521 | 134.9 |
| B | 10 | 254 | 1847819 | 14031.16 | 620 | 600 | 131.7 |
| B | 10 | 128 | 937244 | 7114.59 | 620 | 600 | 131.7 |
| B | 14 | 167 | 403643 | 3061.45 | 620 | 600 | 131.7 |
| C | 15 | 224 | 1494299 | 8604.67 | 613 | 605 | 173.6 |
| C | 0 | 240 | 402468 | 2315.0 | 613 | 605 | 173.6 |
| C | 1 | 241 | 390527 | 2246.21 | 613 | 605 | 173.6 |
| D | 12 | 3 | 3660830 | 23717.55 | 536 | 511 | 154.3 |
| D | 3 | 12 | 235212 | 1520.78 | 536 | 511 | 154.3 |
| D | 2 | 120 | 107274 | 691.79 | 536 | 511 | 154.3 |
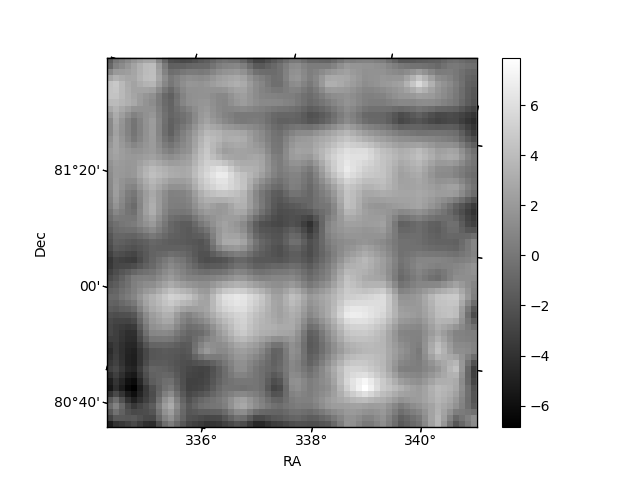
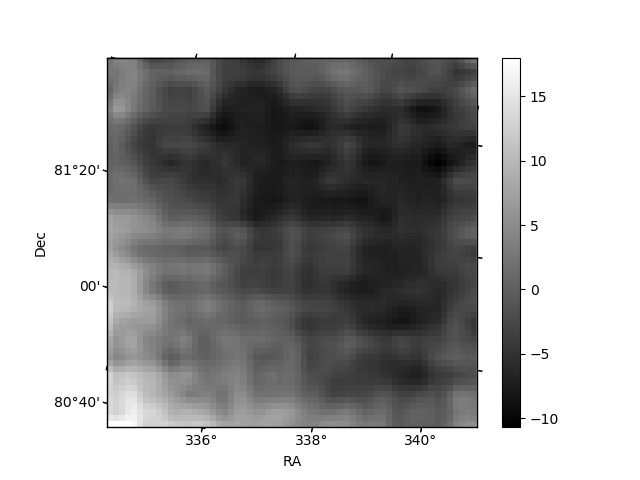
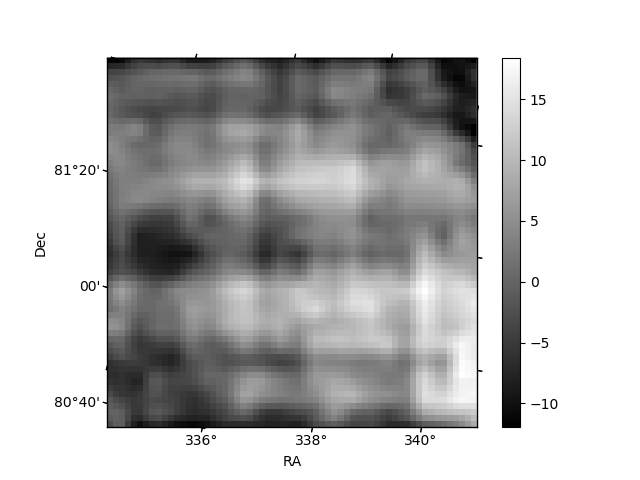
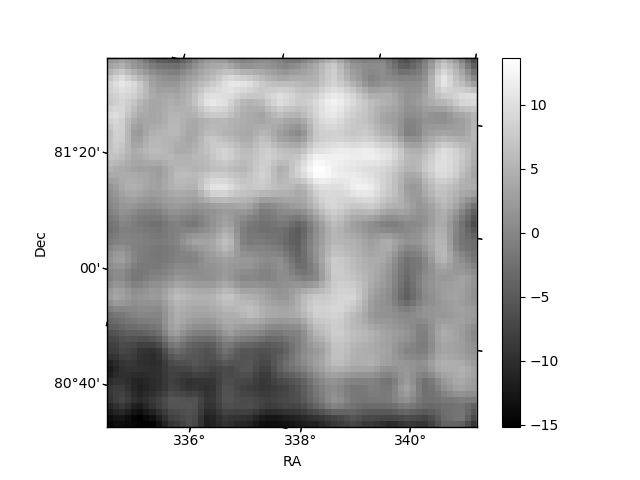
Histogram calculated using DETX and DETY for each event in the final _common_clean file
| Quadrant A |  |
 |
Quadrant B |
|---|---|---|---|
| Quadrant D |  |
 |
Quadrant C |
| Plot type | Count rate plots | Images |
|---|---|---|
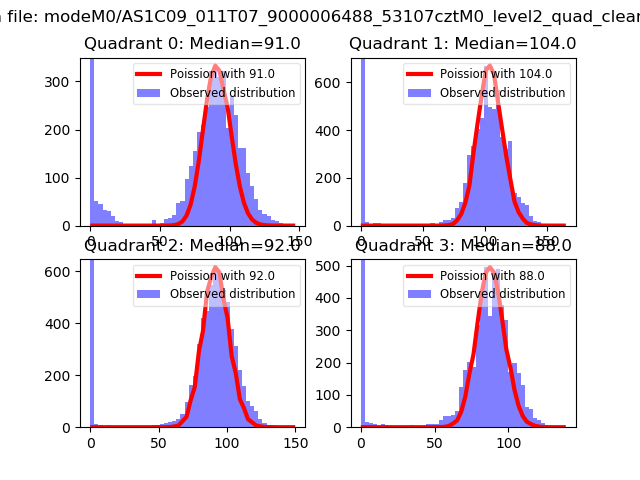
| Comparison with Poisson distribution Blue bars denote a histogram of data divided into 1 sec bins. Red curve is a Poisson curve with rate = median count rate of data. |
 |
 |
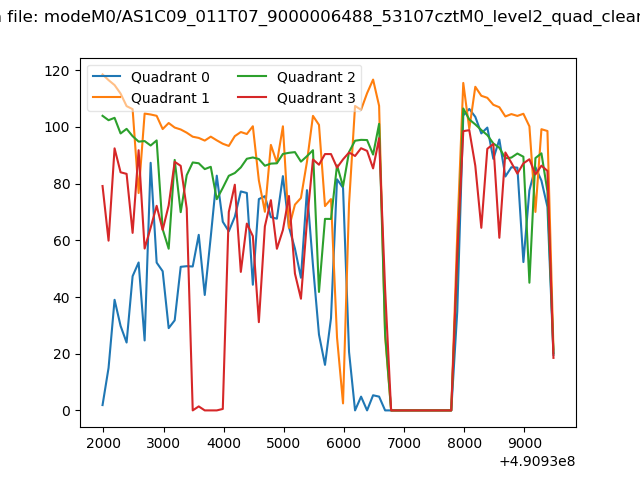
| Quadrant-wise count rates Data is divided into 100 sec bins |
 |
|
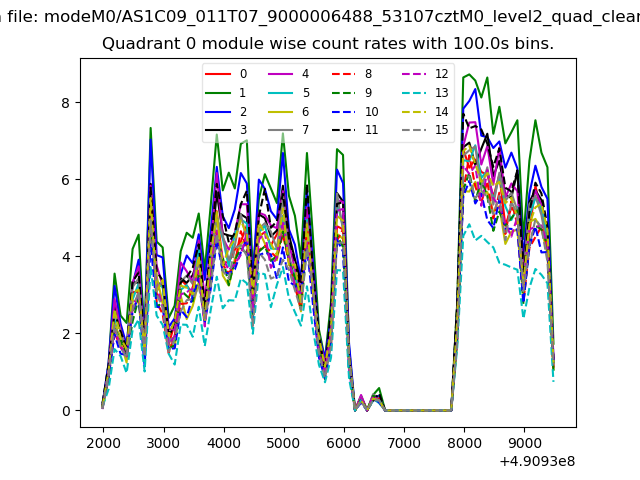
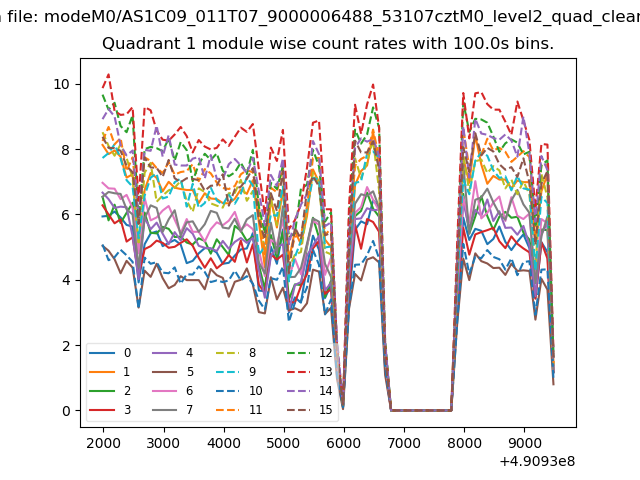
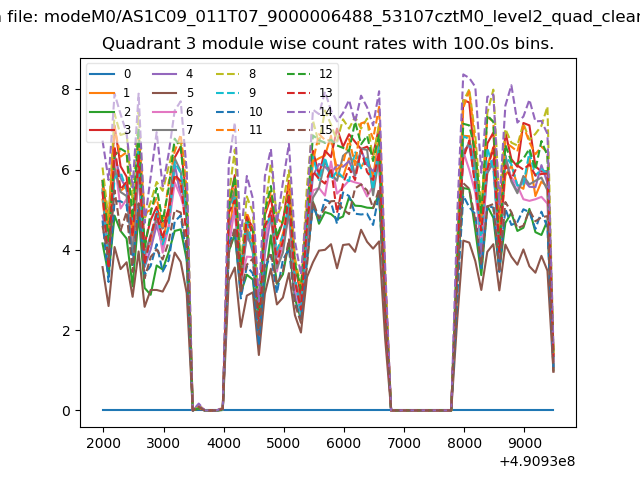
| Module-wise count rates for Quadrant A Data is divided into 100 sec bins |
 |
 |
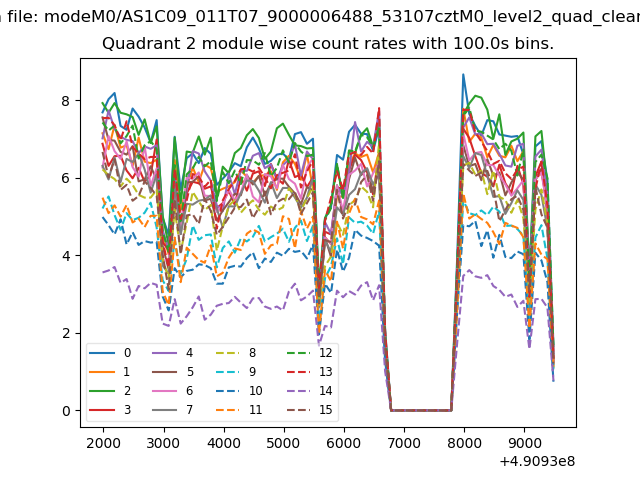
| Module-wise count rates for Quadrant B Data is divided into 100 sec bins |
 |
 |
| Module-wise count rates for Quadrant C Data is divided into 100 sec bins |
 |
 |
| Module-wise count rates for Quadrant D Data is divided into 100 sec bins |
 |
 |
| Parameter | Plot |
|---|---|
| CZT HV Monitor | 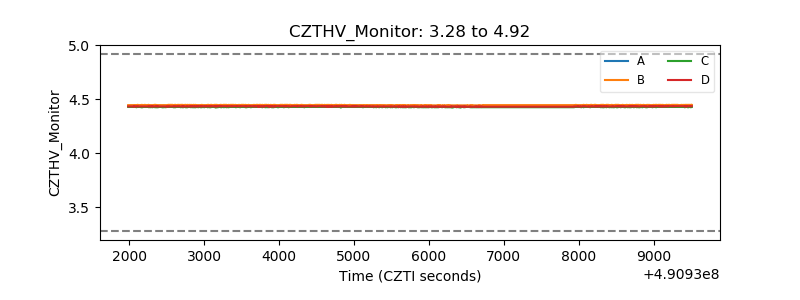 |
| D_VDD | 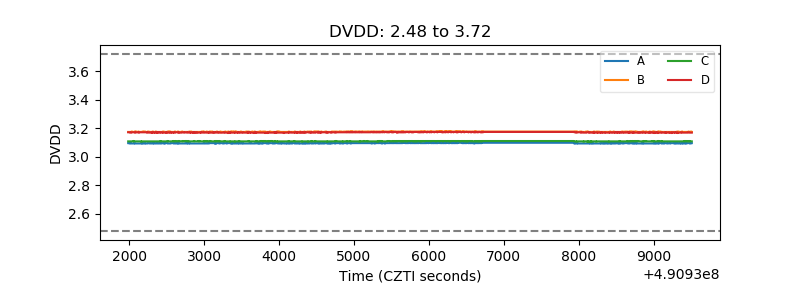 |
| Temperature 1 | 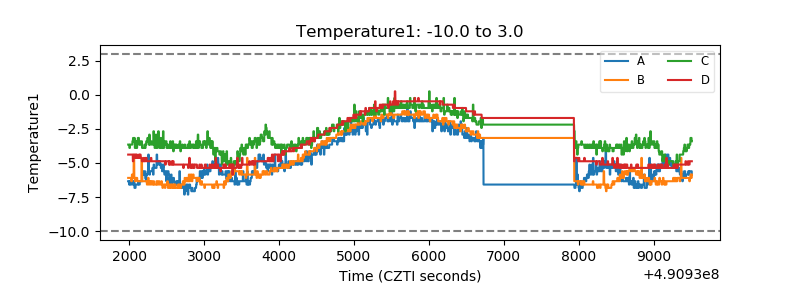 |
| Veto HV Monitor | 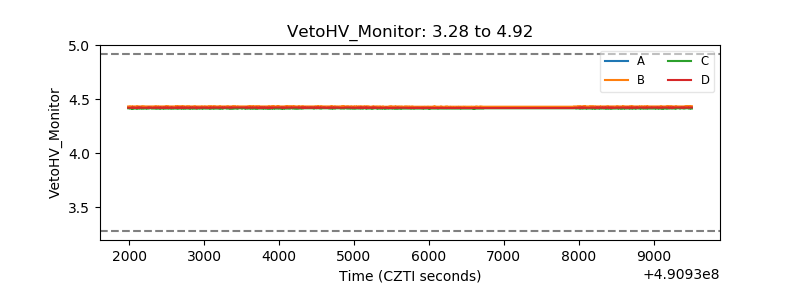 |
| Veto LLD | 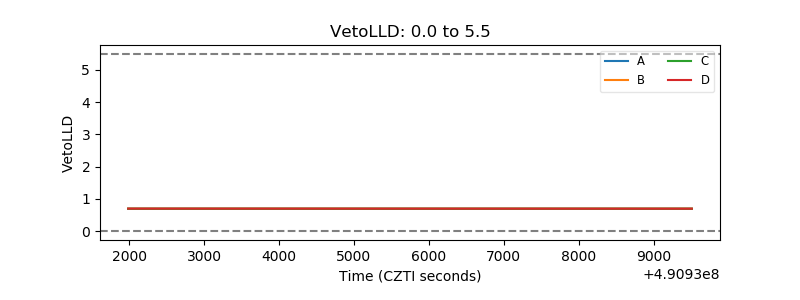 |
| Alpha Counter | 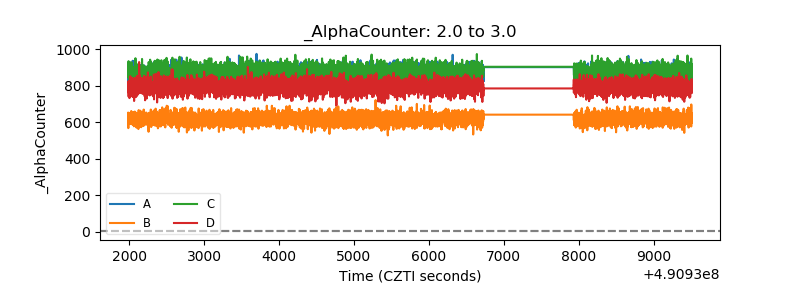 |
| _CPM_Rate | 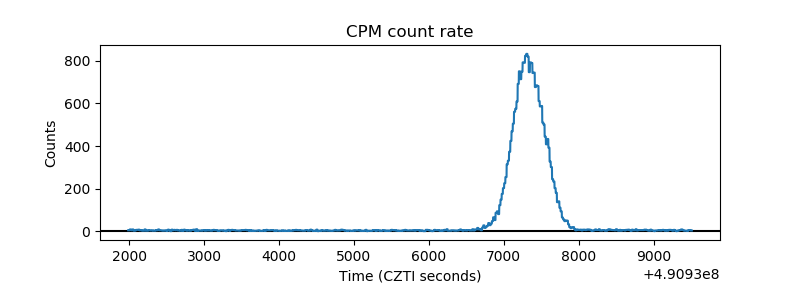 |
| CZT Counter | 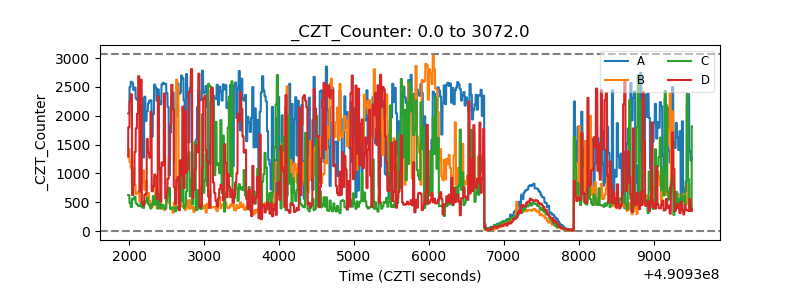 |
| +2.5 Volts monitor |  |
| +5 Volts monitor |  |
| _ROLL_ROT | 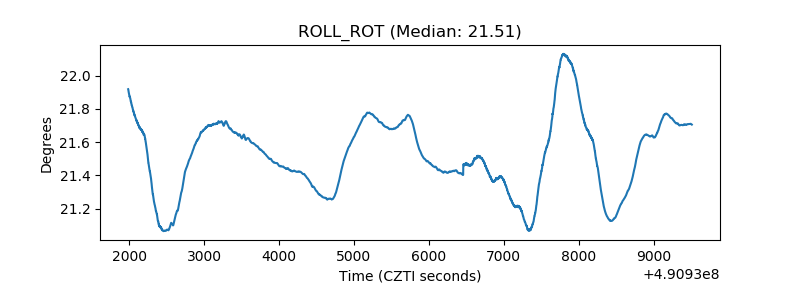 |
| _Roll_DEC | 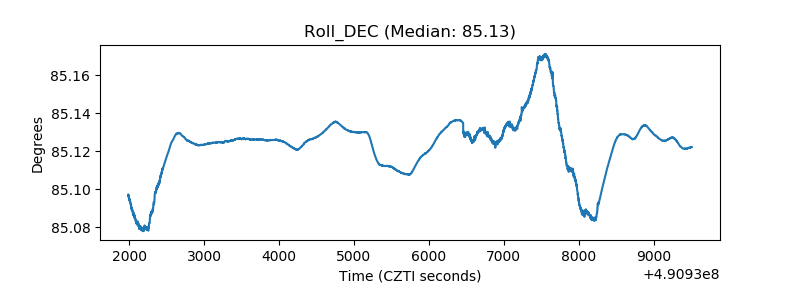 |
| _Roll_RA | 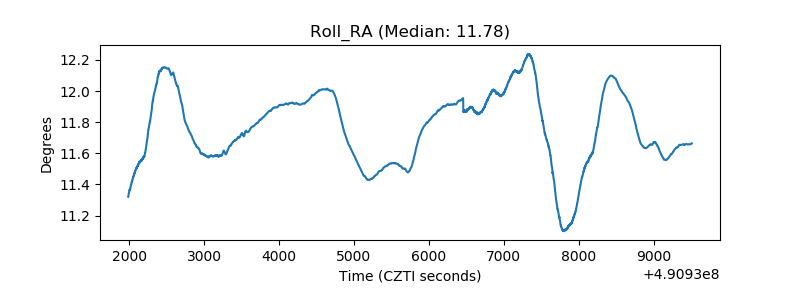 |
| Veto Counter | 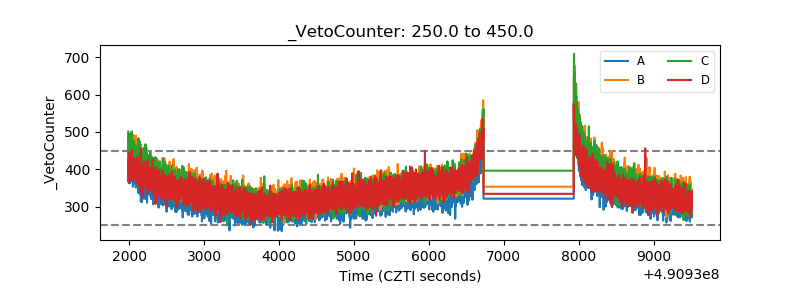 |