| Param | Original file | Final file |
|---|---|---|
| Filename | modeM0/AS1C09_011T07_9000006488_53109cztM0_level2.fits | modeM0/AS1C09_011T07_9000006488_53109cztM0_level2_quad_clean.evt |
| Size (bytes) | 757,794,240 | 86,051,520 |
| Size | 722.7 MB | 82.1 MB |
| Events in quadrant A | 10,206,984 | 452,219 |
| Events in quadrant B | 4,128,655 | 665,474 |
| Events in quadrant C | 7,985,310 | 489,189 |
| Events in quadrant D | 5,218,880 | 537,828 |
| Mode SS | |||
|---|---|---|---|
| Quadrant | BADHDUFLAG | Total packets | Discarded packets |
| A | 0 | 132 | 0 |
| B | 0 | 132 | 0 |
| C | 0 | 132 | 0 |
| D | 0 | 132 | 0 |
| Mode M9 | |||
|---|---|---|---|
| Quadrant | BADHDUFLAG | Total packets | Discarded packets |
| A | 0 | 10 | 0 |
| B | 0 | 10 | 0 |
| C | 0 | 10 | 0 |
| D | 0 | 10 | 0 |
| Mode M0 | |||
|---|---|---|---|
| Quadrant | BADHDUFLAG | Total packets | Discarded packets |
| A | 0 | 34900 | 1 |
| B | 0 | 16935 | 1 |
| C | 0 | 28462 | 1 |
| D | 0 | 20425 | 1 |
| Quadrant | Total seconds | Saturated seconds | Saturation percentage |
|---|---|---|---|
| A | 6608 | 2283 | 34.549031% |
| B | 6608 | 294 | 4.449153% |
| C | 6609 | 1672 | 25.298835% |
| D | 6609 | 630 | 9.532456% |
Noise dominated data is calculated using 1-second bins in cleaned event files. If a bin has >2000 counts, and if more than 50% of those come from <1% of pixels, then it is considered to be noise-dominated and hence unusable.
| Quadrant | # 1 sec bins | Bins with >0 counts | Bins with >2000 counts | High rate bins dominated by noise | Noise dominated (total time) | Noise dominated (detector-on time) | Marked lightcurve |
|---|---|---|---|---|---|---|---|
| A | 7533 | 6608 | 1946 | 1946 | 25.83% | 29.45% | 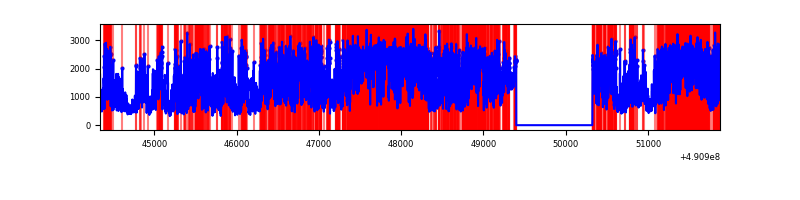 |
| B | 7533 | 6608 | 110 | 110 | 1.46% | 1.66% | 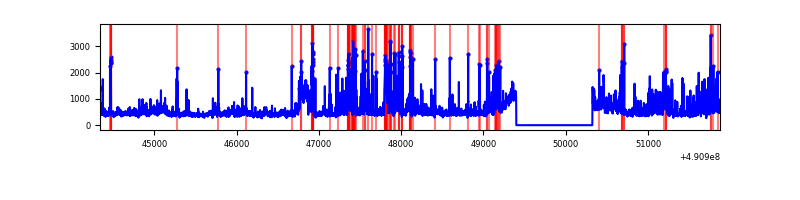 |
| C | 7534 | 6609 | 1456 | 1456 | 19.33% | 22.03% | 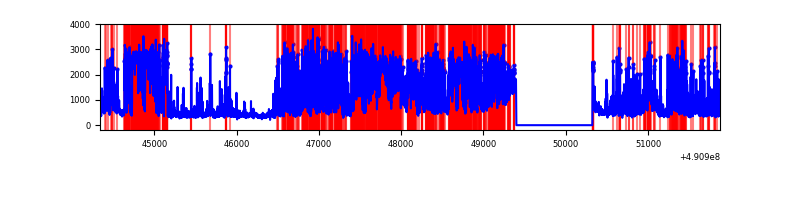 |
| D | 7534 | 6609 | 458 | 458 | 6.08% | 6.93% | 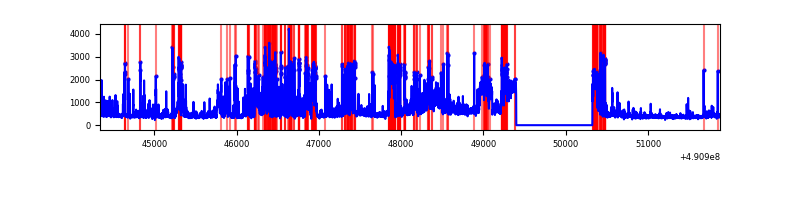 |
Top three noisy pixels from each quadrant. If the there are fewer than three noisy pixels in the level2.evt file, extra rows are filled as -1
| Pixel properties | Quadrant properties | ||||||
|---|---|---|---|---|---|---|---|
| Quadrant | DetID | PixID | Counts | Sigma | Mean | Median | Sigma |
| A | 9 | 191 | 6894804 | 43555.99 | 620 | 607 | 158.3 |
| A | 12 | 80 | 291688 | 1838.98 | 620 | 607 | 158.3 |
| A | 4 | 249 | 210312 | 1324.87 | 620 | 607 | 158.3 |
| B | 10 | 254 | 433388 | 2971.74 | 680 | 658 | 145.6 |
| B | 2 | 249 | 259635 | 1778.51 | 680 | 658 | 145.6 |
| B | 10 | 28 | 169825 | 1161.74 | 680 | 658 | 145.6 |
| C | 15 | 224 | 2421016 | 13930.18 | 610 | 601 | 173.8 |
| C | 15 | 157 | 1102032 | 6339.05 | 610 | 601 | 173.8 |
| C | 1 | 241 | 804809 | 4628.44 | 610 | 601 | 173.8 |
| D | 12 | 3 | 1184786 | 6178.49 | 654 | 625 | 191.7 |
| D | 10 | 172 | 705719 | 3678.9 | 654 | 625 | 191.7 |
| D | 3 | 12 | 214182 | 1114.26 | 654 | 625 | 191.7 |
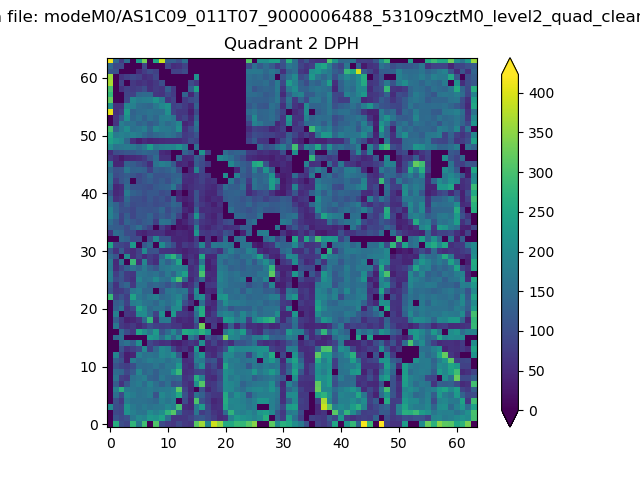
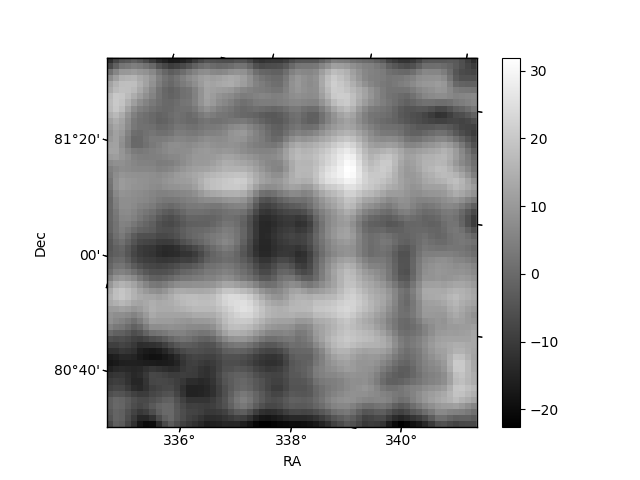
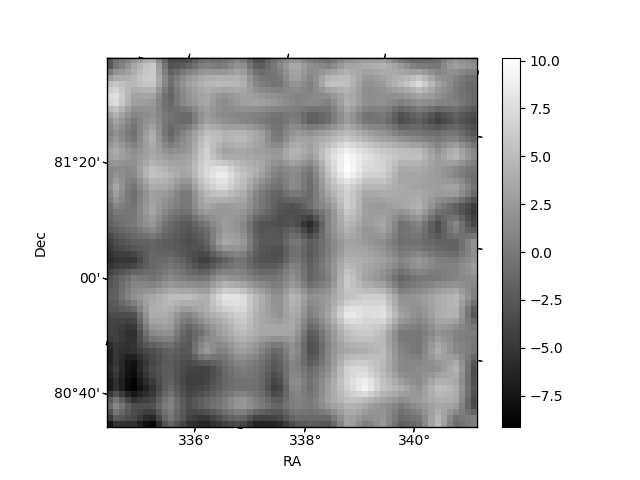
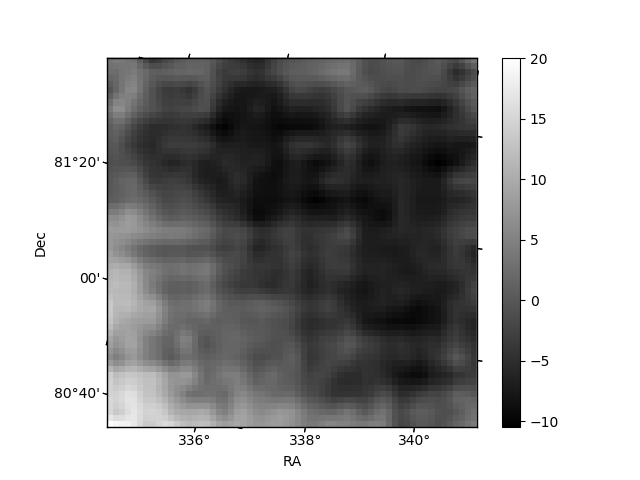
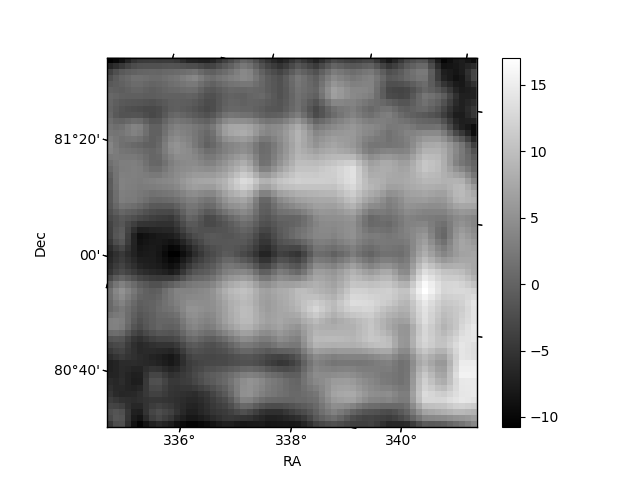
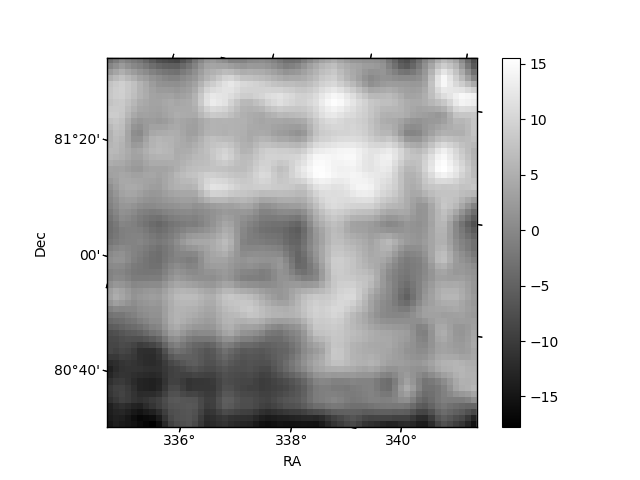
Histogram calculated using DETX and DETY for each event in the final _common_clean file
| Quadrant A | 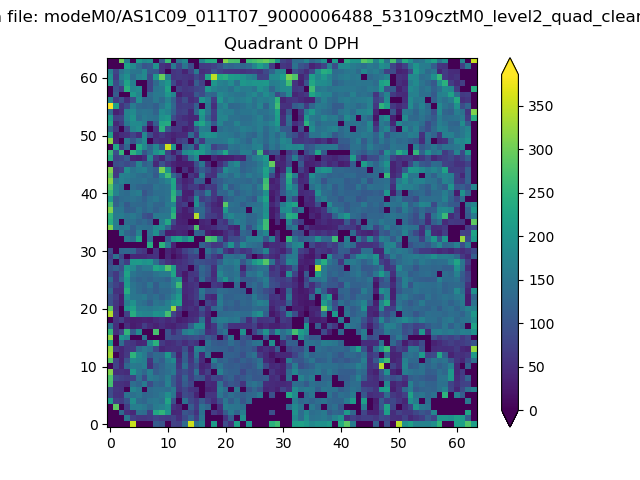 |
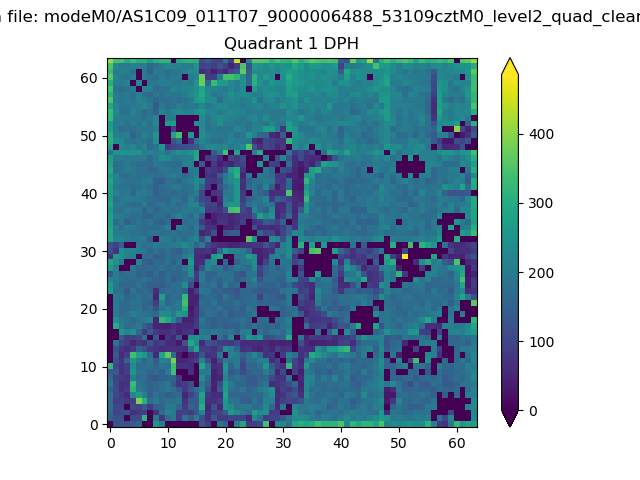 |
Quadrant B |
|---|---|---|---|
| Quadrant D | 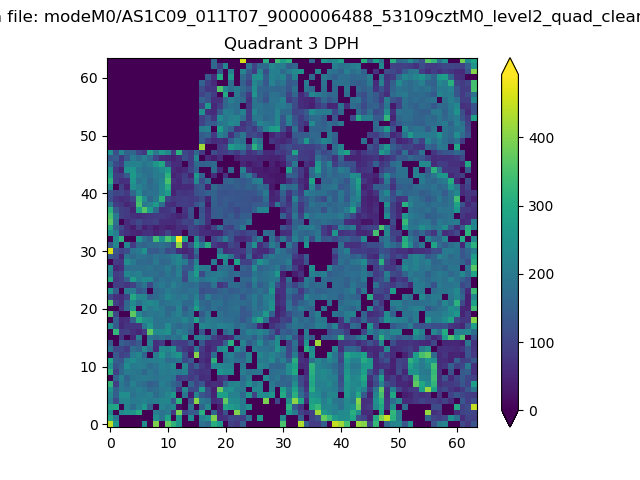 |
 |
Quadrant C |
| Plot type | Count rate plots | Images |
|---|---|---|
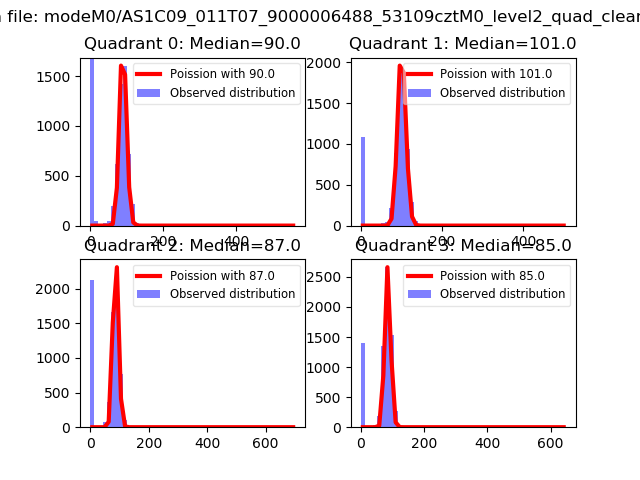
| Comparison with Poisson distribution Blue bars denote a histogram of data divided into 1 sec bins. Red curve is a Poisson curve with rate = median count rate of data. |
 |
 |
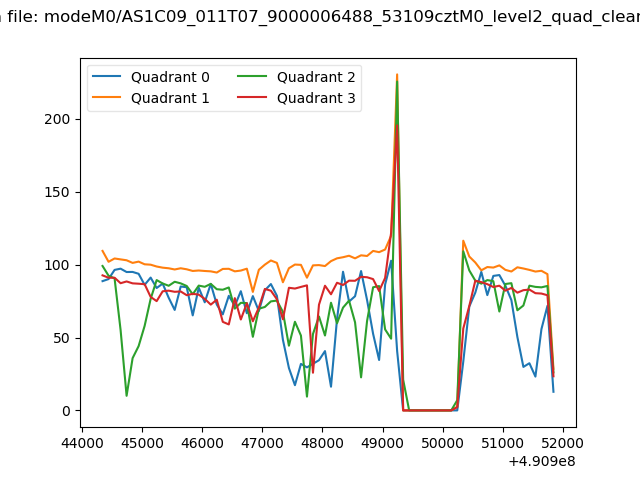
| Quadrant-wise count rates Data is divided into 100 sec bins |
 |
|
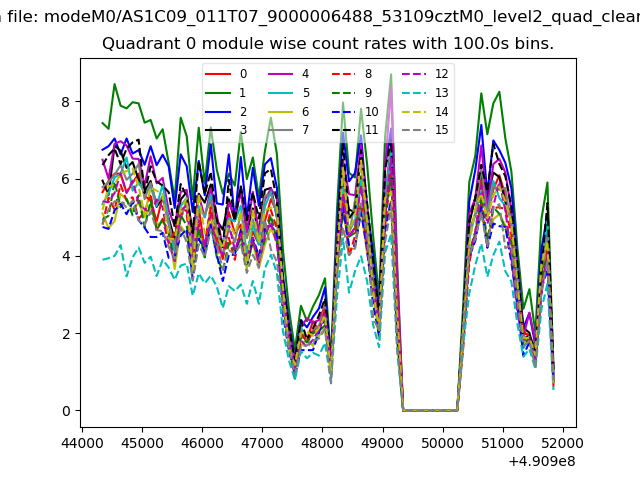
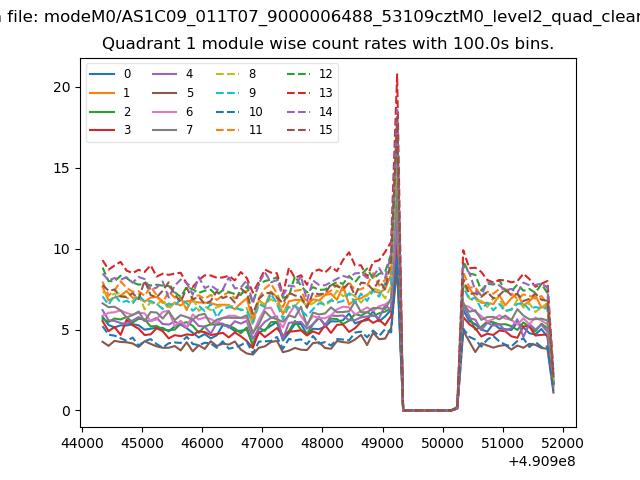
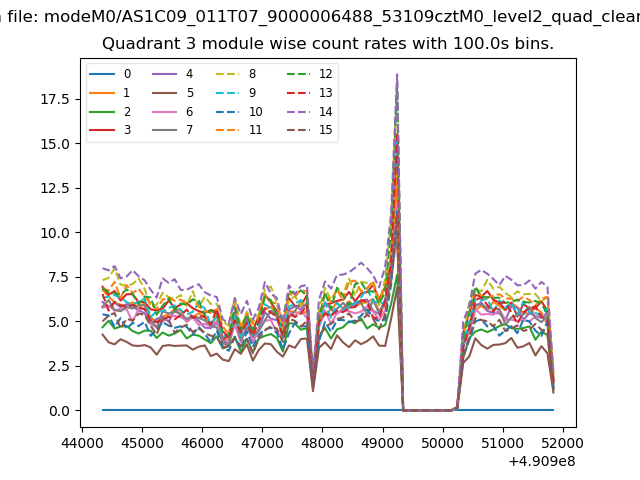
| Module-wise count rates for Quadrant A Data is divided into 100 sec bins |
 |
 |
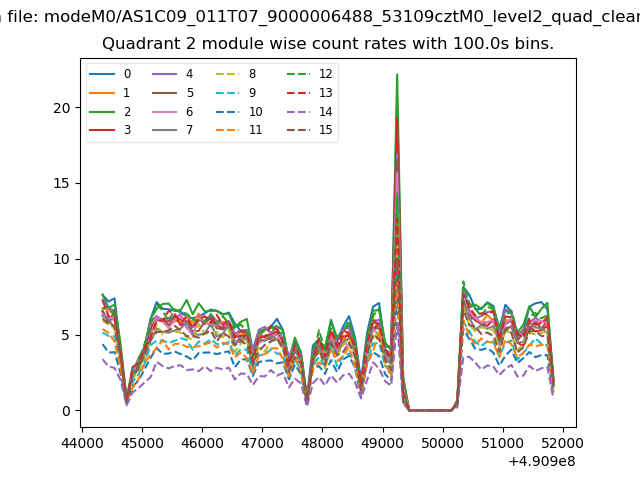
| Module-wise count rates for Quadrant B Data is divided into 100 sec bins |
 |
 |
| Module-wise count rates for Quadrant C Data is divided into 100 sec bins |
 |
 |
| Module-wise count rates for Quadrant D Data is divided into 100 sec bins |
 |
 |
| Parameter | Plot |
|---|---|
| CZT HV Monitor | 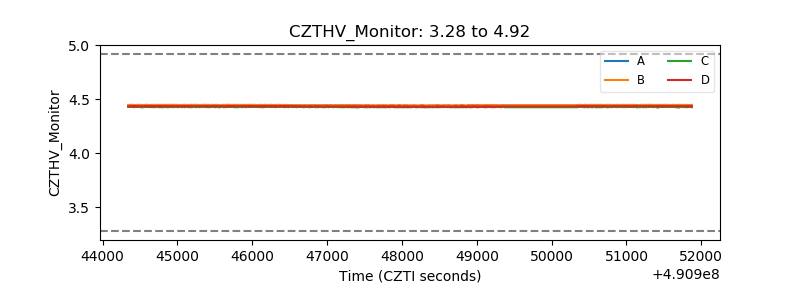 |
| D_VDD | 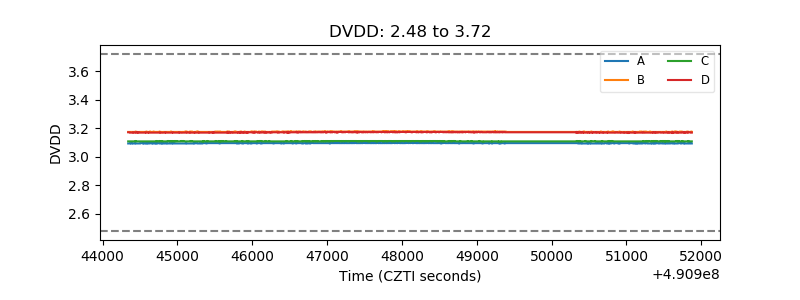 |
| Temperature 1 | 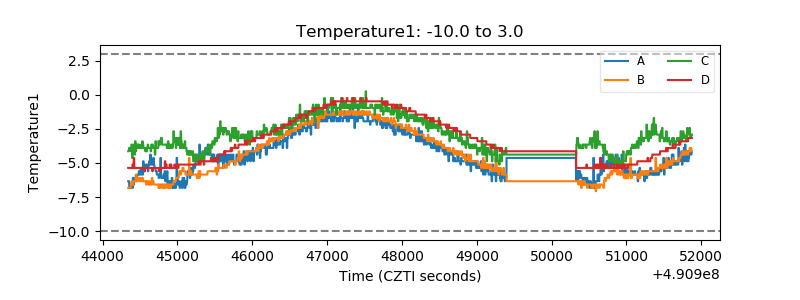 |
| Veto HV Monitor | 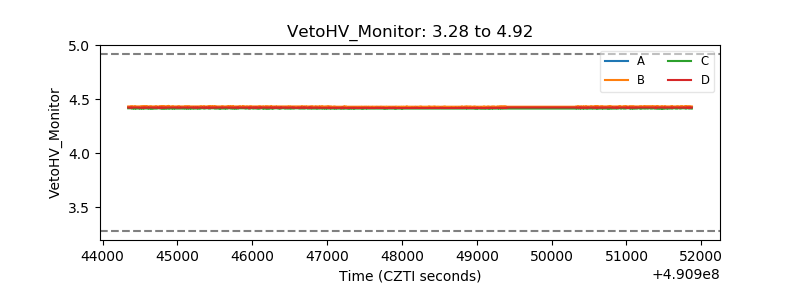 |
| Veto LLD | 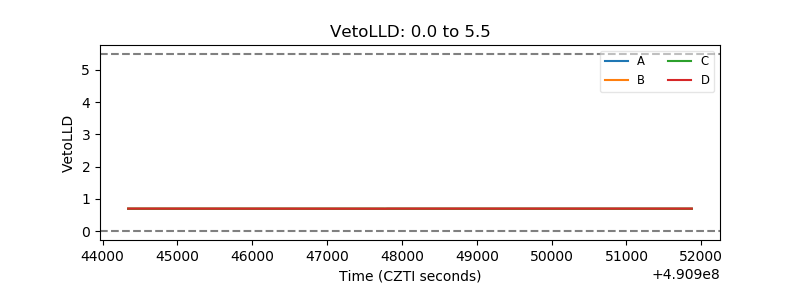 |
| Alpha Counter | 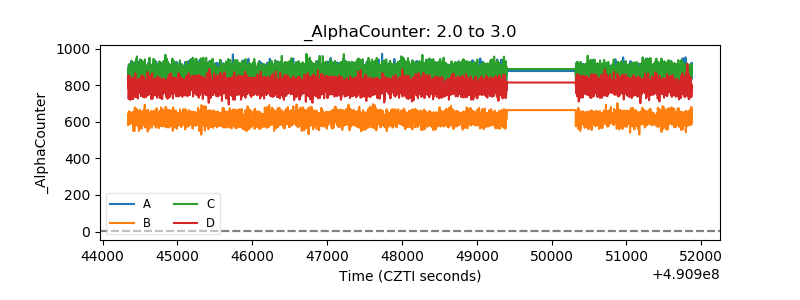 |
| _CPM_Rate | 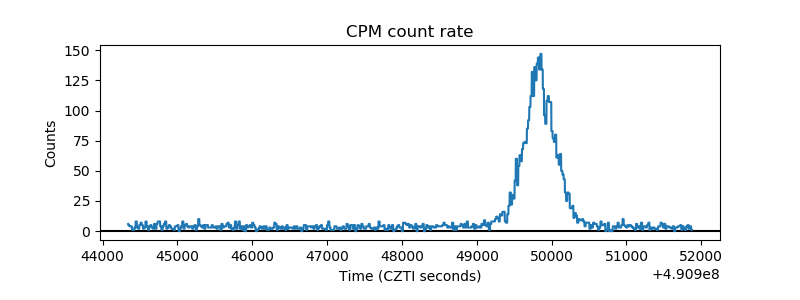 |
| CZT Counter | 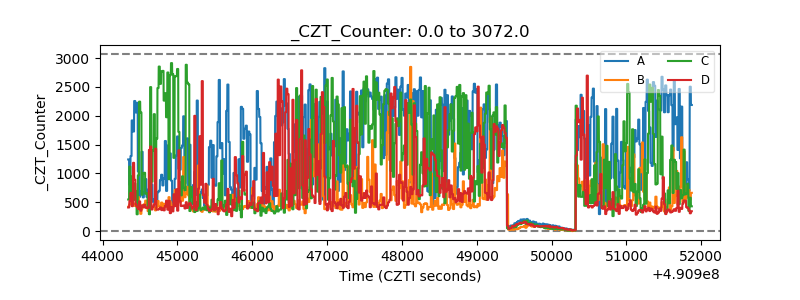 |
| +2.5 Volts monitor |  |
| +5 Volts monitor |  |
| _ROLL_ROT | 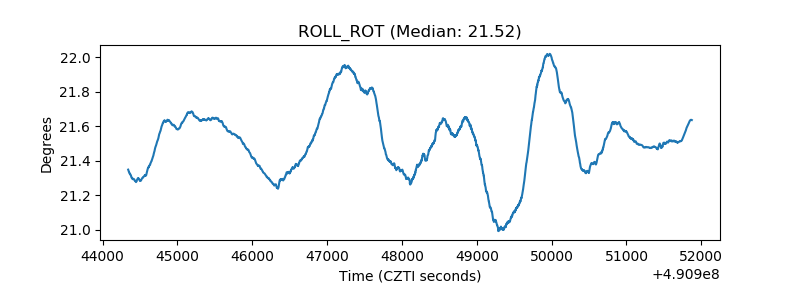 |
| _Roll_DEC | 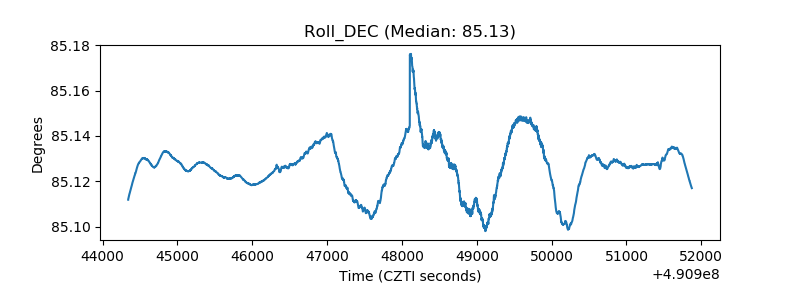 |
| _Roll_RA | 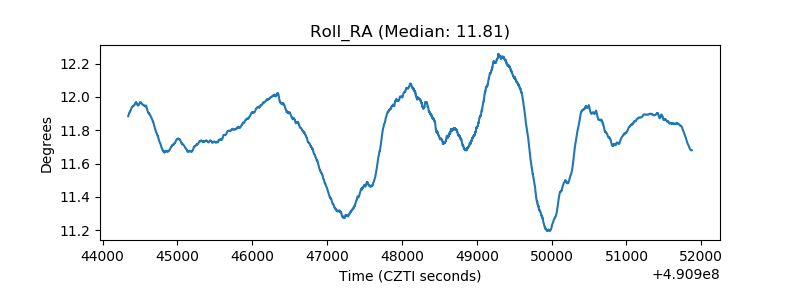 |
| Veto Counter | 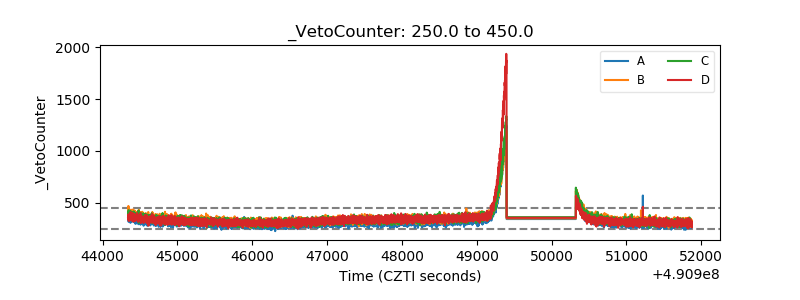 |